Abstract
Background: Gastric cancer is the fifth most prevalent malignancy worldwide, and the third leading cause of cancer-related death. Activating mutations of the JAK/STAT pathway on cellular biological process, inflammation, and immunity of cancer cells have made them promising biomarkers for drug exploitation and malignancy treatment. Specific functions of the STAT family in stomach adenocarcinoma (STAD) have not yet been systematically described. Methods: Bioinformatics web resources, including UALCAN, The Kaplan Meier plotter, and GSCALite, were used to identify immune checkpoint inhibitors and biomarkers among the STAT family in STAD. Results: STAT1, STAT4, STAT5A, and STAT6 were upregulated in STAD at both the mRNA and protein level. STAT1 and STAT5A may act as potential prognostic and prognostic biomarkers in STAD. Among all members of the STAT family, STAT5B (33%), STAT1 (27%), and STAT5A (18%) were the top three frequently mutated genes, and missense mutations were the most common types of genetic alteration. The STAT family has mainly been associated with the activity of several well-known cancer-associated pathways. Low expression of STAT5A and STAT5B were resistant to most of drugs or small molecules in the Genomics of drug Sensitivity in Cancer (GDSC). The functions and pathways of STAT5A in STAD were mainly associated with immune responses, chemokine signaling pathways, and cell adhesion molecules. In addition, we identified several STAT5A associated-targets (transcription factor, kinase, and miRNA targets). Immuno-infiltration analysis suggested a strong association between the STAT5A level, the abundance of immune cells, and the level of immune biomarkers. Conclusions: We identified the immune checkpoint inhibitor and biomarkers among the STAT family in STAD, thereby providing additional information about the significant role of the STAT family in STAD.
Keywords: Stomach adenocarcinoma, biomarker, bioinformatics analysis, immune checkpoint inhibitor, STAT family
Introduction
Gastric cancer is the fifth most prevalent malignancy worldwide, and the third leading cause of cancer-related death [1]. Although identification of Helicobacter pylori (H. pylori) has reduced the incidence of gastric cancer, 1.3 million patients were estimated to be diagnosed with gastric cancer and 819,000 patients were estimated to die of gastric cancer-related diseases in 2015 in developed countries [2,3]. Gastric adenocarcinoma (stomach adenocarcinoma, STAD) is the most common subtype of gastric cancer, ranking over 95% of all gastric cancer cases. The current therapeutic landscape for gastric cancer is limited, and the prognosis of patients in advanced or metastatic disease is disastrous with an overall survival of about 12 months [4]. Therefore, exploration and identification of immune checkpoint inhibitors and biomarkers for diagnosis, therapy, and prognosis of STAD would is of utmost importance.
Increasing evidence has clarified the regulation of JAK/STAT signaling cytokines and the action of interferons, thereby affecting gene expression [5]. Activating mutations of JAK/STAT signaling or members of cellular biological process, inflammation and immunity of cancer cells have made them promising biomarkers for drug exploitation and malignancy treatment [5,6]. A total of seven members of the STAT family have been identified in mammals, including STAT1/2/3/4/5A/5B/6. The STAT family was proposed as biomarkers or immune checkpoint inhibitors for the prognosis prediction or therapy in various types of solid tumors, including STAT3 and STAT5A in breast cancer [7,8], STAT3, STAT5A, and STAT6 in lung cancer [9], and STAT3 and STAT5A in prostatic cancer [10]. However, specific functions of the STAT family in STAD have not yet been systematically described.
In our study, we performed comprehensive analysis of expression of members of the STAT family, and their correlation with clinicopathological parameters and patients’ survival was evaluated in primary STAD. Moreover, we analyzed genetic alterations and chemotherapy resistance of the STAT family. The association between STAT2 with immune cells and biomarkers, and the functional regulation network of STAT2 in primary STAD were also explored. Taken together, our results may provide more evidence on the significance of STAT family members in primary STAD.
Materials and methods
Oncomine
Oncomine, a comprehensive and user-friendly platform for gene expression, pathway, and network analysis, contains 715 datasets of 86733 samples [11]. The mRNA level of the STAT family in primary STAD was explored using Oncomine (P < 0.05, fold-change (FC) =2).
UALCAN
UALCAN is designed for gene expression analysis, prognosis analysis, and methylation analysis and is based on data of The Cancer Genome Atlas Program (TCGA) [12]. TCGA is a landmark cancer genomics program, and molecularly characterized over 20,000 primary cancer and matched normal samples spanning 33 cancer types. Gene expression of the STAT family and STAT family expression in molecular subtypes of STAD were explored using UALCAN using a primary STAD TCGA dataset (n=415). P < 0.05 indicated statistical significance.
The human protein atlas
As a comprehensive bioinformatics web resource, The Human Protein Atlas is designed for mapping all human proteins [13]. The tissue atlas and the human pathology atlas module were used to determine the protein level of STAT family members in STAD.
The Kaplan Meier plotter (KM plotter)
The Kaplan Meier plotter (KM plotter) is a comprehensive bioinformatics tool designed for evaluating the prognostic value of input genes in cancer patients [14]. The STAT family was submitted to KM plotter and the prognostic significance of the STAT family in cancer patients was evaluated. The survival analysis comprised overall survival (OS), post progression survival (PPS), and first progression (FP) analysis. Patients were divided by the medium value of gene expression. All survival curves were created by the Kaplan Meier method.
GSCALite
As a bioinformatics platform for gene set cancer analysis, GSCALite offers several type of analyses, including methylation analysis, cancer-related pathway analysis, miRNA network analysis, etc. [15]. In the current study, GSCALite was used to analyze the CNV profile of the STAT family in primary STAD. Moreover, the effect of the STAT family in cancer-related signaling and the correlation between expression of the STAT family and drug sensitivity based on the data of Genomics of drug Sensitivity in Cancer (GDSC) were analyzed. In cancer-related pathway analysis, gene expression was divided into 2 groups (group High and group Low) by median expression. The difference of the pathway activity score (PAS) between groups was defined by student T test. The Spearman correlation was used to explore the correlation between the gene expression and drug sensitivity. All analyses were performed using the STAD TCGA dataset (n=415).
LinkedOmics
LinkedOmics is a bioinformatics web portal designed for accessing, analyzing, and comparing cancer multi-omics data of various types of cancer [16]. We submitted STAT5A to the primary TCGA STAD datasets of 415 STAD patients and analyzed STAT5A-associated genes using the Pearson Correlation test. In the “LinkInterpreter” module, Gene Set Enrichment Analysis (GSEA) was conducted to explore the enrichment function of STAT5A and neighboring genes with 3 as the minimum number of genes and 0.05 as the p-value. Enrichment analysis involved GO and KEGG pathways, kinase, miRNA, and transcription factor-target analysis.
GENEMANIA
GENEMANIA (http://genemania.org/) can help us better understand the potential functions and other associated genes of our candidate genes via the protein-protein interaction (PPI) network [17].
TIMER
TIMER is a comprehensive resource for systematical analysis of immune infiltrates across diverse cancer types [18]. We analyzed STAT5A expression and the correlation with immune cell infiltrates in the “Gene” module using the primary STAD TCGA dataset (n=415). In the “correlation” module, we analyzed STAT5A expression and its correlation with gene biomarkers (Table 3) of immune cells [19-21]. All analyses were performed using Spearman correlation and P < 0.05 indicated statistical significance.
Table 3.
Correlation analysis between STAT5A and gene biomarkers of immune cells in STAD (TIMER)
| Immune cells | Biomarkers | None | Purity | ||
|---|---|---|---|---|---|
|
|
|
||||
| Cor | P-value | Cor | P-value | ||
| CD8+ T cell | CD8A | 0.514 | *** | 0.479 | *** |
| CD8B | 0.292 | *** | 0.259 | *** | |
| T cell (general) | CD3D | 0.461 | *** | 0.424 | *** |
| CD3E | 0.489 | *** | 0.454 | *** | |
| CD2 | 0.488 | *** | 0.455 | *** | |
| B cell | CD19 | 0.385 | *** | 0.356 | *** |
| CD79A | 0.392 | *** | 0.362 | *** | |
| Monocyte | CD86 | 0.437 | *** | 0.416 | *** |
| CD115 (CSF1R) | 0.496 | *** | 0.488 | *** | |
| TAM | CCL2 | 0.258 | *** | 0.228 | *** |
| CD68 | 0.313 | *** | 0.296 | *** | |
| IL10 | 0.436 | *** | 0.411 | *** | |
| M1 Macrophage | INOS (NOS2) | 0.103 | * | 0.104 | * |
| IRF5 | 0.295 | *** | 0.257 | *** | |
| COX2 (PTGS2) | 0.06 | 0.224 | 0.044 | 0.392 | |
| M2 Macrophage | CD163 | 0.465 | *** | 0.452 | *** |
| VSIG4 | 0.386 | *** | 0.376 | *** | |
| MS4A4A | 0.476 | *** | 0.452 | *** | |
| Neutrophils | CD66b (CEACAM8) | -0.019 | 0.693 | -0.041 | 0.429 |
| CD11b (ITGAM) | 0.565 | *** | 0.548 | *** | |
| CCR7 | 0.452 | *** | 0.42 | *** | |
| Natural killer cell | KIR2DL1 | 0.18 | *** | 0.147 | ** |
| KIR2DL3 | 0.165 | *** | 0.129 | * | |
| KIR2DL4 | 0.233 | *** | 0.186 | *** | |
| KIR3DL1 | 0.22 | *** | 0.202 | ** | |
| KIR3DL2 | 0.317 | *** | 0.285 | *** | |
| KIR3DL3 | 0.074 | 0.133 | 0.064 | 0.214 | |
| KIR2DS4 | 0.133 | ** | 0.094 | 0.0674 | |
| Dendritic cell | HLA-DPB1 | 0.477 | *** | 0.454 | *** |
| HLA-DQB1 | 0.395 | *** | 0.349 | *** | |
| HLA-DRA | 0.48 | *** | 0.45 | *** | |
| HLA-DPA1 | 0.49 | *** | 0.463 | *** | |
| BDCA-1 (CD1C) | 0.392 | *** | 0.356 | *** | |
| BDCA-4 (NRP1) | 0.342 | *** | 0.306 | *** | |
| CD11c (ITGAX) | 0.487 | *** | 0.466 | *** | |
| Th1 | T-bet (TBX21) | 0.525 | *** | 0.497 | *** |
| STAT4 | 0.467 | *** | 0.452 | *** | |
| STAT1 | 0.241 | *** | 0.226 | *** | |
| IFN-γ (IFNG) | 0.291 | *** | 0.267 | *** | |
| TNF-α (TNF) | 0.206 | *** | 0.165 | ** | |
| Th2 | GATA3 | 0.357 | *** | 0.321 | *** |
| STAT6 | 0.235 | *** | 0.251 | *** | |
| STAT5A | - | - | - | - | |
| IL13 | 0.131 | ** | 0.138 | *** | |
| Tfh | BCL6 | 0.263 | *** | 0.235 | *** |
| IL21 | 0.312 | *** | 0.27 | *** | |
| Th17 | STAT3 | 0.45 | *** | 0.43 | *** |
| IL17A | -0.098 | 0.0469 | -0.106 | 0.04 | |
| Treg | FOXP3 | 0.45 | *** | 0.419 | *** |
| CCR8 | 0.505 | *** | 0.481 | *** | |
| STAT5B | 0.516 | *** | 0.533 | *** | |
| TGFb (TGFB1) | 0.367 | *** | 0.357 | *** | |
| T cell exhaustion | PD-1 (PDCD1) | 0.482 | *** | 0.448 | *** |
| CTLA4 | 0.351 | *** | 0.308 | *** | |
| LAG3 | 0.393 | *** | 0.364 | *** | |
| TIM-3 (HAVCR2) | 0.49 | *** | 0.467 | *** | |
| GZMB | 0.269 | *** | 0.227 | *** | |
*P < 0.05, **P < 0.01, ***P < 0.001.
Results
The expression of STAT family in STAD
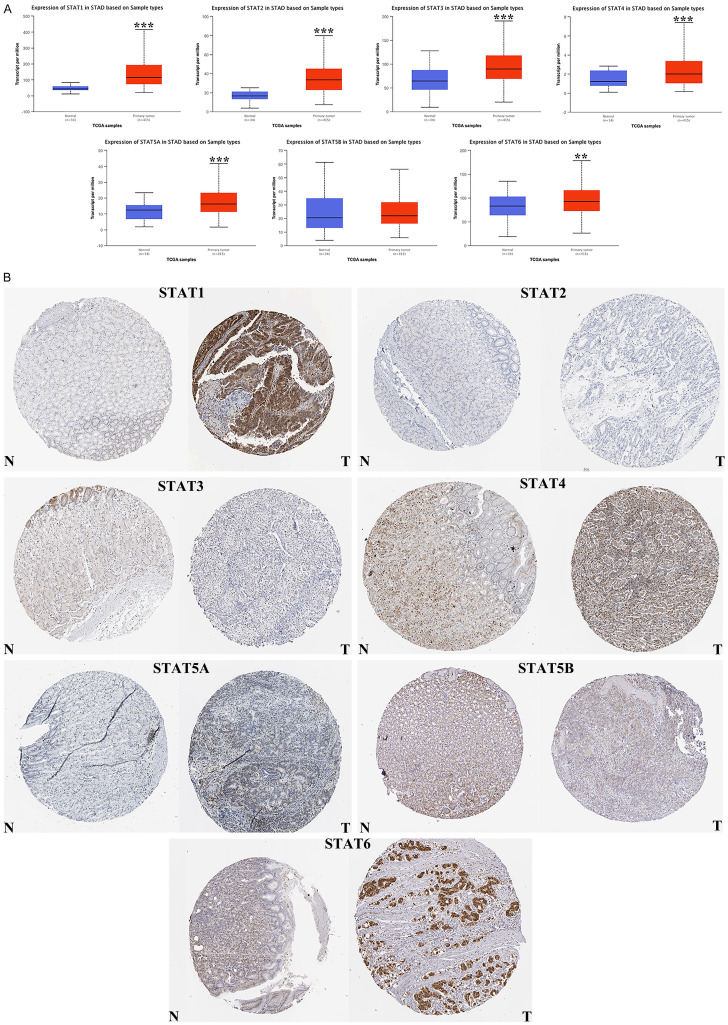
The expression level of the STAT family in primary STAD was first determined via Oncomine, which revealed seven members of the STAT family in human beings (Figure 1). Table 1 presents the mRNA level of the STAT family in primary STAD, revealing that STAT1/3/5A/5B were upregulated in tumor tissues compared with gastric tissue. Data obtained by Chen et al. revealed an upregulation of STAT1 in gastric intestinal type adenocarcinoma (fold change =2.703, P=6.96E-15) and gastric mixed adenocarcinoma (fold change =2.449, P=1.34E-04)[22]. Three data sets indicated that STAT3 was upregulated in STAD [23]. Data by Mariarosaria et al. showed that STAT5A (FC=2.563) and STAT5B (FC=2.895) were upregulated in STAD (P=4.53E-04 and P=5.59E-04, respectively). We also determined the expression level of the STAT family in STAD using the TCGA database. When compared with gastric tissue, the expression of STAT1, STAT2, STAT3, STAT4, STAT5A, and STAT6 was significantly elevated in STAD tissue (Figure 2A, all P < 0.01). Expression of the STAT family in STAD at the protein level was also determined using The Human Protein Atlas, which demonstrated that high protein expression of STAT1, STAT4, STAT5A, and STAT6 was observed in cancer tissues (Figure 2B).
Figure 1.
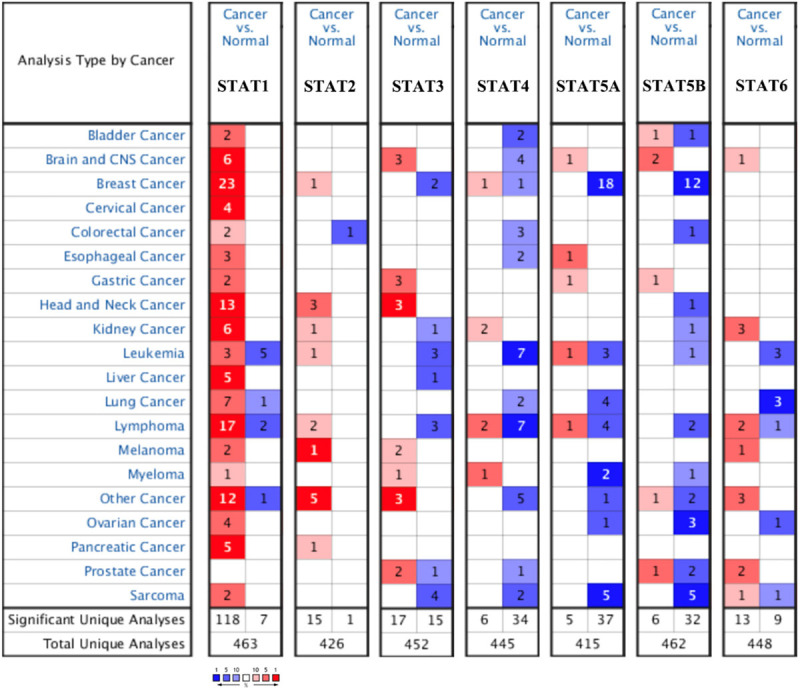
STAT family expression in STAD at mRNA level (ONCOMINE). The number in the Figure was the numbers of datasets with statistically significant (P < 0.01) mRNA over-expression (red) or down-expression (blue) of STAT family, which was obtain with the P-value of 0.05 and fold change of 2.
Table 1.
The mRNA levels of STAT family in STAD (ONCOMINE)
| TLR | Type | Fold Change | P value | t-test | Reference |
|---|---|---|---|---|---|
| STAT1 | Gastric Intestinal Type Adenocarcinoma | 2.703 | 6.96E-15 | 9.751 | PMID:12925757 |
| Gastric Mixed Adenocarcinoma | 2.449 | 1.34E-04 | 5.291 | PMID:12925757 | |
| STAT2 | NA | NA | NA | NA | NA |
| STAT3 | Gastric Mixed Adenocarcinoma | 2.190 | 6.45E-06 | 7.834 | PMID:19081245 |
| Diffuse Gastric Adenocarcinoma | 2.096 | 4.08E-04 | 5.117 | PMID:19081245 | |
| Gastric Intestinal Type Adenocarcinoma | 2.252 | 2.26E-10 | 7.653 | PMID:19081245 | |
| STAT4 | NA | NA | NA | NA | NA |
| STAT5A | Gastric Mixed Adenocarcinoma | 2.563 | 4.53E-04 | 5.012 | PMID:19081245 |
| STAT5B | Gastric Mixed Adenocarcinoma | 2.895 | 5.59E-04 | 5.077 | PMID:19081245 |
| STAT6 | NA | NA | NA | NA | NA |
Figure 2.
The expression of STAT family in STAD. A. The expression of STAT1, STAT2, STAT3, STAT4, STAT5A and STAT6 were significant elevated in STAD tissues at mRNA level (UALCAN). B. High protein expression of STAT1, STAT4, STAT5A and STAT6 were obtained in tumor tissues (The Human Protein Atlas). *P < 0.05, **P < 0.01, ***P < 0.001. T, tumor tissues; N, normal tissues.
The prognostic value of the STAT family in STAD
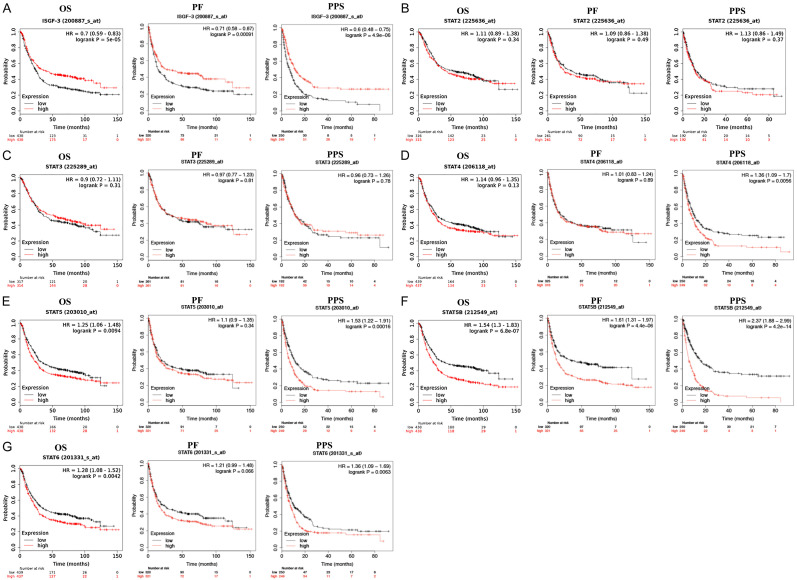
The prognostic value the STAT family in STAD was evaluated using KM plotter and the results are presented in Figure 3. The mRNA level of STAT1 was significantly associated with a better OS (P=5e-05), PF (P=0.00091), and PPS (P=4.9e-06) (Figure 3A). As shown in Figure 3B-D, increased mRNA levels of STAT2, STAT3, and STAT4 had little influence on the prognosis of STAD patients (OS, PF, and PPS). STAD patients with a high STAT5A level experienced a poor OS (P=0.0094) and PPS (P=0.00016) (Figure 3E). Similarly, STAD patients with a high STAT5B level experienced a poor OS (P=6.8e-07), PF (P=4.4e-06), and PPS (P=4.2e-14) compared with patients with a low STAT5B level (Figure 3F). For the prognostic value of STAT6 in STAD, we observed a poor OS (P=0.0042) and PPS (P=0.0063) in patients. Therefore, STAT1/5A/5B/6 may act as potential prognostic biomarkers in STAD (Figure 3G).
Figure 3.
The prognostic value of STAT family in STAD (KM plotter). A. STAD patients with high STAT1 mRNA level had a better OS, PF and PPS. B, C. The mRNA levels of STAT2 and STAT3 had no effect on STAD patients’ prognosis (OS, PF, and PPS). D. STAD patients with high STAT1 mRNA level had a worse PPS. E. STAD patients with high STAT5A level would experience a poor OS and PPS. F. STAD patients with high STAT5B level would experience a poor OS, PF, and PPS. G. STAD patients with high STAT6 level had a poor OS and PPS. All the analyses were performed with Kaplan-Meier analysis. HR, Hazard Ratio; OS, overall survival; PPS, post progression survival; FP, first progression.
The diagnostic value of the STAT family in STAD
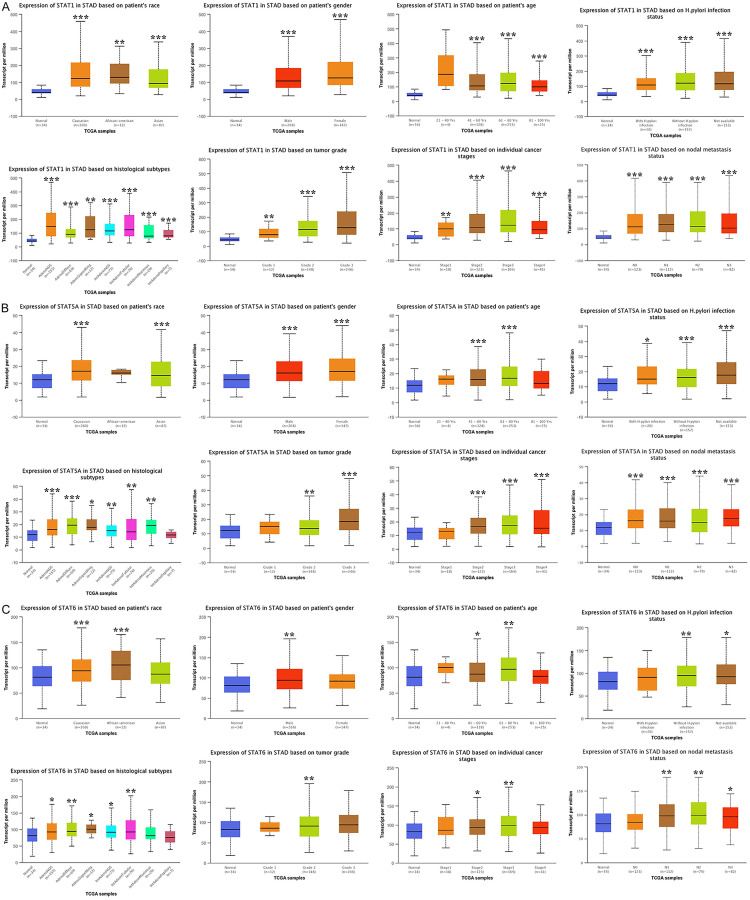
The above-mentioned results revealed that STAT1/5A/6 was elevated in STAD (at both the mRNA and protein level) and was associated with a patients’ prognosis. Thus, we determined the level of STAT1/5A/6 in STAD by performing sub-group analysis to evaluate their diagnostic value. We observed that the mRNA level of STAT1 and STAT5A was upregulated in STAD by sub-group analyses based on patients’ race, gender, and age, and H. pylori infection status, histological subtypes, tumor grade, individual cancer stages, and nodal metastasis status (Figure 4A, 4B). Therefore, STAT1/5A/6 may play a significant role in STAD aggressiveness. However, although some of the results were significant, the STAT6 results were non-ideal in sub-group analyses (Figure 4C). Thus, STAT1 and STAT5A may act as potential diagnostic markers in STAD.
Figure 4.
The expression of STAT1, STAT5A, and STAD6 in STAD in sub-group analyses (UALCAN). A, B. STAT1 and STAT5A were upregulated in STAD tissues in sub-group analyses based on patients’ race, patients’ gender, patients’ age, H. pylori infection status, histological subtypes, tumor grade, individual cancer stages, and nodal metastasis status. C. STAT6 were upregulated in STAD tissues in certain sub-group analyses based on patients’ race, patients’ gender, patients’ age, H. pylori infection status, histological subtypes, tumor grade, individual cancer stages, and nodal metastasis status. *P < 0.05, **P < 0.01, ***P < 0.001.
Genetic alteration, pathway and drug sensitivity analysis of STAT family in STAD
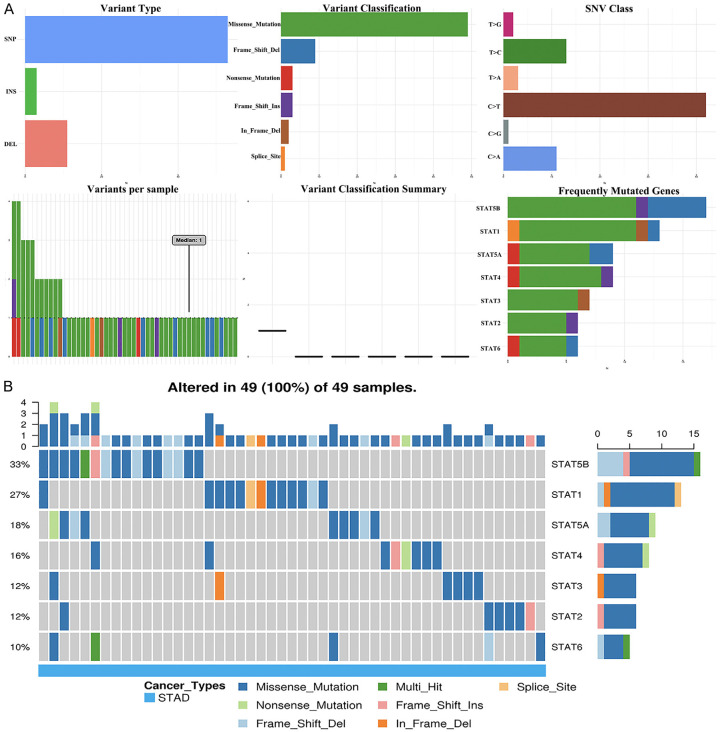
Because of the importance of the STAT family in STAD, genetic alteration, pathway, and drug sensitivity analysis of the STAT family were performed. As shown in Figure 5A, genetic alteration of the STAT family involved single nucleotide polymorphism (SNP), insertion, and deletion. The altered form and frequency are shown in Figure 5B. Among all members of the STAT family, STAT5B (33%), STAT1 (27%), and STAT5A (18%) were the top three most frequently mutated genes (Figure 5B). The most common genetic alterations were missense mutation (Figure 5B). In common cancer related pathways (TSC/mTOR, RTK, RAS/MAPK, PI3K/AKT, hormone ER, hormone AR, EMT, DNA damage response, cell cycle, apoptosis pathways) analysis, we observed that the STAT family was mainly associated with the activity of apoptosis, cell cycle, DNA damage response, EMT, hormone ER, and RAS/MAPK pathways (Supplementary Figure 1). We next evaluated the role of the STAT family level in drug sensitivity. As shown in Figure 6, a low STAT5B level was resistant to 56 drugs or small molecules, whereas a low STAT5A level was resistant to 42 drugs or small molecules (Figure 6). The results may suggest that STAT5A is a potential biomarker for drug screening.
Figure 5.
The single nucleotide variation (SNV) analysis of STAT family in STAD (GSCALite). A. Summary plot displays SNV frequency and variant types of STAT family in STAD, and genetic alteration of STAT family constitutes SNP, insertion and deletion. B. Waterfall plot shows the mutation distribution of STAT family in STAD and STAT5B (33%), STAT1 (27%), and STAT5A (18%) were the top three frequently mutated genes among all the numbers of STAT family.
Figure 6.
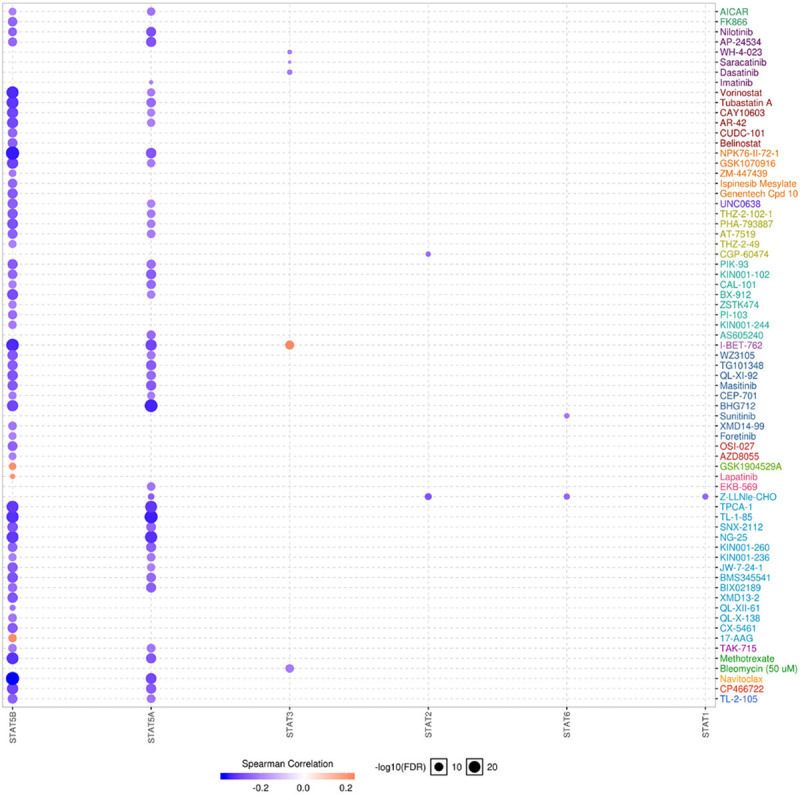
The drug resistance analysis of STAT family based on GDSC IC50 drug data (GSCALite). The Spearman correlation represent the gene expression correlates with the drug. The positive correlation means that the gene high expression is resistant to the drug, vise verse. Low STAT5B level is resistant to 56 drugs or small molecule and low STAT5A level is resistant to 42 drugs or small molecules.
Enrichment analysis of STAT5A and correlated genes in STAD
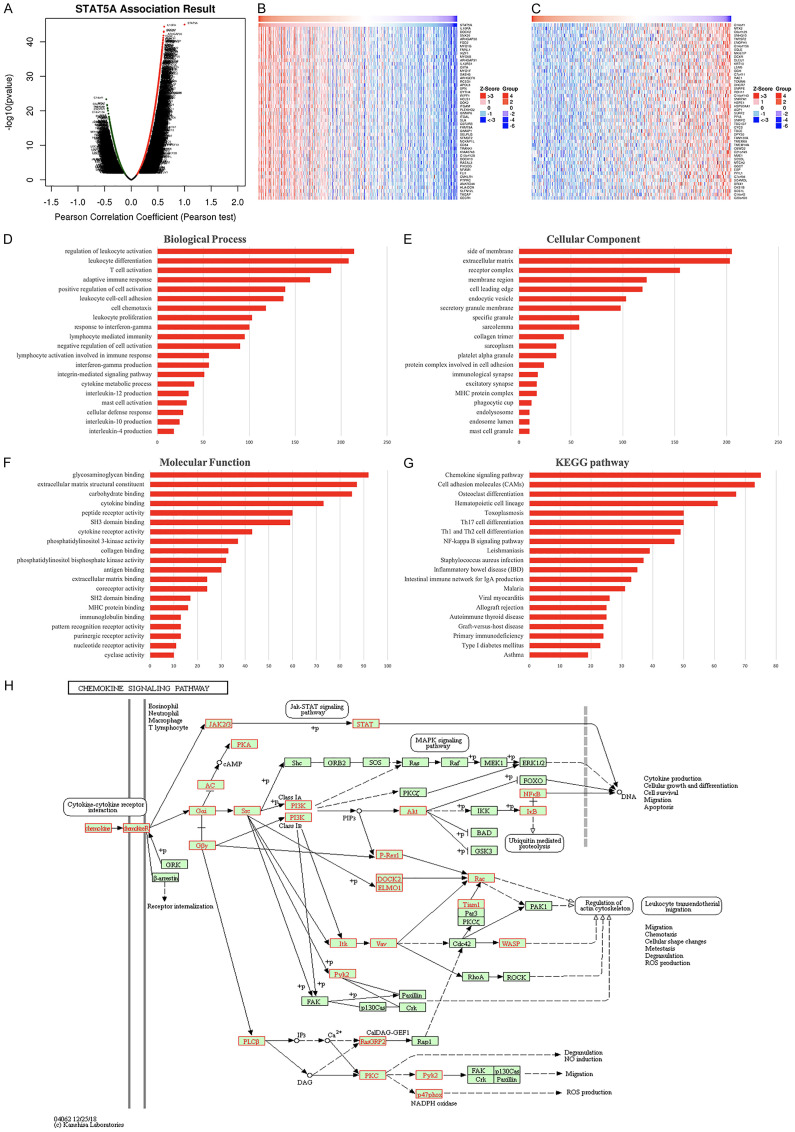
The above-mentioned results revealed that STAT5A may be of significance in STAD and may serve as a biomarker in the diagnosis, prognosis, target therapy, and drug screening. Thus, we selected STAT5A for further analysis. The co-expression genes correlation analysis in Figure 7A revealed that 5786 genes positively correlated with STAT5A, and 4934 genes negatively correlated with STAT5A in STAD. Figure 7B and 7C show the top fifty genes that are most significantly associated with STAT5A in STAD, respectively. As shown in Supplementary Figure 2, IL10RA (cor=0.618, P=3.98E-45), DOCK2 (cor=0.610, P=9.84E-44), and SNX20 (cor=0.609, P=1.49E-43) were most positively associated with STAT5A in STAD. This was followed by function analysis of STAT5A and associated genes. Enrichment analysis by GO indicating that the role of STAT5A in STAD was associated with leukocyte activation and differentiation, immune responses, cell adhesion and chemotaxis, extracellular matrix structural constituents, and cytokine binding (Figure 7D-F). Moreover, the functions of STAT5A in STAD were mainly associated with chemokine signaling pathway, cell adhesion molecules (CAMs), toxoplasmosis, and Th1/2/17 cell differentiation by KEGG pathway analysis (Figure 7G and 7H).
Figure 7.
The enrichment analysis of STAT5A in STAD (LinkedOmics). A. A Pearson test was used to analyze correlations between STAT5A and genes differentially expressed in STAD. B, C. Heat maps showing genes positively and negatively correlated with STAT5A in STAD (TOP 50). Red indicates positively correlated genes and green indicates negatively correlated genes. D-F. Heatmap of GO enrichment in CC terms, BP terms and MF terms. G. KEGG pathways analysis. H. KEGG pathway annotations of the chemokine signaling pathway. GO and KEGG were performed by Gene Set Enrichment Analysis. GO, gene ontology; KEGG, Kyoto Encyclopedia of Genes and Genomes; BP, biological process; CC, molecular function; MF, molecular functions.
Kinase, miRNA and transcription factor targets of STAT5A in STAD
For kinase targets of STAT5A in STAD, the results suggested that kinases LCK, LYN, SYK, JAK3, and HCK were the most significant targets (Table 2). Regarding miRNA targets in Table 2, the most significant targets were GTGCCAA (MIR-96), TGCACTT (MIR-519C, MIR-519B, MIR-519A), TGCACTG (MIR-148A, MIR-152, MIR-148B), GTGCCTT (MIR-506), and TATTATA (MIR-374). The transcription factor-target network was mainly associated with V$IRF_Q6, V$NFKB_Q6_01, V$ELF1_Q6, V$PEA3_Q6, and V$PU1_Q6 (Table 2). We also constructed PPI network using GeneMANIA to explore the potential functions of the kinases LCK network, miRNA-96 network, and V$IRF_Q6 network. Genes of the LCK kinase network were mainly responsible for T cell activation, receptor signaling pathways, and immune responses (Figure 8). Genes of the miR-96 network were mainly responsible for immune responses and system process regulation (Supplementary Figure 3). Furthermore, genes of the V$IRF_Q6 network were mainly responsible for type I interferon, positive regulation of cytokine production, and antigen processing and presentation (Supplementary Figure 4).
Table 2.
The Kinase, miRNA and transcription factor-target networks of STAT5A in STAD (LinkedOmics)
| Enriched Category | Geneset | LeadingEdgeNum | P Value |
|---|---|---|---|
| Kinase Target | Kinase_LCK | 29 | 0 |
| Kinase_LYN | 30 | 0 | |
| Kinase_SYK | 16 | 0 | |
| Kinase_JAK3 | 8 | 0 | |
| Kinase_HCK | 17 | 0 | |
| miRNA Target | GTGCCAA, MIR-96 | 91 | 0 |
| TGCACTT, MIR-519C, MIR-519B, MIR-519A | 140 | 0 | |
| TGCACTG, MIR-148A, MIR-152, MIR-148B | 97 | 0 | |
| GTGCCTT, MIR-506 | 213 | 0 | |
| TATTATA, MIR-374 | 105 | 0.002 | |
| Transcription Factor Target | V$IRF_Q6 | 104 | 0 |
| V$NFKB_Q6_01 | 57 | 0 | |
| V$ELF1_Q6 | 84 | 0 | |
| V$PEA3_Q6 | 81 | 0 | |
| V$PU1_Q6 | 150 | 0 |
Figure 8.
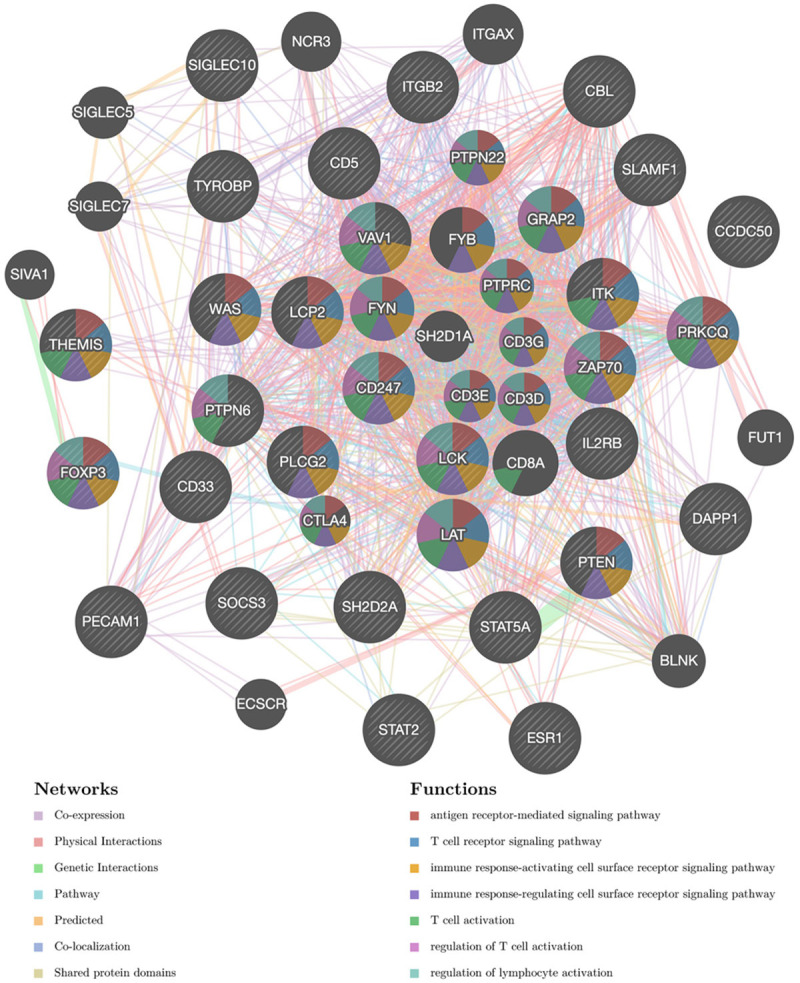
Protein-protein interaction (PPI) network of LCK kinase-target networks (GeneMANIA). PPI network and functional analysis indicating the gene set that was enriched in the target networks of kinase LCK. Different colors of the network edge indicate the bioinformatics methods applied: co-expression, website prediction, co-localization, shared protein domains, physical interaction, pathway and genetic interactions. The different colors for the network nodes indicate the biological functions of the set of enrichment genes.
Immune infiltration of STAT5A in STAD
The above-mentioned results revealed that STAT5A plays an important role in immune-related functions and pathways. We next explored the role of STAT5A in the immune infiltration in STAD using the TIMER database. As expected, a strong association was found between the STAT5A level and the abundance of CD8+ T cells (cor=0.419, P=3.63e-17), CD4+ T cells (cor=0.35, P=5.41e-12), Macrophages (cor=0.354, P=2.39e-12), Neutrophils (cor=0.436, P=1.21e-18), and dendritic cells (cor=0.543, P=8.07e-30) (Figure 9). In immune biomarker analysis, we revealed a strong correlation between STAT5A and immune biomarkers in STAD (Table 3). Previous studies reported on these biomarkers of immune cells [19-21].
Figure 9.
The correlation between STAT5A and the abundance of infiltrating immune cell (TIMER). STAT5A was positively correlated with the abundance of CD8+ T cells, CD4+ T cells, Macrophage, Neutrphils and Dendritic cells.
For biomarkers of CD8+ T cells (CD8A and CD8B), T cells (CD3D, CD3E, and CD2), B cells (CD19 and CD79A), monocytes (CD86 and CD115), and tumor associated macrophages (TAM) (CCL2, CD68, and IL10), we revealed that their expression positively correlated with STAT5A expression in STAD. Expression of the biomarkers of M1 macrophages (INOS and IRF5) and M2 macrophages (CD163, VSIG4, and MS4A4A) showed strong correlations with the STAT5A level in STAD. Moreover, the level of CD11b and CCR7 (neutrophils) presented positive correlations with the STAT5A level in STAD. All markers of dendritic cells and most biomarkers of natural killer cells were significantly correlated with STAT5A expression. STAD patients with a high STAT5A level also presented with high levels of T-bet, STAT4, STAT1, IFN-γ, TNF-α, GATA3, STAT6, IL13, BCL6, and IL21. Moreover, the level of immune biomarkers of T reg cells (FOXP3, CCR8, STAT5B) and T cell exhaustion (PD-1, CTLA4, LAG3, TIM-3, GZMB) positively associated with the STAT5A level. Therefore, STAT5A may serve as an immune checkpoint inhibitor in the immunological therapy of STAD.
Discussion
The STAT gene family has been shown to regulate cytokine signaling, which affects basic cellular mechanisms, including cell invasion, proliferation, apoptosis, and cellular immunity [6,24]. The JAK/STAT signaling pathway was found to be associated with the genesis and progression of tumors, such as breast cancer, prostate cancer, and lung cancer [25-27]. To the best of our knowledge, the expression and the role of the STAT family in STAD had not yet been elucidated. Therefore, the current bioinformatics analysis was performed to evaluate the level, diagnostic and prognostic value, and functional regulation network of the STAT family in primary STAD.
Expression analysis showed that STAT1, STAT4, STAT5A, and STAT6 were upregulated in primary STAD compared with normal tissues at both the mRNA and protein level. Moreover, prognostic value analysis revealed that STAT, STAT4, STAT5A, and STAT6 may act as potential prognostic biomarkers in STAD. Moreover, diagnostic value analysis demonstrated that STAT1 and STAT5A may act as potential diagnostic biomarkers in STAD. In previous studies, it was suggested that some STAT family members may serve as biomarkers for various types of cancer. Data by Juliana et al. suggested that STAT1 functioned as both a prognostic and predictive biomarker in ovarian cancer [28]. In another study, it was indicated that STAT3, STAT4, STAT5A, STAT5B, and STAT6 functioned as a potential favorable prognostic biomarker in breast cancer [29].
We next performed genetic alteration, pathway, and drug sensitivity analysis of the STAT family in STAD. We found that STAT5B (33%), STAT1 (27%), and STAT5A (18%) were the top three frequently mutated genes, and the most common genetic alteration type was a missense mutation. These genetic alterations may associate with the pathogenesis and progress of STAD and affect the prognosis of STAD patients. These findings were consistent with the above-mentioned results, which suggested STAT1 and STAT5A may serve as potential diagnostic and prognostic markers in STAD. Cancer hallmarks demonstrated the involvement of STAT family in the activity of apoptosis, cell cycle, DNA damage response, EMT, hormone ER, and RAS/MAPK pathways. In previous studies, the associations between the STAT family and these pathways have also been reported. Interference of STAT5B expression could enhance the chemosensitivity of tumor cells to gefitinib by cell apoptosis in gastric cancer [30]. In another study, it was revealed that the JAK-STAT3 signaling pathway regulated by miR-340 affected cell proliferation, arrest the cell cycle, and apoptosis in gastric cancer [31]. Thus, dysregulation of the STAT family may affect the pathogenesis and progress of STAD via these pathways. Drug sensitivity analysis revealed that low expression of STAT5A and STAT5B were resistant to most drugs or small molecules of GDSC. Combined, these results indicated that STAT5A was a potential biomarker for the diagnosis, prognosis, and therapy target in STAD. Therefore, STAT5A was selected for further studies.
For identifying the role of STAT5A in STAD, enrichment analysis was performed. The data suggested that the functions and pathways of STAT5A in STAD were mainly associated with leukocyte activation and differentiation, immune responses, cell adhesion and chemotaxis, cytokine binding, chemokine signaling pathways, CAMs. Interestingly, these functions and pathways were involved in tumor progression and immune responses. In breast cancer, chemokine signaling promoted tumor cell survival and invasion in early-stage breast cancer [32]. CAMs acted as signaling receptors and transduced signals initiated by cellular interactions, which regulated many diverse processes, including cell division, migration, and differentiation [33]. These results further confirmed the significant role of STAT5A in STAD.
The above-mentioned results suggested that STAT5A was a potential biomarker for the diagnosis, prognosis, and therapy target in STAD, and that the functions of STAT5A were involved in tumor progress and immune responses. We further explored the correlation of STAT5A and immune cells and immune biomarkers. A strong association was found between the STAT5A level and the abundance of CD8+ T cells, CD4+ T cells, macrophages, neutrophils, and dendritic cells. We also revealed that the STAT5A level significantly associated with most immune biomarkers. In fact, these immune cells and biomarkers acted as immune checkpoint inhibitors and biomarkers, or were involved in the tumorigenesis and progression of various types of cancer, including STAD [34]. Data by Li et al. [35] showed that CD4+/CD8+ T cells functioned as prognostic biomarkers in gastric cancer, and affected tumor progression and patients’ survival. As immune checkpoints for gastric cancer, CTLA-4 and PD-1 play a significant role in cancer metastasis [36,37].
Our study has several limitations. Most analyses were performed at the mRNA level, and the analysis performed at the protein level may be preferred. Furthermore, validating our results via another independent cohort and basic research is warranted.
In conclusion, we aimed to identify the expression and diagnostic and prognostic biomarkers among the STAT family in STAD using data mining. Furthermore, genetic alteration, pathway and drug sensitivity analysis of the STAT family in STAD were performed, which may be of great clinical importance. STAT5A was selected for further study, and we explored the functions, transcription factor targets, kinase targets, and immune cell infiltration of STAT5A, which demonstrated that STAT5A serves as an immune checkpoint inhibitor and biomarker for the diagnosis and prognosis in STAD.
Disclosure of conflict of interest
None.
Supporting Information
References
- 1.Bray F, Ferlay J, Soerjomataram I, Siegel RL, Torre LA, Jemal A. Global cancer statistics 2018: GLOBOCAN estimates of incidence and mortality worldwide for 36 cancers in 185 countries. CA Cancer J Clin. 2018;68:394–424. doi: 10.3322/caac.21492. [DOI] [PubMed] [Google Scholar]
- 2.Eom BW, Jung KW, Won YJ, Yang H, Kim YW. Trends in gastric cancer incidence according to the clinicopathological characteristics in Korea, 1999-2014. Cancer Res Treat. 2018;50:1343–1350. doi: 10.4143/crt.2017.464. [DOI] [PMC free article] [PubMed] [Google Scholar]
- 3.Yoon H, Kim N. Diagnosis and management of high risk group for gastric cancer. Gut Liver. 2015;9:5–17. doi: 10.5009/gnl14118. [DOI] [PMC free article] [PubMed] [Google Scholar]
- 4.Digklia A, Wagner AD. Advanced gastric cancer: current treatment landscape and future perspectives. World J Gastroenterol. 2016;22:2403–2414. doi: 10.3748/wjg.v22.i8.2403. [DOI] [PMC free article] [PubMed] [Google Scholar]
- 5.Groner B, von Manstein V. Jak Stat signaling and cancer: opportunities, benefits and side effects of targeted inhibition. Mol Cell Endocrinol. 2017;451:1–14. doi: 10.1016/j.mce.2017.05.033. [DOI] [PubMed] [Google Scholar]
- 6.Pencik J, Pham HT, Schmoellerl J, Javaheri T, Schlederer M, Culig Z, Merkel O, Moriggl R, Grebien F, Kenner L. JAK-STAT signaling in cancer: from cytokines to non-coding genome. Cytokine. 2016;87:26–36. doi: 10.1016/j.cyto.2016.06.017. [DOI] [PMC free article] [PubMed] [Google Scholar]
- 7.Sato T, Neilson LM, Peck AR, Liu C, Tran TH, Witkiewicz A, Hyslop T, Nevalainen MT, Sauter G, Rui H. Signal transducer and activator of transcription-3 and breast cancer prognosis. Am J Cancer Res. 2011;1:347–355. [PMC free article] [PubMed] [Google Scholar]
- 8.Wu HT, Liu J, Li GW, Shen JX, Huang YT. The transcriptional STAT3 is a potential target, whereas transcriptional STAT5A/5B/6 are new biomarkers for prognosis in human breast carcinoma. Oncotarget. 2017;8:36279–36288. doi: 10.18632/oncotarget.16748. [DOI] [PMC free article] [PubMed] [Google Scholar]
- 9.Pastuszak-Lewandoska D, Domańska-Senderowska D, Kordiak J, Antczak A, Czarnecka KH, Migdalska-Sęk M, Nawrot E, Kiszałkiewicz JM, Brzeziańska-Lasota E. Immunoexpression analysis of selected JAK/STAT pathway molecules in patients with non- small-cell lung cancer. Pol Arch Intern Med. 2017;127:758–764. doi: 10.20452/pamw.4115. [DOI] [PubMed] [Google Scholar]
- 10.Mohanty SK, Yagiz K, Pradhan D, Luthringer DJ, Amin MB, Alkan S, Cinar B. STAT3 and STAT5A are potential therapeutic targets in castration-resistant prostate cancer. Oncotarget. 2017;8:85997–86010. doi: 10.18632/oncotarget.20844. [DOI] [PMC free article] [PubMed] [Google Scholar]
- 11.Rhodes DR, Kalyana-Sundaram S, Mahavisno V, Varambally R, Yu J, Briggs BB, Barrette TR, Anstet MJ, Kincead-Beal C, Kulkarni P, Varambally S, Ghosh D, Chinnaiyan AM. Oncomine 3.0: genes, pathways, and networks in a collection of 18,000 cancer gene expression profiles. Neoplasia. 2007;9:166–180. doi: 10.1593/neo.07112. [DOI] [PMC free article] [PubMed] [Google Scholar]
- 12.Chandrashekar DS, Bashel B, Balasubramanya SAH, Creighton CJ, Ponce-Rodriguez I, Chakravarthi BVSK, Varambally S. UALCAN: a portal for facilitating tumor subgroup gene expression and survival analyses. Neoplasia. 2017;19:649–658. doi: 10.1016/j.neo.2017.05.002. [DOI] [PMC free article] [PubMed] [Google Scholar]
- 13.Uhlen M, Oksvold P, Fagerberg L, Lundberg E, Jonasson K, Forsberg M, Zwahlen M, Kampf C, Wester K, Hober S, Wernerus H, Björling L, Ponten F. Towards a knowledge-based human protein atlas. Nat Biotechnol. 2010;28:1248–1250. doi: 10.1038/nbt1210-1248. [DOI] [PubMed] [Google Scholar]
- 14.Szász AM, Lánczky A, Nagy Á, Förster S, Hark K, Green JE, Boussioutas A, Busuttil R, Szabó A, Győrffy B. Cross-validation of survival associated biomarkers in gastric cancer using transcriptomic data of 1,065 patients. Oncotarget. 2016;7:49322–49333. doi: 10.18632/oncotarget.10337. [DOI] [PMC free article] [PubMed] [Google Scholar]
- 15.Liu CJ, Hu FF, Xia MX, Han L, Zhang Q, Guo AY. GSCALite: a web server for gene set cancer analysis. Bioinformatics. 2018;34:3771–3772. doi: 10.1093/bioinformatics/bty411. [DOI] [PubMed] [Google Scholar]
- 16.Vasaikar SV, Straub P, Wang J, Zhang B. LinkedOmics: analyzing multi-omics data within and across 32 cancer types. Nucleic Acids Res. 2017;46:D956–D963. doi: 10.1093/nar/gkx1090. [DOI] [PMC free article] [PubMed] [Google Scholar]
- 17.Warde-Farley D, Donaldson SL, Comes O, Zuberi K, Badrawi R, Chao P, Franz M, Grouios C, Kazi F, Lopes CT, Maitland A, Mostafavi S, Montojo J, Shao Q, Wright G, Bader GD, Morris Q. The GeneMANIA prediction server: biological network integration for gene prioritization and predicting gene function. Nucleic Acids Res. 2010;38:W214–W220. doi: 10.1093/nar/gkq537. [DOI] [PMC free article] [PubMed] [Google Scholar]
- 18.Li T, Fan J, Wang B, Traugh N, Chen Q, Liu JS, Li B, Liu XS. TIMER: a web server for comprehensive analysis of tumor-infiltrating immune cells. Cancer Res. 2017;77:e108–e110. doi: 10.1158/0008-5472.CAN-17-0307. [DOI] [PMC free article] [PubMed] [Google Scholar]
- 19.Siemers NO, Holloway JL, Chang H, Chasalow SD, Ross-MacDonald PB, Voliva CF, Szustakowski JD. Genome-wide association analysis identifies genetic correlates of immune infiltrates in solid tumors. PLoS One. 2017;12:e0179726. doi: 10.1371/journal.pone.0179726. [DOI] [PMC free article] [PubMed] [Google Scholar]
- 20.Danaher P, Warren S, Dennis L, D’Amico L, White A, Disis ML, Geller MA, Odunsi K, Beechem J, Fling SP. Gene expression markers of tumor infiltrating leukocytes. J Immunother Cancer. 2017;5:18. doi: 10.1186/s40425-017-0215-8. [DOI] [PMC free article] [PubMed] [Google Scholar]
- 21.Sousa S, Maatta J. The role of tumour-associated macrophages in bone metastasis. J Bone Oncol. 2016;5:135–138. doi: 10.1016/j.jbo.2016.03.004. [DOI] [PMC free article] [PubMed] [Google Scholar]
- 22.Chen X, Leung SY, Yuen ST, Chu KM, Ji J, Li R, Chan AS, Law S, Troyanskaya OG, Wong J, So S, Botstein D, Brown PO. Variation in gene expression patterns in human gastric cancers. Mol Biol Cell. 2003;14:3208–3215. doi: 10.1091/mbc.E02-12-0833. [DOI] [PMC free article] [PubMed] [Google Scholar]
- 23.D’Errico M, de Rinaldis E, Blasi MF, Viti V, Falchetti M, Calcagnile A, Sera F, Saieva C, Ottini L, Palli D, Palombo F, Giuliani A, Dogliotti E. Genome-wide expression profile of sporadic gastric cancers with microsatellite instability. Eur J Cancer. 2009;45:461–469. doi: 10.1016/j.ejca.2008.10.032. [DOI] [PubMed] [Google Scholar]
- 24.Waldmann TA, Chen J. Disorders of the JAK/STAT pathway in T cell lymphoma pathogenesis: implications for immunotherapy. Annu Rev Immunol. 2017;35:533–550. doi: 10.1146/annurev-immunol-110416-120628. [DOI] [PMC free article] [PubMed] [Google Scholar]
- 25.Groner B, von Manstein V. Jak Stat signaling and cancer: opportunities, benefits and side effects of targeted inhibition. Mol Cell Endocrinol. 2017;451:1–14. doi: 10.1016/j.mce.2017.05.033. [DOI] [PubMed] [Google Scholar]
- 26.O’Shea JJ, Holland SM, Staudt LM. JAKs and STATs in immunity, immunodeficiency, and cancer. N Engl J Med. 2013;368:161–170. doi: 10.1056/NEJMra1202117. [DOI] [PMC free article] [PubMed] [Google Scholar]
- 27.Trivedi S, Starz-Gaiano M. Drosophila Jak/STAT signaling: regulation and relevance in human cancer and metastasis. Int J Mol Sci. 2018;19:4056. doi: 10.3390/ijms19124056. [DOI] [PMC free article] [PubMed] [Google Scholar]
- 28.Josahkian JA, Saggioro FP, Vidotto T, Ventura HT, Candido Dos Reis FJ, de Sousa CB, Tiezzi DG, de Andrade JM, Koti M, Squire JA. Increased STAT1 expression in high grade serous ovarian cancer is associated with a better outcome. Int J Gynecol Cancer. 2018;28:459–465. doi: 10.1097/IGC.0000000000001193. [DOI] [PubMed] [Google Scholar]
- 29.Wang S, Yu L, Shi W, Li X, Yu L. Prognostic roles of signal transducers and activators of transcription family in human breast cancer. Biosci Rep. 2018;38:BSR20171175. doi: 10.1042/BSR20171175. [DOI] [PMC free article] [PubMed] [Google Scholar]
- 30.Sun T, Jia Y, Xiao D. Interference of STAT 5b expression enhances the chemo-sensitivity of gastric cancer cells to gefitinib by promoting mitochondrial pathway-mediated cell apoptosis. Oncol Rep. 2015;34:227–234. doi: 10.3892/or.2015.3994. [DOI] [PubMed] [Google Scholar]
- 31.Xiao C, Hong H, Yu H, Yuan J, Guo C, Cao H, Li W. MiR-340 affects gastric cancer cell proliferation, cycle, and apoptosis through regulating SOCS3/JAK-STAT signaling pathway. Immunopharmacol Immunotoxicol. 2018;40:278–283. doi: 10.1080/08923973.2018.1455208. [DOI] [PubMed] [Google Scholar]
- 32.Brummer G, Acevedo DS, Hu Q, Portsche M, Fang WB, Yao M, Zinda B, Myers M, Alvarez N, Fields P, Hong Y, Behbod F, Cheng N. Chemokine signaling facilitates early-stage breast cancer survival and invasion through fibroblast-dependent mechanisms. Mol Cancer Res. 2018;16:296–308. doi: 10.1158/1541-7786.MCR-17-0308. [DOI] [PMC free article] [PubMed] [Google Scholar]
- 33.Thomas GJ, Speight PM. Cell adhesion molecules and oral cancer. Crit Rev Oral Biol Med. 2001;12:479–498. doi: 10.1177/10454411010120060301. [DOI] [PubMed] [Google Scholar]
- 34.Zeng Q, Zhang W, Li X, Lai J, Li Z. Bioinformatic identification of renal cell carcinoma microenvironment-associated biomarkers with therapeutic and prognostic value. Life Sci. 2020;243:117273. doi: 10.1016/j.lfs.2020.117273. [DOI] [PubMed] [Google Scholar]
- 35.Li F, Sun Y, Huang J, Xu W, Liu J, Yuan Z. CD4/CD8+ T cells, DC subsets, Foxp3, and IDO expression are predictive indictors of gastric cancer prognosis. Cancer Med. 2019;8:7330–7344. doi: 10.1002/cam4.2596. [DOI] [PMC free article] [PubMed] [Google Scholar]
- 36.Winer A, Bodor JN, Borghaei H. Identifying and managing the adverse effects of immune checkpoint blockade. J Thorac Dis. 2018;10(Suppl 3):S480–S489. doi: 10.21037/jtd.2018.01.111. [DOI] [PMC free article] [PubMed] [Google Scholar]
- 37.Alsina M, Moehler M, Hierro C, Guardeño R, Tabernero J. Immunotherapy for gastric cancer: a focus on immune checkpoints. Target Oncol. 2016;11:469–477. doi: 10.1007/s11523-016-0421-1. [DOI] [PubMed] [Google Scholar]
Associated Data
This section collects any data citations, data availability statements, or supplementary materials included in this article.


