Abstract.
Significance: Photoacoustic imaging (PAI) has been greatly developed in a broad range of diagnostic applications. The efficiency of light to sound conversion in PAI is limited by the ubiquitous noise arising from the tissue background, leading to a low signal-to-noise ratio (SNR), and thus a poor quality of images. Frame averaging has been widely used to reduce the noise; however, it compromises the temporal resolution of PAI.
Aim: We propose an approach for photoacoustic (PA) signal denoising based on a combination of low-pass filtering and sparse coding (LPFSC).
Approach: LPFSC method is based on the fact that PA signal can be modeled as the sum of low frequency and sparse components, which allows for the reduction of noise levels using a hybrid alternating direction method of multipliers in an optimization process.
Results: LPFSC method was evaluated using in-silico and experimental phantoms. The results show a 26% improvement in the peak SNR of PA signal compared to the averaging method for in-silico data. On average, LPFSC method offers a 63% improvement in the image contrast-to-noise ratio and a 33% improvement in the structural similarity index compared to the averaging method for objects located at three different depths, ranging from 10 to 20 mm, in a porcine tissue phantom.
Conclusions: The proposed method is an effective tool for PA signal denoising, whereas it ultimately improves the quality of reconstructed images, especially at higher depths, without limiting the image acquisition speed.
Keywords: photoacoustic imaging, signal denoising, sparse coding, total variation, filtering, signal-to-noise ratio
1. Introduction
In the last two decades, photoacoustic imaging (PAI) as a non-invasive hybrid imaging modality has been used in a wide range of preclinical and clinical applications, such as functional brain mapping,1,2 molecular imaging,3,4 cancer diagnosis and staging,5–8 tissue vasculature imaging,9–12 guiding interventional procedures,13,14 and dental health.15,16 PAI detects the optical absorption contrast in tissue through the conversion of light to heat and thermoelastic effect, leading to the generation of acoustic waves.17–19 When the tissue is illuminated by short light pulses, the endogenous chromophores, such as hemoglobin, generate a photoacoustic (PA) signal due to their optical absorption.20,21 In this procedure, the light energy is transformed into acoustic waves, and the efficacy of this conversion is often affected by the presence of noise arising from the surrounding background.22,23 Therefore, the PA signal is often mixed by background noise, including thermal-acoustic noise in the medium as well as the transducer and electronic noises.24 White Gaussian noise is one of the most common models for these types of randomly distributed thermal and electronic noise.25 However, there is another component of noise arising from the light attenuation phenomena, caused by scattering characteristics of the tissue.26 Furthermore, other types of noise disturb the PA signals, such as the fixed-pattern noise caused by electromagnetic interference. The combination of these different types of noise in the PA signal leads to a low signal-to-noise ratio (SNR) and results in a poor quality reconstructed PA image.27–30
Several previously reported studies have attempted to improve the image reconstruction algorithms to achieve noise- and artifact-free PA images. However, acquiring high-quality PA images from noisy signals requires an effective denoising technique,31–36 prior to utilizing reconstruction algorithms. The most commonly used technique to reduce the noise level and improve the SNR of the PA signal is frame averaging, where the SNR improvement is proportional to the square root of the number of averaged frames.37 However, the signal averaging method needs to acquire multiple frames, which is time-consuming and affects the frame rate of PA imaging.29 Alternatively, the adaptive filtering method without any prior knowledge requirement was proposed for low-energy pulse laser diodes PA signal enhancement.28 They average fewer frames, in comparison with conventional averaging techniques, which leads to shorter acquisition time.28 Notwithstanding, the requirement of frames averaging in the latter method compromises the imaging speed.
Linear time-variant filtering techniques have been widely used to improve the SNR of the PA signal. Generally, these filtering techniques suffer from the inability of low-pass and bandpass filters when signal and noise share similar frequency spectrum.38 A commonly used PA signal denoising technique is the wavelet denoising method.39–43 Wavelet-based denoising methods face some challenges, such as choosing an appropriate basis function, the optimum number of wavelet decomposition levels, and especially choosing an optimum threshold value.28 While there are solutions for these drawbacks, these solutions are often complicated and computationally expensive.44,45 Furthermore, different denoising methods based on empirical mode decomposition (EMD)46 were proposed to improve the SNR of the signal. The EMDs decompose the PA signal into several intrinsic mode functions, which should be selected expertly and used for signal denoising. In this regard, the combination of the EMD method and mutual information (MI) was proposed to denoise PA signals.29 Although this method outperforms conventional wavelet and bandpass filtering methods in the term of SNR, it works based on an inaccurate assumption that high-frequency intrinsic mode functions contain considerable noise, and low-frequency intrinsic mode functions contain the majority of useful signals. Additionally, it is not an appropriate technique in the process of real-time PAI imaging, considering EMD and MI consumed time.
Since the size of the light absorber defines the spectrum content of the PA signals, these signals are usually broadband and cannot be considered as signals with specific frequency bands.47 On the other hand, the PA signal could be considered as a sparse signal with a sparse derivative. Therefore, one can model the PA signal as a sum of two components of low frequency and sparse.
In this study, for the first time, we proposed an approach for PA signals denoising based on a combination of low-pass filtering and total variation (TV) denoising, allowing for using a hybrid alternating direction method of multipliers (ADMM) in the optimization processes. Since the proposed method can be defined as a combination of low-pass filtering and sparse coding, we call it LPFSC.
The rest of this paper is organized as follows. Section 2 discusses the theory of TV denoising and ADMM methods, which are used in this paper. Section 3 describes the proposed denoising method, validation studies, and evaluation criteria. The experiments conducted to evaluate the performance of the proposed approach are described in Sec. 3, and the results are discussed in Sec. 4, followed by conclusions in Sec. 5.
2. Theoretical Background
2.1. Principles of Total Variation Denoising
Recently, the TV approach that promotes the sparsity of signals in the gradient domain has attracted significant attention in signal denoising applications.48 The goal of TV denoising technique is to efficiently estimate and recover the desired -point signal with the sparse or sparse-derivative representation from the measured noisy signal , which is defined as
| (1) |
where is considered as additive Gaussian noise with the variance of . TV denoising could be defined as the constrained minimization problem of a non-differentiable cost function in terms of the norm as below:
| (2) |
where as the first-order difference matrix is of size and is the first-order difference of an -point signal .49 With proper regularization parameter selection, Eq. (2) could be converted to the unconstraint problem as
| (3) |
In this optimization problem, the regularization parameter plays a significant role and controls the degree of smoothing, so that when the , there is no smoothing and the result is the same as minimizing the sum of squares. On the other hand, increasing assigns a higher weight to the second term of , which measures the oscillation of the desired signal and makes the solution piecewise. Although there are different algorithms to solve the TV denoising problem, majorization–minimization (MM) is found suitable to solve the optimization problem, which is hard to solve directly.50
2.2. Alternating Direction Method of Multipliers
ADMM is a simple but powerful algorithm to solve a convex optimization problem by breaking it into smaller subproblems.51,52 The ADMM algorithm is designed to solve the separable convex problems of the form:
| (4) |
where , , , and . The augmentation Lagrangian in Eq. (4) can be written as
| (5) |
where is the penalty parameter, which is considered positive, and is the Lagrangian multiplier. Equation (5) is solved using three steps: -minimization and -minimization, which are split into separate problems, and an updating step for multiplier as follows:
| (6) |
3. Method and Materials
3.1. Low-Pass Filtering and Sparse Coding
To solve the problem of PA signal denoising, the PA signal is modeled as the measured noisy signal , which is defined as
| (7) |
where the desired signal includes two main components, a low-frequency component and a sparse or a sparse-derivative component. Here, represents the low-frequency component of the desired signal, represents the sparse or the sparse-derivative components of the desired signal, and is considered as additive Gaussian noise with the variance of . Since we are looking for efficient estimation of and , considering Eq. (7), in the following of estimation, one can estimate as follows:
| (8) |
By replacing based on Eq. (7), Eq. (8) could be written as
| (9) |
where and are approximately equal. Therefore, Eq. (8) could be modified to
| (10) |
Considering the assumption that the frequency response of the low-pass filter is approximately zero-phase, we can conclude that
| (11) |
where high pass refers to the high-pass filter. To achieve a computationally efficient approach, a zero-phase non-causal recursive high-pass filter which is proposed in Ref. 49 was deployed in our method. Since the PA signal is sparse and has a sparse derivative, the cost function of the optimization problem contains a linear combination of two regularization parameters, which promote piecewise smooth and sparse solutions. Therefore, the denoising problem, shown in Eq. (3), can be expressed as the unconstraint minimization problem of a non-differentiable cost function in terms of norm as below:
| (12) |
There are many solutions, such as MM and ADMM, to solve Eq. (12). Since the denoising process and image reconstruction speed are vital to achieve real-time PA imaging, we proposed to use the hybrid consensus ADMM method53 to achieve a linear convergence and accelerating the conventional ADMM.
3.2. Validation Studies
3.2.1. In-silico study
A simulation study generated by the -wave toolbox in MATLAB® (Mathworks, Massachusetts) was performed to evaluate the performance of LPFSC in PA signal denoising.54 The initial pressure distribution is given by a image representative of a vascular structure. A 10-mm square grid was created, and the circular array detectors with 9-mm diameter and 60 elements, evenly spaced, were located around the region of interest (ROI) to receive the propagated PA wave from the object. We considered the center of each sensor as a point source. The sound speed was considered to be . The corresponding time array has 1019 data points that are 9.259 ns apart from each other (108-MHz sampling frequency). The input size of the PA signal was assigned , and the reconstructed images have .
3.2.2. Experimental PA data acquisition setup
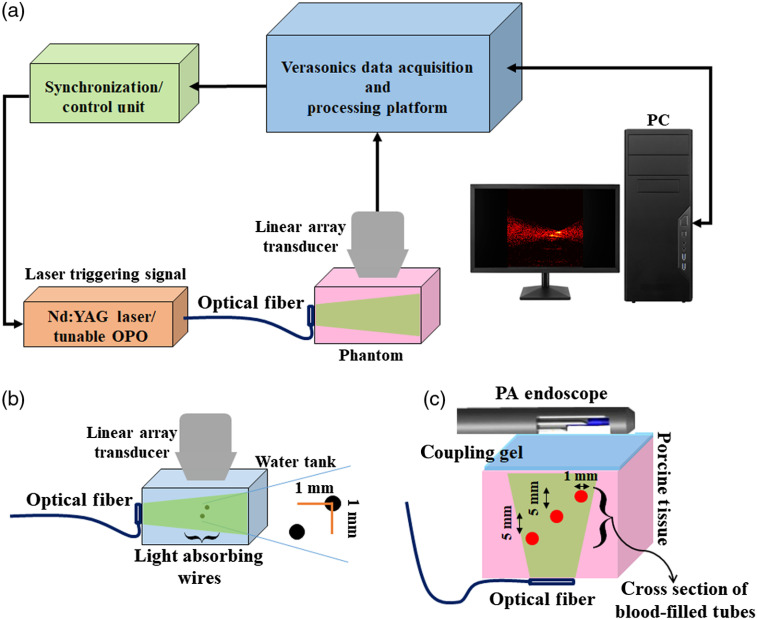
To further evaluation of the proposed PA signal denoising method and its effects on the quality of reconstructed PA images, phantom experiments were performed. The designed phantoms and the imaging setups are shown in Fig. 1. The first phantom contains two light-absorbing filaments with a diameter of that were placed 1 mm apart from each other inside a water tank [Fig. 2(b)]. An Nd: YAG/OPO nanosecond pulsed laser (Phocus core system, OPOTEK Inc., Carlsbad, California) with the pulse repetition rate of 10 Hz at wavelengths of 680 nm was used to illuminate the phantom. An ultrasound scanner (US) (Vantage 128TM, Verasonics Inc., Kirkland, Washington) with a 128 elements linear array transducer (L114v, Verasonics, Inc., Kirkland, Washington) was used to receive the propagated PA RF data [Fig. 1(a)].
Fig. 1.
Schematic of (a) the experimental setup used for the PA imaging of (b) two light-absorbing filaments that were placed inside a water tank and (c) cross-section view of blood-filled tubes embedded in a porcine tissue phantom.
Fig. 2.
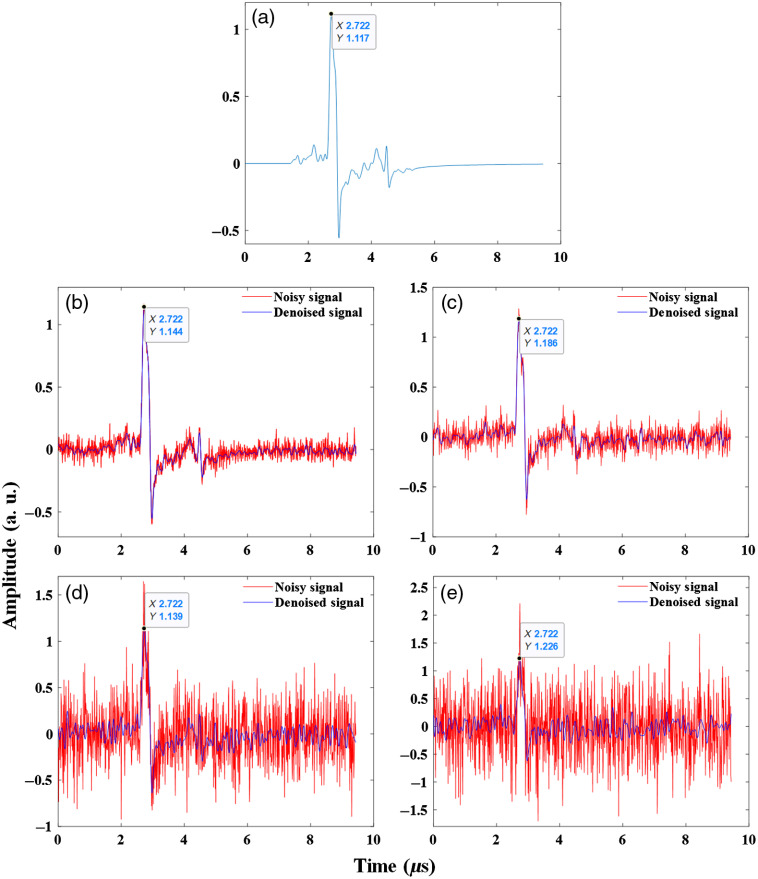
The denoising results of simulated PA signal in four different levels of noise. Noisy signals are shown in red and denoised signals are depicted in blue. (a) The original simulated PA signal detected on a detector #50, (b) SNR: 10 dB (c) SNR: 5 dB, (d) SNR: , and (e) SNR: . The horizontal and vertical axes indicate the time coordinate and amplitude of the recovered signal in different noise levels, respectively.
The second phantom contains three polytetrafluoroethylene tubes (1-mm diameter), filled with human blood and embedded within a 30-mm-thick porcine tissue background. Blood-filled tubes were placed inside the porcine tissue background at different depths from about 10 to 20 mm with 5-mm increments. PA acquisition was performed with the laser energy of at the wavelength of 680 nm. A fiber bundle with a diameter of 20 mm used for guiding the laser light to the tissue. A 64-element phased-array US endoscopic transducer, with an active aperture of 9-mm long, was coupled to the phantom to acquire acoustic signals and provide high-resolution sector images [Fig. 1(c)].
3.3. PA Signal Evaluation and Analysis
To evaluate the proposed approach, evaluation criteria such as peak signal-to-noise (PSNR) for signals, structural similarity index (SSIM), and contrast-to-noise ratio (CNR) for estimated images were used.
The PSNR as a common criterion to measure the quality of signal denoising based on the maximum possible value in the signal and mean square differences between denoised and reference signals is expressed in term of the logarithmic decibel scale (dB) as below:
where MSE is defined as a mean-square-error, and are original and denoised signals in size of , respectively, and is maximum possible value in signals.
We created PA images that represent an optical absorption distribution map of the targets via the conventional delay-and-sum (DAS) approach as the most commonly used reconstruction method in the PAI area.55 For reconstructed images, the SSIM (in a scale of 0 to 1) as one of the most common criteria for image quality assessment and for evaluating the similarity of images (i.e., reference image and reconstructed images) is defined56 as
where and are the mean of the original and estimated images, respectively, and also and are the variances of the original and estimated images, respectively. It is worth to mention that is the covariance between the original and estimated image. The values of and are considered as constant values to avoid instability when the sum square of means or variances are very close to zero.
Finally, the CNR is a common criterion to determine image quality, especially in denoising processes with below definition:
where and are the average intensity inside and outside of the objects, respectively. The represents the standard deviation of the background. The background was defined as the pixels located inside the green dashed rectangular region selected in each set of PA images. For phantom studies, we considered the average of all frames as a ground truth (reference image) in each experiment.
4. Results and Discussion
To assess the proposed PA signal denoising method, we validated our method on numerical vessel phantom and experimental data of phantoms. The simulated PA signal, which was generated by the -wave is shown in Fig. 2(a). Four different levels of additive Gaussian white noise with SNR levels 10, 5, , and were added to the original simulated clean PA signal, and results of the proposed denoising method for the simulated noisy signals are shown in Figs. 2(b)–2(e). When the noise level was increased (for example, in SNR level ), the PA signal peak was almost buried in added noise. As we have shown in Fig. 2, the LPFSC could suppress the noise and reconstruct the peak of the original signal, indicating the ability of the TV approach to recover the sparse or sparse-derivative signals. In the worst case (SNR level ), the difference between the original signal peak and the denoised signal peak is about 4%. This variance considering increasing the peak of noisy signal about 90% in comparison with the original signal is negligible. TV-based denoising is the most appropriate method for piecewise constant signals and preserves sharp edges in the underlying signal without requiring any step-size parameter as the amount of peak for the denoised signal.57 It is worth mentioning that the proposed method could recover denoised signal until the SNR decreased to .
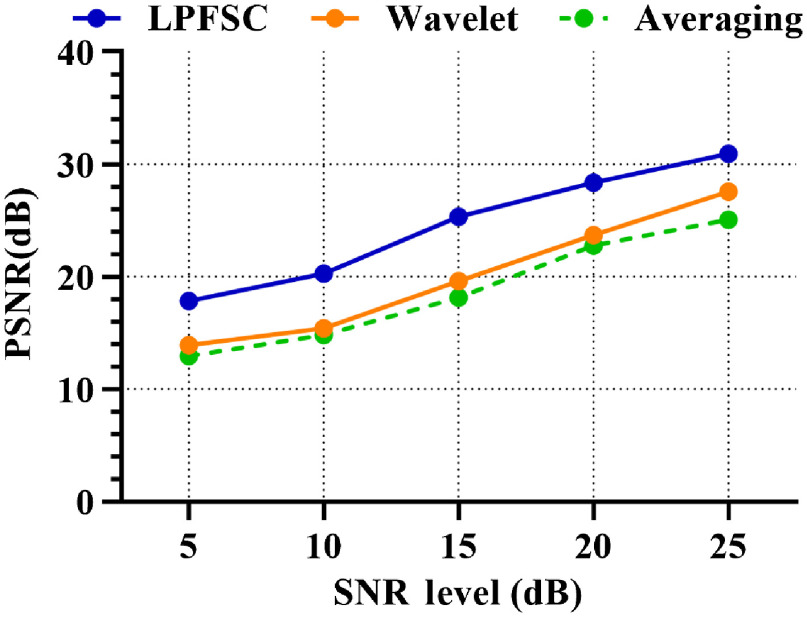
For further evaluation, the LPFSC signal denoising method was compared with two well-known and widely used approaches of averaging and wavelet-based denoising methods. As shown in Fig. 3, the PSNR of the LPFSC method was compared to the frame averaging (using 20 frames) and wavelet-based denoising methods, at different noise levels. For PA signal denoising by wavelet method, a commonly used Symlet 6 wavelet with six-level of decomposition and Stein’s Unbiased Risk Estimation threshold (SURE threshold) were selected.29
Fig. 3.
Comparison of three different denoising methods: wavelet-based signal denoising, the averaging method using 20 frames, and LPFSC in terms of PSNR improvements at five different noise levels. The results clearly demonstrate the superior performance of LPFSC compared to wavelet and averaging.
The quantitative results obtained with the simulations show that the LPFSC compensates the low SNR of PA signal and outperforms the competing wavelet and averaging denoising methods in terms of PSNR by 24% and 26%, respectively, across all simulated noise levels.
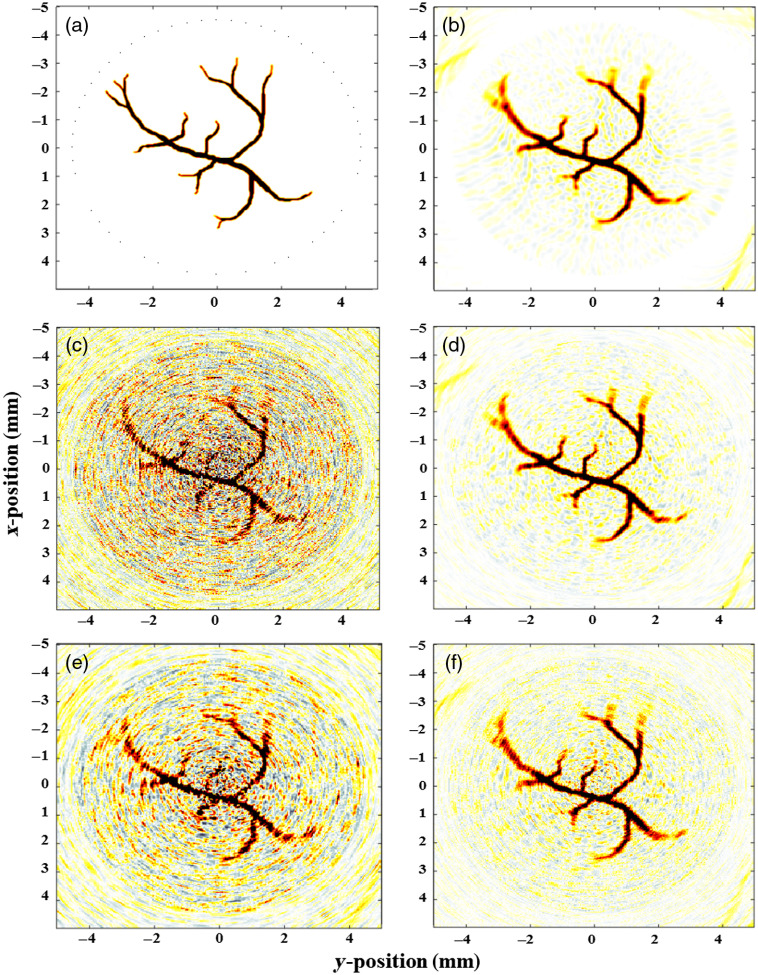
The reconstructed images of denoised simulated PA signals with considering SNR of for three methods of averaging, wavelet-based denoising, and LPFSC are shown in Fig. 4. The wavelet method has not been successful in recovering the small size vessels, which are corrupted by the noise. In addition, the averaging method using 20 frames cannot fully clean the signal due to presences of the coherent noise; however, our method using one frame could fully recover the original image and its details.
Fig. 4.
(a) Illustration of the phantom used for in-silico studies. Reconstructed images of: (b) simulated PA phantom, (c) noisy image when SNR is considered , (d) PA image using the LPFSC denoising, (e) PA image using the wavelet denoised, and (f) PA image using the averaging of 20 frames for noise reduction.
For the quantitative evaluation of the reconstructed images of denoised simulated PA signals, two SSIM and CNR criteria were used. Comparison between the results of three different methods, including wavelet-based signal denoising, averaging, and LPFSC in terms of SSIM and CNR with different levels of noise are shown in Table 1. On average (for different noise levels), the proposed denoising approach offers better CNR up to about 28% and 30%, and higher SSIM of about 23% and 24% in comparison with averaging and wavelet denoising methods, respectively. With increasing SNR levels from 5 to 20 dB and the reduction of noise level, the performance of all methods are improved. Although, for the lower SNR such as 5 dB, LPFSC outperforms wavelet and averaging denoising method by improvement about 58% and in terms of SSIM.
Table 1.
Performance of three different signal denoising methods: wavelet-based, averaging method, and LPFSC across different levels of noise.
| Level of SNR (dB) | Wavelet | Averaging | LPFSC | |||
|---|---|---|---|---|---|---|
| SSIM | CNR (dB) | SSIM | CNR (dB) | SSIM | CNR (dB) | |
| 5 | 0.59 | 65.01 | 0.58 | 67.23 | 0.93 | 87.61 |
| 10 | 0.78 | 72.53 | 0.79 | 72.98 | 0.95 | 94.53 |
| 15 | 0.86 | 75.15 | 0.87 | 76.23 | 0.98 | 96.70 |
| 20 | 0.86 | 76.66 | 0.91 | 77.12 | 0.99 | 98.21 |
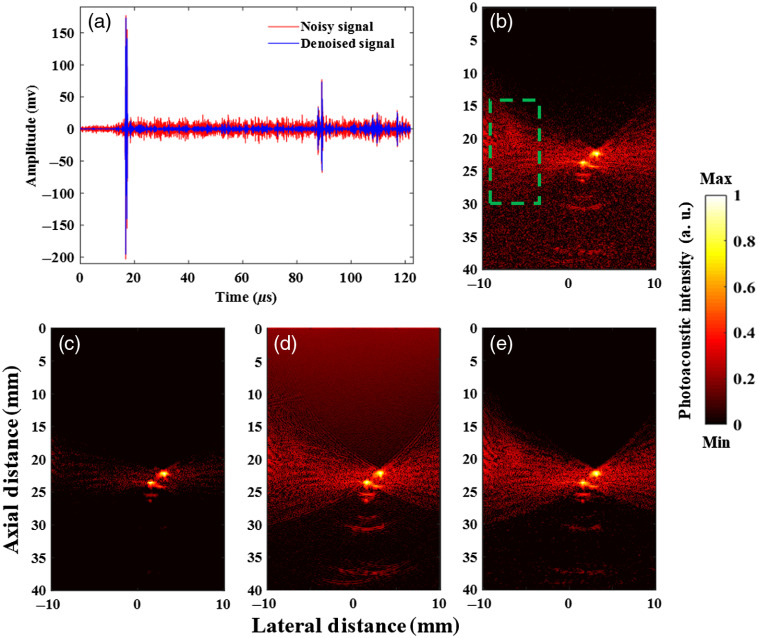
During experimental studies, we evaluated our method in a set of phantom studies in which two small-sized absorbers were placed inside a water tank, illuminated from the side and images from the top using a US transducer operating at frequencies between 4 and 11 MHz. The PA signal denoising results for the acquired signals of different detectors from the 20th frames of phantom data are shown in Fig. 5. The experimental results of PA signal denoising show significant improvement for the PSNR of PA signal of wires phantom about 35% by recovering peaks of original signal and reduction of noise.
Fig. 5.
(a) The PA signal denoising of experimental phantom via LPFSC and (b) the original reconstructed image of one frame. The reconstructed images of phantom via three different signal denoising methods: (c) the LPFSC method (one frame), (d) the wavelet denoising method (one frame), and (e) the averaging all 20 frames. The background was defined as the pixels located inside the green dashed rectangular region.
Additionally, reconstructed images of denoised PA signals through three different methods are shown in Fig. 5 and are compared in Table 2, in terms of SSIM, CNR, axial and lateral full width half maximum (FWHM) for experimental phantom data. The selection of FWHM is to demonstrate the geometrical accuracy of reconstructed PA images. The experimental results of PA signal denoising prove that the LPFSC beats the performance of averaging denoising method (using all 20 frames) as the reference in the term of SSIM and CNR criteria by the 17% and 38%. The LPFSC method provides a closer to real size reconstructed PA image with a mean of axial FWHM of and lateral FWHM of , for two objects in experimental data. In comparison with the reconstructed image of one frame without any signal denoising with axial FWHM of and lateral FWHM of , our method could preserve lateral FWHM and improve axial FWHM about 10%. Whereas the wavelet denoising method did not improve the lateral and axial FWHM, and the averaging method was not effective for axial FWHM. It is worth to mention that both of these methods improve CNR of the reconstructed image in comparison with the reconstructed image of one frame with CNR 19.32 dB. Therefore, one of the main improvements gained by the proposed LPFSC method is having reduced geometrical distortion as well as a high contrast at the same time. More importantly, the LPFSC method offers using one frame in comparison with the averaging method, which requires 20 frames. Using the hybrid ADMM, which stands out as efficient and easily implementable, leads to fast convergence of our method.
Table 2.
Comparison of three methods of wavelet, averaging, and LPFSC method in terms of SSIM, CNR, and lateral and axial FWHM for the reconstructed image of the denoised signal.
| Criteria | Wavelet | Averaging | LPFSC |
|---|---|---|---|
| SSIM | 0.79 | 0.81 | 0.95 |
| CNR (dB) | 23.72 | 25.36 | 35.17 |
| Lateral FWHM (mm) (mean + std) | |||
| Axial FWHM (mm) (mean + std) |
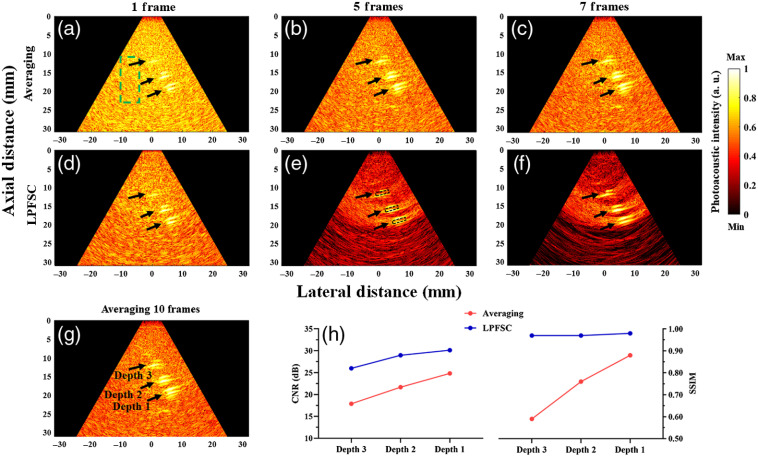
Finally, we evaluated the performance of the proposed denoising method with data acquired by an endoscopic probe and from the porcine tissue phantom. Since there was no significant difference between the results of frame averaging and wavelet method in in-silico study, the reconstructed PA images of denoised signal with frame averaging and LPFSC methods are compared in Fig. 6. The images form by averaging of 10 frames were used as a ground truth or the reference image. All constructed images from denoised signal using LPFSC and traditional frame averaging with the same number of frames ( to 7) were compared to the ground-truth reference to calculate the SSIM. The number of averaged frames varied between one and seven. First and second rows related to the results of the averaging method and our proposed method, respectively. The walls of blood-filled tubes are generating strong PA signals that are visually presented as two parallel bright lines in PA images. To calculate CNR, an ROI located within the tube [as shown in Fig. 6(e)] was used to measure the signal from the target. To further quantify the image enhancements, CNR and SSIM of frame averaging and LPFSC using five frames are compared in Fig. 6(h). The use of five frames averaging in conjunction with LPFSC markedly reduced the background noise, which improved the mean of CNR and SSIM by 32% and 31%, respectively.
Fig. 6.
Reconstructed PA images of denoised signals of a porcine/blood inclusion phantom. (a)–(c) Frame averaging with 1, 5, and 7 averaged frames, respectively. (d)–(f) LPFSC with 1, 5, and 7 averaged frames, respectively. (g) Averaging 10 frames used as a reference. (h) The comparison of CNR and SSIM of two methods using five frames for inclusions located at different depths. The black arrows indicate objects located at depths 1, 2, and 3. Depths 1, 2, and 3 are about 20, 15, and 10 mm, respectively. The background was defined as the pixels located inside the green dashed rectangular region. The ROI for the target (object) is indicated with black dashed rectangular boxes in (e).
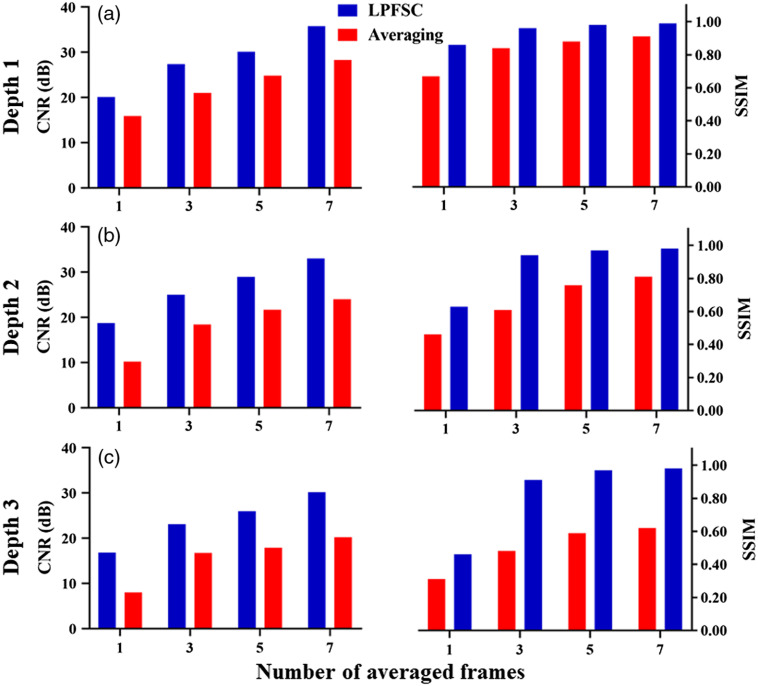
Evaluation of CNR and SSIM for different numbers of averaged frames and at different imaging depths are shown in Fig. 7. As anticipated, CNR and SSIM parameters are improved with increasing the number of averaged frames. However, the proposed denoising method provides higher CNR and SSIM using the same number of averaged frames for objects placed at different depths. The mean of CNR using LPFSC with one frame was improved 63% in comparison with averaging for the objects evaluated at three different depths. A closer look at the results reveal that the mean CNR using the proposed denoising method using three averaged frames is higher than averaging only and using seven averaged frames. This comparison clearly shows the potential of using the proposed method to enhance the quality of PA images with a smaller number of averaged frames, which can lead to a preserving image quality at higher imaging speed. Our results indicated the LPFSC with three frames averaging is capable of detecting the objects located at depth 3 with SSIM of 0.91, which shows 90% improvement compared to the standard averaging method. The average measured SSIM for objects located at three different depths was calculated as when LPFSC is utilized. This result indicates 33% improvement compared to averaging alone.
Fig. 7.
Porcine tissue results: comparison between the LPFSC with averaging using different number of averaged frames ranging from 1 to 7 in terms of CNR and SSIM: (a) depth 1, (b) depth 2, and (c) depth 3. CNR and SSIM parameters are evaluated and the results indicate the superior performance of LPFSC compared to averaging only.
In this study, a range of cutoff frequencies was experimentally tested on data sets. The accepted range of cutoff frequencies was concluded to be between 0 and for different data sets, experimentally. For in-silico and first experimental phantom studies, the optimal value of cutoff frequency was selected and for porcine tissue data, it was selected . Also, we consider equal weight for the TV and LPF; therefore, the lambda value was selected equal to be 1, experimentally. Changing lambda within the range of 0.8 to 1.2 showed acceptable results for PA signal denoising. For lambda smaller than 0.8, the amplitude of denoised signal is decreased compared to the original signal. The lambda bigger than 1.2 downgraded the performance of LPFSC. The performance of LPFSC could also be affected by the adjustment of low-pass filter cutoff frequency. However, small deviations from the ideal cutoff frequency up to 20% could be compensated by the sparse denoising part of the proposed algorithm.
5. Conclusion
The efficiency of PA imaging is routinely limited by the presence of background noise and suffering from low SNR, which resulted in the poor quality of the reconstructed images. Since the PA signals can be modeled as a sum of two low frequency and sparse components, we proposed a denoising approach that simultaneously estimates a low-pass and a sparse signal from an acquired noisy signal based on TV optimization approach, and using hybrid ADMM. Both in-silico and experimental work on tissue mimics were used to evaluate the performance of the proposed technique. The results demonstrated that the LPFSC method possess a superior performance to compensate the low SNR PA signals and offered a better CNR and SSIM for the reconstructed images compared to the frame averaging method. This comparison clearly shows the potential of using our proposed method to enhance the quality of PA images while maintaining high-speed imaging which is an essential need in many applications of PA imaging. In other words, the frame rate of PA images, which is always a challenge in real-time PA imaging can be significantly improved.
Biographies
Ebrahim Najafzadeh received his PhD in medical physics from Tehran University of Medical Science (TUMS), Tehran, Iran, in 2020. He has completed his undergraduate and graduate program on radiology and medical physics at Iran University of Medical Science and TUMS, respectively. His research interests are photoacoustic, ultrasound and optical imaging, and signal and image processing. His current research focuses on design of preclinical and clinical applications for LED-based photoacoustic imaging.
Parastoo Farnia received her MSc and PhD degrees in biomedical engineering from Tehran University of Medical Science, Iran, in 2013 and 2020. Her research is focused on multimodal registration like ultrasound-MRI and photoacoustic-MRI. Her research interests include multimodal image registration, sparse representation, ultrasound, and photoacoustic imaging.
Saeedeh N. Lavasani received her BA degree in biomedical engineering from the Islamic Azad University in 2011 and an MSc degree in biomedical engineering from Tehran University of Medical Science in 2014. She completed her PhD in biomedical engineering at Shahid Beheshti University of Medical Science in 2020. Her research interests include image registration, image segmentation, and photoacoustic imaging.
Maryam Basij received her BS and MS degrees in biomedical engineering from Isfahan University, Iran in 2008 and 2012, respectively. Currently, she is pursuing her PhD program in biomedical engineering with Functional and Molecular Ultrasound Research Laboratory, Wayne State University, Michigan, USA, focusing on the development of combined medical imaging technologies for advanced screening, diagnostics, and therapeutics. Besides, she worked on various biomedical images such as IVUS, breast MRI, karyotype images, nanotechnology images, etc.
Yan Yan is a PhD student at Wayne State University. His areas of interest are medical imaging, object detection, and data mining. He had strong background in computer science pattern recognition and computer graphics. He holds a bachelor’s degree from Chongqing University in computer science and telecommunication.
Hossein Ghadiri received his PhD in medical physics from Iran University of Medical Sciences, Tehran, Iran, in 2014. Since then, he had been a faculty member of medical physics and biomedical engineering at Tehran University of Medical Sciences. He is the head of Advanced X-ray Imaging Systems Lab (AXIS) with main research areas including advanced x-ray and micro-CT image analysis.
Alireza Ahmadian is a professor at Tehran University of Medical Sciences, Department of Biomedical Systems & Biophysics. He received his PhD in biomedical image processing from Imperial College, London, followed by a postdoctoral position at Kings College London. Currently, he is the head of school of advanced technologies in medicine and also the Research Center for Biomedical Technologies and Robotics. He is the founder of the knowledge based company, Parsiss, working in image-guided surgery systems.
Mohammad Mehrmohammadi is an associate professor of biomedical/electrical and computer engineering/obstetrics and gynecology at Wayne State University (Michigan, USA). He received his PhD in biomedical engineering from the University of Texas at Austin. Prior to joining WSU, Mohammad worked at Mayo Clinic College of Medicine as a senior research fellow. His research interests include medical ultrasound, photoacoustic imaging, nanobiotechnology, and tissue elastography for various applications including early cancer detection and enhancing maternal, and fetal care.
Disclosures
The authors declare that they have no conflicts of interest.
Contributor Information
Ebrahim Najafzadeh, Email: ebrahim.najafzadeh@gmail.com.
Parastoo Farnia, Email: parastoo.farnia@gmail.com.
Saeedeh N. Lavasani, Email: saeedeh.lavasany@gmail.com.
Maryam Basij, Email: n_basij@wayne.edu.
Yan Yan, Email: yyan2@wayne.edu.
Hossein Ghadiri, Email: h-ghadiri@tums.ac.ir.
Alireza Ahmadian, Email: ahmadian@sina.tums.ac.ir.
Mohammad Mehrmohammadi, Email: mehr@wayne.edu.
References
- 1.Wang X., et al. , “Noninvasive laser-induced photoacoustic tomography for structural and functional in vivo imaging of the brain,” Nat. Biotechnol. 21(7), 803 (2003). 10.1038/nbt839 [DOI] [PubMed] [Google Scholar]
- 2.Nasiriavanaki M., et al. , “High-resolution photoacoustic tomography of resting-state functional connectivity in the mouse brain,” Proc. Natl. Acad. Sci. U. S. A. 111(1), 21–26 (2014). 10.1073/pnas.1311868111 [DOI] [PMC free article] [PubMed] [Google Scholar]
- 3.Kim J.-W., et al. , “Golden carbon nanotubes as multimodal photoacoustic and photothermal high-contrast molecular agents,” Nat. Nanotechnol. 4(10), 688 (2009). 10.1038/nnano.2009.231 [DOI] [PMC free article] [PubMed] [Google Scholar]
- 4.De La Zerda A., et al. , “Carbon nanotubes as photoacoustic molecular imaging agents in living mice,” Nat. Nanotechnol. 3(9), 557 (2008). 10.1038/nnano.2008.231 [DOI] [PMC free article] [PubMed] [Google Scholar]
- 5.Basij M., et al. , “Miniaturized phased-array ultrasound and photoacoustic endoscopic imaging system,” Photoacoustics 15, 100139 (2019). 10.1016/j.pacs.2019.100139 [DOI] [PMC free article] [PubMed] [Google Scholar]
- 6.Alshahrani S. S., et al. , “All-reflective ring illumination system for photoacoustic tomography,” J. Biomed. Opt. 24(4), 046004 (2019). 10.1117/1.JBO.24.4.046004 [DOI] [PMC free article] [PubMed] [Google Scholar]
- 7.Mehrmohammadi M., et al. , “Photoacoustic imaging for cancer detection and staging,” Curr. Mol. Imaging 2(1), 89–105 (2013). 10.2174/2211555211302010010 [DOI] [PMC free article] [PubMed] [Google Scholar]
- 8.Basij M., et al. , “Development of an ultrasound and photoacoustic endoscopy system for imaging of gynecological disorders,” in IEEE Int. Ultrasonics Symp., pp. 1–4 (2018). [Google Scholar]
- 9.Najafzadeh E., et al. , “Application of multi-wavelength technique for photoacoustic imaging to delineate tumor margins during maximum-safe resection of glioma: a preliminary simulation study,” J. Clin. Neurosci. 70, 242–246 (2019). 10.1016/j.jocn.2019.08.040 [DOI] [PubMed] [Google Scholar]
- 10.Laufer J. G., et al. , “In vivo preclinical photoacoustic imaging of tumor vasculature development and therapy,” J. Biomed. Opt. 17(5), 056016 (2012). 10.1117/1.JBO.17.5.056016 [DOI] [PubMed] [Google Scholar]
- 11.Kempski K. M., et al. , “In vivo photoacoustic imaging of major blood vessels in the pancreas and liver during surgery,” J. Biomed. Opt. 24(12), 121901 (2019). 10.1117/1.JBO.24.12.121905 [DOI] [PMC free article] [PubMed] [Google Scholar]
- 12.Najafzadeh E., et al. , “Evaluation of multi-wavelengths LED-based photoacoustic imaging for maximum safe resection of glioma: a proof of concept study,” Int. J. Comput. Assist. Radiol. Surg. 15, 1053–1062 (2020). 10.1007/s11548-020-02191-2 [DOI] [PubMed] [Google Scholar]
- 13.Yan Y., et al. , “Photoacoustic imaging for image-guided endovenous laser ablation procedures,” Sci. Rep. 9(1), 1–10 (2019). 10.1038/s41598-018-37588-2 [DOI] [PMC free article] [PubMed] [Google Scholar]
- 14.Kim C., et al. , “Handheld array-based photoacoustic probe for guiding needle biopsy of sentinel lymph nodes,” J. Biomed. Opt. 15(4), 046010 (2010). 10.1117/1.3469829 [DOI] [PMC free article] [PubMed] [Google Scholar]
- 15.Arabpou S., et al. , “Detection of early stages dental caries using photoacoustic signals: the simulation study,” Front. Biomed. Technol. 6, 35–40 (2019). 10.18502/fbt.v6i1.1101 [DOI] [Google Scholar]
- 16.Moore C., et al. , “Photoacoustic imaging for monitoring periodontal health: a first human study,” Photoacoustics 12, 67–74 (2018). 10.1016/j.pacs.2018.10.005 [DOI] [PMC free article] [PubMed] [Google Scholar]
- 17.Wang L. V., Hu S., “Photoacoustic tomography: in vivo imaging from organelles to organs,” Science 335(6075), 1458–1462 (2012). 10.1126/science.1216210 [DOI] [PMC free article] [PubMed] [Google Scholar]
- 18.Beard P., “Biomedical photoacoustic imaging,” Interface Focus 1(4), 602–631 (2011). 10.1098/rsfs.2011.0028 [DOI] [PMC free article] [PubMed] [Google Scholar]
- 19.Wang L. V., Yao J., “A practical guide to photoacoustic tomography in the life sciences,” Nat. Methods 13(8), 627 (2016). 10.1038/nmeth.3925 [DOI] [PMC free article] [PubMed] [Google Scholar]
- 20.Wang L. V., Gao L., “Photoacoustic microscopy and computed tomography: from bench to bedside,” Annu. Rev. Biomed. Eng. 16, 155–185 (2014). 10.1146/annurev-bioeng-071813-104553 [DOI] [PMC free article] [PubMed] [Google Scholar]
- 21.Xu M., Wang L. V., “Photoacoustic imaging in biomedicine,” Rev. Sci. Instrum. 77(4), 041101 (2006). 10.1063/1.2195024 [DOI] [Google Scholar]
- 22.Wang L. V., “Tutorial on photoacoustic microscopy and computed tomography,” IEEE J. Sel. Top. Quantum Electron. 14(1), 171–179 (2008). 10.1109/JSTQE.2007.913398 [DOI] [Google Scholar]
- 23.Winkler A. M., Maslov K. I., Wang L. V., “Noise-equivalent sensitivity of photoacoustics,” J. Biomed. Opt. 18(9), 097003 (2013). 10.1117/1.JBO.18.9.097003 [DOI] [PMC free article] [PubMed] [Google Scholar]
- 24.Yao J., Wang L. V., “Sensitivity of photoacoustic microscopy,” Photoacoustics 2(2), 87–101 (2014). 10.1016/j.pacs.2014.04.002 [DOI] [PMC free article] [PubMed] [Google Scholar]
- 25.Stephanian B., et al. , “Additive noise models for photoacoustic spatial coherence theory,” Biomed. Opt. Express 9(11), 5566–5582 (2018). 10.1364/BOE.9.005566 [DOI] [PMC free article] [PubMed] [Google Scholar]
- 26.Mahmoodkalayeh S., et al. , “Low temperature-mediated enhancement of photoacoustic imaging depth,” Sci. Rep. 8(1), 4873 (2018). 10.1038/s41598-018-22898-2 [DOI] [PMC free article] [PubMed] [Google Scholar]
- 27.Telenkov S., Mandelis A., “Signal-to-noise analysis of biomedical photoacoustic measurements in time and frequency domains,” Rev. Sci. Instrum. 81(12), 124901 (2010). 10.1063/1.3505113 [DOI] [PubMed] [Google Scholar]
- 28.Manwar R., et al. , “Photoacoustic signal enhancement: towards utilization of low energy laser diodes in real-time photoacoustic imaging,” Sensors 18(10), 3498 (2018). 10.3390/s18103498 [DOI] [PMC free article] [PubMed] [Google Scholar]
- 29.Zhou M., et al. , “A noise reduction method for photoacoustic imaging in vivo based on EMD and conditional mutual information,” IEEE Photonics J. 11(1), 1–10 (2019). 10.1109/JPHOT.2019.2897748 [DOI] [Google Scholar]
- 30.Farnia P., et al. , “Dictionary learning technique enhances signal in LED-based photoacoustic imaging,” Biomed. Opt. Express 11(5), 2533–2547 (2020). 10.1364/BOE.387364 [DOI] [PMC free article] [PubMed] [Google Scholar]
- 31.Erfanzadeh M., Zhu Q., “Photoacoustic imaging with low-cost sources; a review,” Photoacoustics 14, 1–11 (2019). 10.1016/j.pacs.2019.01.004 [DOI] [PMC free article] [PubMed] [Google Scholar]
- 32.Huang C., et al. , “Full-wave iterative image reconstruction in photoacoustic tomography with acoustically inhomogeneous media,” IEEE Trans. Med. Imaging 32(6), 1097–1110 (2013). 10.1109/TMI.2013.2254496 [DOI] [PMC free article] [PubMed] [Google Scholar]
- 33.Antholzer S., Haltmeier M., Schwab J., “Deep learning for photoacoustic tomography from sparse data,” Inverse Prob. Sci. Eng. 27(7), 987–1005 (2019). 10.1080/17415977.2018.1518444 [DOI] [PMC free article] [PubMed] [Google Scholar]
- 34.Davoudi N., Deán-Ben X. L., Razansky D., “Deep learning optoacoustic tomography with sparse data,” Nat. Mach. Intell. 1, 453–460 (2019). 10.1038/s42256-019-0095-3 [DOI] [Google Scholar]
- 35.Anas E. M. A., et al. , “Enabling fast and high quality LED photoacoustic imaging: a recurrent neural networks based approach,” Biomed. Opt. Express 9(8), 3852–3866 (2018). 10.1364/BOE.9.003852 [DOI] [PMC free article] [PubMed] [Google Scholar]
- 36.Farnia P., et al. , “High-quality photoacoustic image reconstruction based on deep convolutional neural network: towards intra-operative photoacoustic imaging,” Biomed. Phys. Eng. Express 6, 1–10 (2020). 10.1088/2057-1976/ab9a10 [DOI] [PubMed] [Google Scholar]
- 37.Li J., et al. , “A review of signal enhancement and noise reduction techniques for tunable diode laser absorption spectroscopy,” Appl. Spectrosc. Rev. 49(8), 666–691 (2014). 10.1080/05704928.2014.903376 [DOI] [Google Scholar]
- 38.Sun J., et al. , “Photoacoustic wavefront shaping with high signal to noise ratio for light focusing through scattering media,” Sci. Rep. 9(1), 1–10 (2019). 10.1038/s41598-019-40919-6 [DOI] [PMC free article] [PubMed] [Google Scholar]
- 39.Holan S. H., Viator J. A., “Automated wavelet denoising of photoacoustic signals for circulating melanoma cell detection and burn image reconstruction,” Phys. Med. Biol. 53(12), N227 (2008). 10.1088/0031-9155/53/12/N01 [DOI] [PubMed] [Google Scholar]
- 40.Holan S. H., Viator J. A., “Automated wavelet denoising of photoacoustic signals for burn-depth image reconstruction,” Proc. SPIE 6437, 643719 (2007). 10.1117/12.701228 [DOI] [PubMed] [Google Scholar]
- 41.Zhou M., et al. , “Wavelet de-noising method with adaptive threshold selection for photoacoustic tomography,” in 40th Annu. Int. Conf. IEEE Eng. Med. and Biol. Soc., pp. 4796–4799 (2018). [DOI] [PubMed] [Google Scholar]
- 42.Tzoumas S., et al. , “Spatiospectral denoising framework for multispectral optoacoustic imaging based on sparse signal representation,” Med. Phys. 41(11), 113301 (2014). 10.1118/1.4893530 [DOI] [PubMed] [Google Scholar]
- 43.Najafzadeh E., et al. , “Development of an algorithm for reducing scatter distribution in fluorescence reflectance images using Wiener filter in wavelet domain,” in World Congr. Med. Phys. and Biomed. Eng., Munich, pp. 1869–1872 (2009). [Google Scholar]
- 44.Smith C. B., Agaian S., Akopian D., “A wavelet-denoising approach using polynomial threshold operators,” IEEE Signal Process. Lett. 15, 906–909 (2008). 10.1109/LSP.2008.2001815 [DOI] [Google Scholar]
- 45.Xu J., et al. , “Adaptive wavelet threshold denoising method for machinery sound based on improved fruit fly optimization algorithm,” Appl. Sci. 6(7), 199 (2016). 10.3390/app6070199 [DOI] [Google Scholar]
- 46.Lei Y., et al. , “A review on empirical mode decomposition in fault diagnosis of rotating machinery,” Mech. Syst. Signal Process. 35(1–2), 108–126 (2013). 10.1016/j.ymssp.2012.09.015 [DOI] [Google Scholar]
- 47.Li C., Wang L. V., “Photoacoustic tomography and sensing in biomedicine,” Phys. Med. Biol. 54(19), R59 (2009). 10.1088/0031-9155/54/19/R01 [DOI] [PMC free article] [PubMed] [Google Scholar]
- 48.Vujović S., et al. , “Sparse analyzer tool for biomedical signals,” Sensors 20(9), 2602 (2020). 10.3390/s20092602 [DOI] [PMC free article] [PubMed] [Google Scholar]
- 49.Selesnick I. W., et al. , “Simultaneous low-pass filtering and total variation denoising,” IEEE Trans. Signal Process. 62(5), 1109–1124 (2014). 10.1109/TSP.2014.2298836 [DOI] [Google Scholar]
- 50.Figueiredo M. A., Bioucas-Dias J. M., Nowak R. D., “Majorization–minimization algorithms for wavelet-based image restoration,” IEEE Trans. Image Process. 16(12), 2980–2991 (2007). 10.1109/TIP.2007.909318 [DOI] [PubMed] [Google Scholar]
- 51.Wahlberg B., et al. , “An ADMM algorithm for a class of total variation regularized estimation problems,” IFAC Proc. 45(16), 83–88 (2012). 10.3182/20120711-3-BE-2027.00310 [DOI] [Google Scholar]
- 52.Eckstein J., Yao W., “Augmented Lagrangian and alternating direction methods for convex optimization: a tutorial and some illustrative computational results,” RUTCOR Res. Rep. 32(3), 44 (2012). [Google Scholar]
- 53.Ma M., Nikolakopoulos A. N., Giannakis G. B., “Hybrid ADMM: a unifying and fast approach to decentralized optimization,” EURASIP J. Adv. Signal Process. 2018(1), 73 (2018). 10.1186/s13634-018-0589-x [DOI] [Google Scholar]
- 54.Treeby B. E., Cox B. T., “k-Wave: MATLAB toolbox for the simulation and reconstruction of photoacoustic wave fields,” J. Biomed. Opt. 15(2), 021314 (2010). 10.1117/1.3360308 [DOI] [PubMed] [Google Scholar]
- 55.Jeon S., et al. , “Real-time delay-multiply-and-sum beamforming with coherence factor for in vivo clinical photoacoustic imaging of humans,” Photoacoustics 15,100136 (2019). 10.1016/j.pacs.2019.100136 [DOI] [PMC free article] [PubMed] [Google Scholar]
- 56.Wang Z., et al. , “Image quality assessment: from error visibility to structural similarity,” 13(4), 600–612 (2004). [DOI] [PubMed] [Google Scholar]
- 57.Selesnick I., “Total variation denoising (an MM algorithm),” NYU Polytech. Sch. Eng. Lect. Notes 32, 1–13 (2012). [Google Scholar]


