

Abstract
We examined our hypothesis that high‐intensity focused ultrasound (HIFU) treatment of pancreatic ductal adenocarcinoma (PDAC) in nude mice models may lead to an increased occurrence of hematogenous metastasis. The human PDAC cell line BxPC‐3 transfected with mCherry was implanted into nude mice to establish orthotopic and subcutaneous xenograft (OX and SX) tumor models. Mice were exposed to HIFU when tumor sizes reached approximately 200–300 mm3. The OX and SX tumor models were monitored continuously for tumor growth characteristics and hematogenous metastasis using in vivo flow cytometric (IVFC) detection of circulating tumor cells (CTCs) from the pancreas. We chose an appropriate mouse model to further examine whether or not HIFU increases the potential risk of hematogenous metastasis, using IVFC detection. Our results showed that the CTC number was greater in the OX model than in the SX model. The CTC number in the OX model increased gradually over time, whereas the CTC number in the SX model remained low. Therefore, the OX model was better for studying tumor metastasis by IVFC detection. We found significantly decreased CTC numbers and tumor volume after HIFU ablation. Our results showed the applicability of the PDAC OX tumor model for studying the occurrence of tumor metastasis due to the generation of CTCs. HIFU ablation substantially restricted PDAC hematogenous metastasis and provided effective tumor control locally. © 2020 The Authors. Cytometry Part A published by Wiley Periodicals Inc., on behalf of International Society for Advancement of Cytometry.
Keywords: pancreatic cancer, high‐intensity focused ultrasound, circulating tumor cells, in vivo flow cytometry

Despite modern advances in early diagnosis and cancer treatment strategies, pancreatic ductal adenocarcinoma (PDAC) remains one of the most lethal malignancies, due to its asymptomatic early disease phase and aggressive tumor biology. Surgical resection offers the best possible chance for a cure; however, only 10–20% of diagnosed patients present with potentially resectable PDAC 1, 2. The noninvasive ablation of PDAC with high‐intensity focused ultrasound (HIFU) energy captured widespread interest. Globally, HIFU is emerging as a therapeutic modality with an increasing number of clinical applications 3. HIFU uses extracorporeal high‐intensity focused ultrasound energy to ablate tumor inside the body under the guidance of real‐time ultrasound imaging 4, 5. However, HIFU treatment may lead to ultrasound shear forces and inertial cavitation, which could lead to the dissemination of cancer cells and increase potential hematogenous metastasis risk 3, 6, 7.
The in vivo animal models offer a practical approach for studying malignancy and metastasis. Many in vivo animal models have been used to study PDAC. The classical models include the subcutaneous xenograft (SX) and orthotopic xenograft (OX) tumor models 8. The ability of these tumor models to mirror the human cancer pathology and therapeutic clinical response is directly related to the technical difficulties in generating the model and also the tumor microenvironment. Although the SX tumor model has certain advantages, such as simplicity of the procedure, the ease of tumor growth and response to treatment, it lacks the orthotopic environment for pancreatic tumor formation and also is less invasive. The OX tumor model mimics the tumor environment, thus allowing the growth of tumors and migration; however, it is more complicated to establish 9.
Therefore, for studying the hematogenous metastasis after HIFU ablation, an effective and reliable indicator is required for continuous in vivo monitoring, and circulating tumor cells (CTCs) could fulfill this requirement. CTCs are cells shed from solid tumors into the circulation and shown to be prognostic biomarkers for metastatic disease. The quantification of blood CTC levels serves to monitor treatment effectiveness 10. Although CTCs have been studied in PDAC 11, their role as a biomarker is not well‐established compared to other solid cancers 12, 13, and could be due to the low sensitivity of conventional methods for detecting CTCs in the peripheral blood of patients with PDAC. However, in vivo flow cytometry (IVFC) is optimized for continuous noninvasive monitoring of fluorescently labeled tumor cells entering the circulation system of live animals. The IVFC detects fluorescent cells in fast‐flowing blood that pass through the laser slit across the artery and is capable of monitoring the tumor cells in circulation continuously. The specificity and sensitivity of IVFC have been verified earlier. In addition, Fan et al showed a higher sensitivity of IVFC for CTC detection compared to whole blood analysis by conventional flow cytometry 14, 15, 16.
To our knowledge, no reports exist on evaluating HIFU effects on PDAC ablation using in vivo monitoring of CTCs. Therefore, this study aimed to assess the hematogenous metastatic risk of HIFU therapy by IVFC.
Materials and Methods
Cell Culture and Sorting Procedure
The human pancreatic cancer cell line BxPC‐3 was purchased from the Cell Bank of the Chinese Academy of Sciences, Shanghai, and were cultured in RPMI‐1640 medium (HyClone, USA) containing 10% fetal bovine serum (FBS, Ausbian, Australia), 100 I.U./mL penicillin/streptomycin (Gibco, USA) and incubated under 5% CO2 atmosphere at 37°C. The BxPC‐3 cells in exponential growth phase were seeded at a density of 2–3 × 10⁵/mL in 6‐well plates in 1 ml culture medium with 6 μg/ml of polybrene and 2 μl pLVX‐mCherry‐C1 (Takara, Mountain View, USA) lentiviral vector containing the puromycin resistance gene and grown for 24 h. The mCherry positive cells were selected with 2.5 μg/ml puromycin (Gibco, USA), and subcultured with trypsin (Gibco, USA) when cell growth reached 80% confluence. Approximately 107 mCherry‐BxPC‐3 cells were trypsinized to prepare a cell suspension. Cells exhibiting the highest fluorescence (top 1%) were sorted by fluorescence‐activated cell sorting (FACS, MoFlo Astrios, Beckman, USA). Flow cytometry (CytoFlex S, Beckman, USA) analysis was used to detect the fluorescence intensity before and after FACS, and at least 104 cells were analyzed from each sample. The transfection efficiency of mCherry‐BxPC‐3 cells was above 99% based on fluorescence microscopic evaluation (Nikon, Japan) (Fig. 2A,B). To maintain the high intensity of mCherry fluorescence, the sorted cells were cultured with puromycin (0.4 μg/ml) before the animal experiment.
Figure 2.

The brightest (top 1%) mCherry‐BxPC‐3 cells were sorted by fluorescence‐activated cell sorting(FACS), then CTCs measurement by in vivo flow cytometry(IVFC) after nude mice implantation. (A) Differential interference contrast image of tumor cells; (B) Fluorescent image of tumor cells. Scale bar, 50 μm; (C) before FACS, the proportion of the brightest cells was 73.52%; (D) After FACS, the brightest cells accounted for 99.38%; (E) Showing off a piece of blank control data. The animals in the blank control group (n = 6) did not undergo tumor implantation; (F) Visualization of digitized IVFC signals of mCherry‐BxPC‐3 cells using software developed on MATLAB platform. A 10 min recorded data on day 12 of the OX tumor model was shown (arrow, a single cell trace). [Color figure can be viewed at wileyonlinelibrary.com]
Experimental Animal Models
Balb/c nude mice (Shanghai Laboratory Animal Center, Chinese Academy of Science) aged 4–6 weeks, weighing 20 ± 2.0 g, were raised under specific pathogen‐free (SPF) conditions at the Shanghai Sixth People's Hospital Experimental Animal Center. Animal care and experimental protocols were following the Institutional Animal Care and Use Committee (IACUC) of Shanghai Jiaotong University Affiliated Shanghai Sixth People's Hospital guidelines. The IACUC approved this study. The nude mice were anesthetized by intraperitoneal injection of 50 mg/kg of 1% sodium pentobarbital, and all efforts were made to minimize animal discomfort.
Approximately, the sorted mCherry‐BxPC‐3 cells were cultured for at least three passages before implantation (Supplementary Fig. 1). 107/200 μl of mCherry‐BxPC‐3 cells were implanted subcutaneously on the flank of the mice for establishing the tumor. After the subcutaneous tumor size reached almost 400–500 mm3, the tumor tissue was excised and cut into small cubes (1 mm3 each), then tumor cubes with relatively uniform brightness were selected under a fluorescence microscope. These cubes were randomly implanted into mice in each group. For the SX tumor model, the tumor cubes were re‐inoculated into the right flank of the nude mice. For the OX tumor model, the implantation was done under aseptic conditions. The recipient mice were anesthetized with sodium pentobarbital. The upper abdomen was prepared with 70% alcohol and betadine scrub. A 1‐cm incision beside the rectus muscle of the left upper abdomen was made. The spleen and the tail of the pancreas were exposed, the pancreatic capsule was cut, and the 1mm3 cube of the mCherry‐BxPC‐3 tumor was implanted into the tail of the pancreas. The incision in the pancreas was closed with a 7–0 suture, and the two layers of the abdominal cavity were closed with a 5–0 suture.
In Vivo Flow Cytometry
The mCherry positive CTCs in the peripheral blood was monitored (Fig. 1B) by IVFC as described earlier 14, 15, 16. Briefly, trans‐illumination with a 535 ± 15 nm light‐emitting diode (LED) was used to illuminate an artery of 50–70 μm in diameter. Light from the 561 nm laser was focused on a slit by a cylindrical lens and imaged across the selected ear artery. When the mCherry labeled tumor cells passed through this slit, the emitted fluorescence was detected with a photomultiplier tube. The resulting data were collected and stored on a computer (Fig. 1C,D).
Figure 1.

Schematic diagram of high‐intensity focused ultrasound (HIFU) ablation and in vivo flow cytometry (IVFC) detection. (A) The schematic illustration of the ultrasound‐guided HIFU ablation on the orthotopic mCherry‐BxPC‐3 tumor‐bearing nude mouse. (B) Red fluorescence‐labeled tumor cells intravasate into the vascular and circulate throughout the body as circulating tumor cells (CTCs). (C) Optical path design of 561 nm excited IVFC. M1: reflection mirrors. CL: cylinder lens. DM1, DM2: dichroic mirrors. MS1, MS2: mechanical slits. F1, F2: filters. AL1, AL2, AL3: achromats lens. PMT: photomultiplier tube. CCD: charge coupled device. (D) Mouse ear blood vessels obtained by light‐emitting diode (LED) transmission illumination. The mCherry‐BxPC‐3 cells passed through the laser slit, then the fluorescence signals from the excited cells were recorded. Scale bar, 50 μm. [Color figure can be viewed at wileyonlinelibrary.com]
The CTC's hemodynamics was measured by positioning the anesthetized mice on the stage for detecting mCherry positive CTCs. The IVFC was estimated for over 1 h for each mouse every 3 days starting from tumor implantation till death. Each group included at least six mice.
Tumor Volume Measurement by Ultrasound
In vivo ultrasound images were acquired by Aplio500 (TOSHIBA, Japan) to assess tumor growth. In experiments, mice were anesthetized, and the tumor images acquired at a frequency of 18 MHz to measure the largest section of the mass. The tumor volume was calculated as follows:
HIFU Equipment and Treatment Parameters
We used the HY2900 HIFU therapeutic system (Wuxi Haiying Technology, Wuxi, China) in this study (Fig. 1A). A 3.5 MHz diagnostic transducer was positioned in the center of the therapeutic transducer to guide and monitor the HIFU irradiation. HIFU exposure was performed in a tank filled with degassed water. The temperature in the water bath was maintained by a thermostat set to 36°C. The anesthetized tumor‐bearing mouse was treated when the tumor volume reached approximately 200–300 mm3.
The following acoustic parameters were set as reported earlier 17: Tumor treatment was accomplished by progressive scanning of the entire tumor volume point‐by‐point with the following settings: TON (the irradiation time at each single point): 500 ms, TOFF (the irradiation interval time): 2000 ms, the output acoustic power was set to 47.92 W. The interval between two points was 1‐mm, and the spatially averaged intensity was 1,134 W/cm2. Three‐dimensional reconstruction of the B‐mode ultrasound images was performed on the computer. Before and after HIFU irradiation, B‐mode US, color Doppler US, power Doppler US, and superb microvascular imaging (SMI) mode were conducted. Examination variables such as the probe frequency, gain, focus points, focus range, and depth was adjusted to obtain the best images. Conventional B‐mode US was used to observe the echo gray change and echo distribution within the tumor before and after HIFU ablation, color or power Doppler US and SMI mode was used to monitor blood flow within and around the tumor.
Pathology
Tumor specimens before and after HIFU irradiation were obtained from the SX and OX tumor models, and sections were stained with hematoxylin and eosin (H&E).
Statistical Analysis
Unless stated otherwise, all experimental data were analyzed using two‐way ANOVA followed by Sidak's multiple comparisons test (at least three replicates in each group). The overall survival rate was calculated by the Kaplan–Meier analysis and compared by the log‐rank test, and analyzed with the GraphPad Prism Version 7.0 software. Before and after HIFU ablation, the grayscale change in each tumor shown on B‐mode US imaging was analyzed by ImageJ Version 1.45 software. The differences in the mean gray values between the two groups were tested using unpaired two‐tailed Student's t‐test. P < 0.05 was considered statistically significant.
Results
In Vivo CTCs Counting by IVFC
After tumor cell sorting, the mCherry positive cells were above 99% (Fig. 2C,D) of the total population. Positive signals had high peaks compared to the low background noise (Fig. 2F). Due to non‐uniformly expressed intracellular red fluorescent proteins, each signal showed different peak heights. Peak width represented the time that cells passed through the laser slit. We did not detect a noticeable signal peak in mice without implanted tumors (Fig. 2E). The results validated the feasibility of IVFC detection of BxPC‐3‐mcherry tumor‐derived CTC.
Growth Characteristics of OX and SX Tumor Models
For establishing the PDAC OX and SX tumor models, BxPC‐3 tumor cells were labeled with mCherry and implanted into the pancreatic tail and the right flank of nude mice. After tumor implantation, the OX and SX tumor formation rates in mice models were 100%.
A comparison of mice weights between the OX and SX tumor models vs. the tumor‐free control group (tumor‐free group) (n = 6 for each group), showed invasive tumor growth in the abdominal cavity of the OX tumor animal model, and appearance of dyscrasia in the late period. The OX model mice began to lose weight after day 10. In contrast, in the SX tumor group, although the tumor grew over time, the tumor site was located under the right flank skin with less tissue and organ involvement. Hence, dyscrasia was not noticeable. There was no significant difference in body weight between the SX and tumor‐free group and maintained tumor growth over 25 days (Fig. 3A). Next, we investigated the overall survival rate of the OX and SX tumor models. As shown in Figure 3B, the median survival of the OX tumor model, was 19.5 days compared with 55.0 days in the SX tumor model. Although no animals died in the SX tumor group, all animals in the OX tumor group died and were significantly different. We used ultrasound imaging to measure tumor size every 5 days. There was no significant difference in tumor volume between OX and SX tumors within 10 days; however, 10‐days after tumor implantation, sizes of the tumors were significantly larger in the OX model than in the SX model (Fig. 3C). These results indicated that the PDAC in the OX model grew faster than in the SX model.
Figure 3.

Growth characters and CTCs dynamics of mCherry‐BxPC‐3 cells in the OX and SX tumor models. (A) The line graph showed mice weight in the OX tumor model, SX tumor model, and normal control group. 10 days after tumor implantation, the OX tumor model weight began to lose, which were significant differences compared to the SX tumor model and normal control group. There was no difference in mice weight between the SX tumor model and the normal control group. (B) The survival rate of the OX model (n = 12) was significantly lower than that of the SX model (n = 7). (C) The column graph showed tumor volume at each point. 10 days after tumor implantation, the tumor volume in the OX tumor model was significantly larger than the SX tumor model. (D) Measured by IVFC for once every 3 days and at least 1 h, there was a difference in CTCs counts between the OX and SX tumor model. (n = 6 for each group, *P < 0.05, **P < 0.01, ***P < 0.001, ****P < 0.0001). [Color figure can be viewed at wileyonlinelibrary.com]
Different CTCs Dynamics in OX and SX Tumor Models
We investigated whether the OX and SX mCherry‐BxPC‐3 tumor models have different CTCs dynamics by conducting IVFC over 1 hour for each mouse (n = 6 for each group), every 3 days after tumor implantation. There was a significant difference between the two CTCs dynamics curves (Fig. 3D). For the OX tumor model, CTCs dynamics showed a gradually rising trend until the last few days, whereas the CTCs from the SX model fluctuated at a low level.
It is apparent that the tumor progression in the two animal models was quite different, and the OX tumor group corresponds more with the clinical situation; hence, it is well‐suited for PDAC metastasis research.
CTCs Dynamics after HIFU Therapy in OX Tumor Model
Considering the significant differences between the tumor growth characteristics and CTCs dynamics in the OX and SX tumor models, the OX model was used for subsequent experiments. On day‐12 after tumor implantation, when the tumor reached approximately 200–300 mm3, mice in the treatment group were irradiated by HIFU (n = 6). A B‐mode US imaging and SMI mode shows (Fig. 4A–C), irregular low echo zone with strong echo in the middle, and circular blood flow around the tumor, which indicated the lack of blood supply, characteristic of PDAC. After HIFU ablation, a coagulative necrotic lesion was induced in the target area. The visible grayscale changed in the target area, suggesting effective ablation (Fig. 4D,E). The mean gray intensities increased after HIFU ablation as measured by ImageJ software histogram analysis (Fig. 4d,e,F).
Figure 4.

Ultrasound imaging of the OX tumor model before and after HIFU ablation. (A) a representative image of the OX tumor on day 12 acquired by the B‐mode ultrasound. The tumor possesses a long diameter of 10.0 mm and a short diameter of 7.5 mm, total volume almost 281.25 mm3. (B and C) The same section shown by superb microvascular imaging (SMI) mode, circular blood flow around the tumor. (D) Before or (E) after HIFU ablation immediately, image of the tumor (line). (d) Before or (e) after HIFU ablation, measurement of mean tumor gray intensity by ImageJ software. (F) The column graph showed a significant difference in mean gray intensity of before and after HIFU ablation. (n = 6 for each group, *P < 0.05). [Color figure can be viewed at wileyonlinelibrary.com]
We monitored CTCs dynamics by IVFC three times at 3‐day intervals after HIFU‐ablation of the OX tumor model (n = 6). CTCs counts decreased compared to the untreated group (Fig. 5A). In addition, HIFU ablation suppressed the tumor growth, resulting in smaller tumor volume compared to the untreated group (Fig. 5B).
Figure 5.

The HIFU ablation restricted hematogenous metastasis of OX tumor model, and provide effective local tumor control. (A) In the OX tumor model, CTCs dynamics after HIFU ablation and the control group. HIFU treatment taken on day 12 after IVFC, monitoring CTCs counts for every 3 days. (B) The volume of tumor in the HIFU ablation group and the control group were shown above. (n = 6 for each group, *P < 0.05, **P < 0.01, ***P < 0.001, ****P < 0.0001). [Color figure can be viewed at wileyonlinelibrary.com]
Histopathologic Analysis
For investigating the tumor growth characteristics, the OX and SX tumors were subjected to histopathology (Fig. 6A,B) and showed remarkably different tumor growth characteristics. The SX tumor was limited to subcutaneous growth with a clear boundary; in contrast, the OX tumor grew invasively in the pancreatic tissue. Furthermore, compared to the SX tumor model, the increased blood supply in the OX tumor model resulted in a rapid growth rate and hematogenous metastasis, factors vital for CTCs formation. The histological results of the OX tumor 24 h after HIFU ablation, showed significant tissue necrosis within the ablation lesions. The distribution of small blood vessels was reduced within the ablation lesions, and cellular structures were damaged and became fuzzy (Fig. 6C).
Figure 6.
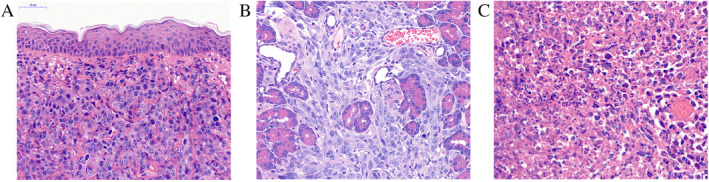
Histological observation of the tumor collected from the tumor‐bearing nude mice, the tissue sections were stained with H&E. (A) The SX tumor limited to subcutaneous growth with a clear boundary on day 12. (B) the OX tumor invasive growth in pancreatic tissue on day 12. (C) The OX tumor 24 h after HIFU ablation, the lesions showed significant necrosis with fuzzy cellular structures. Scale bar, 50 μm. [Color figure can be viewed at wileyonlinelibrary.com]
Discussion
In the clinic, more than 80% of patients have locally advanced or metastatic PDAC, and are unsuitable for curative surgical resection, due to difficulties in early‐stage metastasis detection 18. Chemotherapy, radiotherapy, or a combination of the two are the standard options available for treating patients with unresectable pancreatic cancer. However, PDAC often shows poor response to either chemotherapy or radiotherapy 19. Therefore, HIFU is being investigated currently as an additional potential therapeutic strategy with the intention of local tumor control, pain palliation, and enhancing tumor drug delivery and radiation therapy effects 20, 21, 22, 23, 24.
The energy deposition of HIFU on a target tissue could induce irreversible death through coagulative necrosis by two predominant mechanisms, the thermal effect, and cavitation. During HIFU treatment, the temperature at the core could rise rapidly above 65–80°C, which leads to effective cell killing. The cavitation effect occurs due to the ultrasound waves subjecting the tissue molecular structure to alternating cycles of compression and rarefaction. Intracellular water turns into a gaseous phase and causes microbubble development, which collapses rapidly, producing high mechanical stress which destroys target tissue 25. However, HIFU raises a new question: could the thermal and cavitation effects enhance the potential risk of metastasis of malignant tumors 6, 7, 26.
To address the question, we used the OX PDAC tumor model instead of the SX PADC model because the former mimics real tumor growth much better. It exhibits rapid tumor growth rate compared to the SX tumor model, suggesting tumor cells grown in the subcutaneous region might be influenced by the tumor type and cell number 27, 28. In addition, the subcutaneous tumor implantation often results in local growth but rarely causes distant metastasis, as shown by the continuous low‐level CTCs counts and health status of tumor‐bearing mice, such as weight loss and cachexia, which only appear in OX tumor model. Furthermore, considering the role of tumor microenvironment on tumor growth and progression, lack of an orthotopic microenvironment, especially the blood supply and growth space, makes the SX model less attractive than the OX model for metastatic PDAC research 28, 29. Furthermore, we assessed tumor progression and CTCs dynamics as therapy outcomes after HIFU therapy in the OX tumor model. We observed low CTC counts after HIFU ablation, which was significantly different from the untreated group. In addition, HIFU ablation effectively suppressed local tumor growth. These conclusions were also confirmed by recent clinical reports showing that HIFU caused significant early and long‐lasting pain relief and reduction in tumor size in patients with advanced PDAC 30, 31. A possible reason for this observation is HIFU‐induced enhancement of cancer‐specific immunity after treatment. As several studies indicate, ablation generated a large amount of tumor debris in situ, releasing multiple biomolecules such as tumor antigens and damage‐associated molecular patterns, which increased infiltration and activation of CD4+ and CD8+ T cells 21, 24. The other mechanism that may also enhanced cellular immunity involving the release of heat shock proteins, which could stimulate cytotoxic‐T‐cell activity 32, 33.
There are three limitations to this study. One relates to the use of fluorescently labeled cells. Fluorescent proteins allow real‐time CTC detection in the blood vessels; however, due to heterogeneity in fluorescence intensity, and fluorescent protein loss in the anoxic conditions of a growing tumor may lead to underestimation of CTCs counts 34, 35. Another limitation is the detection of IVFC penetration depth for biomedical research and the clinic. The fluorescence‐based IVFC could only detect a maximum depth of approximately 330 μm underneath the skin, thus limiting its clinical application, since human vessels are deeper than 330 μm 36. Third, our HIFU procedure did not include the measurement tools for cavitation and temperature, which are important for understanding the pathophysiology and further improving the efficacy of HIFU treatment. However, further studies are required in the future.
In conclusion, the results from this study do not support the hypothesis that HIFU exposure would enhance the potential risk of hematogenous metastasis of PDAC in the OX tumor mice. Furthermore, HIFU ablation substantially restricted hematogenous metastasis, resulting in effective tumor control 26. Although HIFU ablation is used as a promising approach for the palliative treatment of advanced PDAC 37, larger, prospective, multicenter randomized clinical trials are required to assess the long‐term efficacy and to determine HIFU role for treating advanced PDAC.
Supporting information
Supplementary Figure 1 After sorting by FACS, we captured fluorescence microscopy images of mCherry‐BxPC‐3 cells at their third passage (scale bar: 50 μm). (A) A differential interference contrast image; (B) A fluorescent image.
Supplementary Figure 2 After obtaining transfected cells, we cultured them in a medium with puromycin in a T75 culture flask until the cells reached 80% confluence. Then, cells with the strongest fluorescence (top 1%) were isolated by FACS (A). After that, we cultured these sorted populations in the medium with puromycin, and next, some of these cells were used to conduct the animal experiments. Simultaneously, the remainder of these cells was cultured in vitro without puromycin continuously. After our animal experiment, we analyzed this in vitro‐cultured population by flow cytometry and found that there were 93.34% of cells with at least 104 units of mCherry fluorescence intensity (B).
Contributor Information
Xunbin Wei, Email: xwei01@sjtu.edu.cn.
Lixin Jiang, Email: jinger_28@sina.com.
Literature Cited
- 1. Gillen S, Schuster T, Buschenfelde CMZ, Friess H, Kleeff J. Preoperative/neoadjuvant therapy in pancreatic cancer: A systematic review and meta‐analysis of response and resection percentages. PLoS Med 2010;7:e1000267. [DOI] [PMC free article] [PubMed] [Google Scholar]
- 2. Handgraaf HJ, Boonstra MC, Van Erkel AR, Bonsing BA, Putter H, Van De Velde CJ, Vahrmeijer AL, Mieog JS. Current and future intraoperative imaging strategies to increase radical resection rates in pancreatic cancer surgery. Biomed Res Int 2014;2014:890230. [DOI] [PMC free article] [PubMed] [Google Scholar]
- 3. Kennedy JE. High‐intensity focused ultrasound in the treatment of solid tumours. Nat Rev Cancer 2005;5:321–327. [DOI] [PubMed] [Google Scholar]
- 4. Wu F. High intensity focused ultrasound: A noninvasive therapy for locally advanced pancreatic cancer. World J Gastroenterol 2014;20:16480–16488. [DOI] [PMC free article] [PubMed] [Google Scholar]
- 5. Xiaoping L, Leizhen Z. Advances of high intensity focused ultrasound (HIFU) for pancreatic cancer. Int J Hyperthermia 2013;29:678–682. [DOI] [PubMed] [Google Scholar]
- 6. Oosterhof GO, Cornel EB, Smits GA, Debruyne FM, Schalken JA. Influence of high‐intensity focused ultrasound on the development of metastases. Eur Urol 1997;32:91–95. [PubMed] [Google Scholar]
- 7. Fry FJ, Johnson LK. Tumor irradiation with intense ultrasound. Ultrasound Med Biol 1978;4:337–341. [DOI] [PubMed] [Google Scholar]
- 8. Hoffman RM. Patient‐derived orthotopic xenografts: Better mimic of metastasis than subcutaneous xenografts. Nat Rev Cancer 2015;15:451–452. [DOI] [PubMed] [Google Scholar]
- 9. Francia G, Cruz‐Munoz W, Man S, Xu P, Kerbel RS. Mouse models of advanced spontaneous metastasis for experimental therapeutics. Nat Rev Cancer 2011;11:135–141. [DOI] [PMC free article] [PubMed] [Google Scholar]
- 10. Hugenschmidt H, Labori KJ, Brunborg C, Verbeke CS, Seeberg LT, Schirmer CB, Renolen A, Borgen EF, Naume B, Wiedswang G. Circulating tumor cells are an independent predictor of shorter survival in patients undergoing resection for pancreatic and periampullary adenocarcinoma. Ann Surg 2018;271(3):549–558. [DOI] [PubMed] [Google Scholar]
- 11. Okubo K, Uenosono Y, Arigami T, Mataki Y, Matsushita D, Yanagita S, Kurahara H, Sakoda M, Kijima Y, Maemura K, et al. Clinical impact of circulating tumor cells and therapy response in pancreatic cancer. Eur J Surg Oncol 2017;43:1050–1055. [DOI] [PubMed] [Google Scholar]
- 12. Kurihara T, Itoi T, Sofuni A, Itokawa F, Tsuchiya T, Tsuji S, Ishii K, Ikeuchi N, Tsuchida A, Kasuya K, et al. Detection of circulating tumor cells in patients with pancreatic cancer: A preliminary result. J Hepatobiliary Pancreat Surg 2008;15:189–195. [DOI] [PubMed] [Google Scholar]
- 13. Khoja L, Lorigan P, Zhou C, Lancashire M, Booth J, Cummings J, Califano R, Clack G, Hughes A, Dive C. Biomarker utility of circulating tumor cells in metastatic cutaneous melanoma. J Invest Dermatol 2013;133:1582–1590. [DOI] [PubMed] [Google Scholar]
- 14. Fan ZC, Yan J, Liu GD, Tan XY, Weng XF, Wu WZ, Zhou J, Wei XB. Real‐time monitoring of rare circulating hepatocellular carcinoma cells in an orthotopic model by in vivo flow cytometry assesses resection on metastasis. Cancer Res 2012;72:2683–2691. [DOI] [PubMed] [Google Scholar]
- 15. Pang K, Xie C, Yang Z, Suo Y, Zhu X, Wei D, Weng X, Wei X, Gu Z. Monitoring circulating prostate cancer cells by in vivo flow cytometry assesses androgen deprivation therapy on metastasis. Cytometry 2018;93A:517–524. [DOI] [PubMed] [Google Scholar]
- 16. Suo Y, Xie C, Zhu X, Fan Z, Yang Z, He H, Wei X. Proportion of circulating tumor cell clusters increases during cancer metastasis. Cytometry 2017;91A:250–253. [DOI] [PubMed] [Google Scholar]
- 17. Gao YH, Wu L, Wang R, Guo Q, Chen YN, Hu B, Jiang LX. Contrast‐enhanced ultrasound evaluation of pancreatic cancer xenografts in nude mice after irradiation with sub‐threshold focused ultrasound for tumor ablation. Oncotarget 2017;8:37584–37593. [DOI] [PMC free article] [PubMed] [Google Scholar]
- 18. Drouillard A, Manfredi S, Lepage C, Bouvier AM. Epidemiology of pancreatic cancer. Bull Cancer 2018;105:63–69. [DOI] [PubMed] [Google Scholar]
- 19. Conroy T, Desseigne F, Ychou M, Bouche O, Guimbaud R, Becouarn Y, Adenis A, Raoul JL, Gourgou‐Bourgade S, de la Fouchardiere C, et al. FOLFIRINOX versus gemcitabine for metastatic pancreatic cancer. N Engl J Med 2011;364:1817–1825. [DOI] [PubMed] [Google Scholar]
- 20. Dababou S, Marrocchio C, Scipione R, Erasmus HP, Ghanouni P, Anzidei M, Catalano C, Napoli A. High‐intensity focused ultrasound for pain management in patients with cancer. Radiographics 2018;38:603–623. [DOI] [PubMed] [Google Scholar]
- 21. Mauri G, Nicosia L, Xu Z, Di Pietro S, Monfardini L, Bonomo G, Varano GM, Prada F, Della Vigna P, Orsi F. Focused ultrasound: Tumour ablation and its potential to enhance immunological therapy to cancer. Br J Radiol 2018;91:20170641. [DOI] [PMC free article] [PubMed] [Google Scholar]
- 22. Yu MH, Lee JY, Kim HR, Kim BR, Park EJ, Kim HS, Han JK, Choi BI. Therapeutic effects of microbubbles added to combined high‐intensity focused ultrasound and chemotherapy in a pancreatic cancer xenograft model. Korean J Radiol 2016;17:779–788. [DOI] [PMC free article] [PubMed] [Google Scholar]
- 23. Koonce NA, Juratli MA, Cai C, Sarimollaoglu M, Menyaev YA, Dent J, Quick CM, Dings RPM, Nedosekin D, Zharov V, et al. Real‐time monitoring of circulating tumor cell (CTC) release after nanodrug or tumor radiotherapy using in vivo flow cytometry. Biochem Biophys Res Commun 2017;492:507–512. [DOI] [PMC free article] [PubMed] [Google Scholar]
- 24. van den Bijgaart RJ, Eikelenboom DC, Hoogenboom M, Futterer JJ, den Brok MH, Adema GJ. Thermal and mechanical high‐intensity focused ultrasound: Perspectives on tumor ablation, immune effects and combination strategies. Cancer Immunol Immunother 2017;66:247–258. [DOI] [PMC free article] [PubMed] [Google Scholar]
- 25. Hill CR, ter Haar GR. Review article: High intensity focused ultrasound—Potential for cancer treatment. Br J Radiol 1995;68:1296–1303. [DOI] [PubMed] [Google Scholar]
- 26. Wu F, Wang ZB, Jin CB, Zhang JP, Chen WZ, Bai J, Zou JZ, Zhu H. Circulating tumor cells in patients with solid malignancy treated by high‐intensity focused ultrasound. Ultrasound Med Biol 2004;30:511–517. [DOI] [PubMed] [Google Scholar]
- 27. Dai L, Lu C, Yu XI, Dai LJ, Zhou JX. Construction of orthotopic xenograft mouse models for human pancreatic cancer. Exp Ther Med 2015;10:1033–1038. [DOI] [PMC free article] [PubMed] [Google Scholar]
- 28. Igarashi K, Kawaguchi K, Kiyuna T, Murakami T, Miwa S, Nelson SD, Dry SM, Li Y, Singh A, Kimura H, et al. Patient‐derived orthotopic xenograft (PDOX) mouse model of adult rhabdomyosarcoma invades and recurs after resection in contrast to the subcutaneous ectopic model. Cell Cycle 2017;16:91–94. [DOI] [PMC free article] [PubMed] [Google Scholar]
- 29. McAllister SS, Weinberg RA. Tumor–host interactions: A far‐reaching relationship. J Clin Oncol 2010;28:4022–4028. [DOI] [PubMed] [Google Scholar]
- 30. Marinova M, Huxold HC, Henseler J, Mucke M, Conrad R, Rolke R, Ahmadzadehfar H, Rauch M, Fimmers R, Luechters G, et al. Clinical effectiveness and potential survival benefit of US‐guided high‐intensity focused ultrasound therapy in patients with advanced‐stage pancreatic cancer. Ultraschall Med 2019;40:625–637. [DOI] [PubMed] [Google Scholar]
- 31. Ning Z, Xie J, Chen Q, Zhang C, Xu L, Song L, Meng Z. HIFU is safe, effective, and feasible in pancreatic cancer patients: A monocentric retrospective study among 523 patients. Onco Targets Ther 2019;12:1021–1029. [DOI] [PMC free article] [PubMed] [Google Scholar]
- 32. Kramer G, Steiner GE, Grobl M, Hrachowitz K, Reithmayr F, Paucz L, Newman M, Madersbacher S, Gruber D, Susani M, et al. Response to sublethal heat treatment of prostatic tumor cells and of prostatic tumor infiltrating T‐cells. Prostate 2004;58:109–120. [DOI] [PubMed] [Google Scholar]
- 33. Wu F, Wang ZB, Cao YD, Zhou Q, Zhang Y, Xu ZL, Zhu XQ. Expression of tumor antigens and heat‐shock protein 70 in breast cancer cells after high‐intensity focused ultrasound ablation. Ann Surg Oncol 2007;14:1237–1242. [DOI] [PubMed] [Google Scholar]
- 34. Coralli C, Cemazar M, Kanthou C, Tozer GM, Dachs GU. Limitations of the reporter green fluorescent protein under simulated tumor conditions. Cancer Res 2001;61:4784–4790. [PubMed] [Google Scholar]
- 35. Kuo CW, Chueh DY, Chen P. Real‐time in vivo imaging of subpopulations of circulating tumor cells using antibody conjugated quantum dots. J Nanobiotechnol 2019;17:26. [DOI] [PMC free article] [PubMed] [Google Scholar]
- 36. Ding Y, Wang J, Fan Z, Wei D, Shi R, Luo Q, Zhu D, Wei X. Signal and depth enhancement for in vivo flow cytometer measurement of ear skin by optical clearing agents. Biomed Opt Express 2013;4:2518–2526. [DOI] [PMC free article] [PubMed] [Google Scholar]
- 37. Vidal‐Jove J, Perich E, Del Castillo MA. Ultrasound guided high intensity focused ultrasound for malignant tumors: The Spanish experience of survival advantage in stage III and IV pancreatic cancer. Ultrason Sonochem 2015;27:703–706. [DOI] [PubMed] [Google Scholar]
Associated Data
This section collects any data citations, data availability statements, or supplementary materials included in this article.
Supplementary Materials
Supplementary Figure 1 After sorting by FACS, we captured fluorescence microscopy images of mCherry‐BxPC‐3 cells at their third passage (scale bar: 50 μm). (A) A differential interference contrast image; (B) A fluorescent image.
Supplementary Figure 2 After obtaining transfected cells, we cultured them in a medium with puromycin in a T75 culture flask until the cells reached 80% confluence. Then, cells with the strongest fluorescence (top 1%) were isolated by FACS (A). After that, we cultured these sorted populations in the medium with puromycin, and next, some of these cells were used to conduct the animal experiments. Simultaneously, the remainder of these cells was cultured in vitro without puromycin continuously. After our animal experiment, we analyzed this in vitro‐cultured population by flow cytometry and found that there were 93.34% of cells with at least 104 units of mCherry fluorescence intensity (B).