Abstract
Nucleotide sugars (NS) are fundamental molecules in life and play a key role in glycosylation reactions and signal conduction. Several pathways are involved in the synthesis of NS. The Leloir pathway, the main pathway for galactose metabolism, is crucial for production of uridine diphosphate (UDP)‐glucose and UDP‐galactose. The most common metabolic disease affecting this pathway is galactose‐1‐phosphate uridylyltransferase (GALT) deficiency, that despite a lifelong galactose‐restricted diet, often results in chronically debilitating complications. Alterations in the levels of UDP‐sugars leading to galactosylation abnormalities have been hypothesized as a key pathogenic factor. However, UDP‐sugar levels measured in patient cell lines have shown contradictory results. Other NS that might be affected, differences throughout development, as well as tissue specific profiles have not been investigated. Using recently established UHPLC‐MS/MS technology, we studied the complete NS profiles in wildtype and galt knockout zebrafish (Danio rerio). Analyses of UDP‐hexoses, UDP‐hexosamines, CMP‐sialic acids, GDP‐fucose, UDP‐glucuronic acid, UDP‐xylose, CDP‐ribitol, and ADP‐ribose profiles at four developmental stages and in tissues (brain and gonads) in wildtype zebrafish revealed variation in NS levels throughout development and differences between examined tissues. More specifically, we found higher levels of CMP‐N‐acetylneuraminic acid, GDP‐fucose, UDP‐glucuronic acid, and UDP‐xylose in brain and of CMP‐N‐glycolylneuraminic acid in gonads. Analysis of the same NS profiles in galt knockout zebrafish revealed no significant differences from wildtype. Our findings in galt knockout zebrafish, even when challenged with galactose, do not support a role for abnormalities in UDP‐glucose or UDP‐galactose as a key pathogenic factor in GALT deficiency, under the tested conditions.
Keywords: galactosemia, GALT deficiency, nucleotide sugars, pathophysiology, sugar metabolism, zebrafish

1. INTRODUCTION
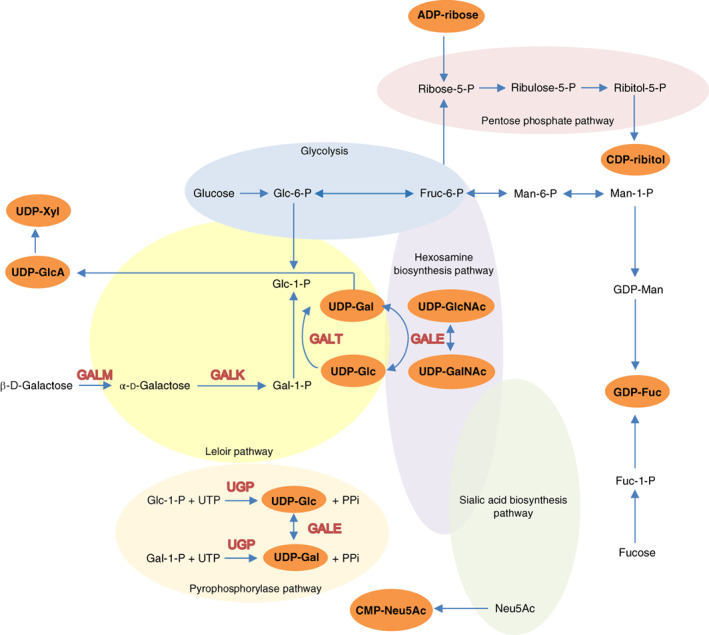
Nucleotide sugars (NS) are activated monosaccharides, formed by the addition of a nucleoside mono‐ or diphosphate (UDP, GDP, CMP). 1 They represent fundamental molecules in life. Well‐known is their participation as glycosyl donors in glycosylation reactions for the biosynthesis of glycoconjugates 2 and their role in signal conduction. 3 Several pathways are involved in nucleotide sugar metabolism, including glycolysis, the Leloir pathway, hexosamine, pyrophosphorylase, and sialic acid biosynthesis pathways and the pentose phosphate pathway. The Leloir pathway, the main pathway for galactose metabolism, plays a key role in the production of uridine diphosphate glucose (UDP‐Glc) and UDP‐galactose (UDP‐Gal). When β‐D‐galactose enters the cell, it is epimerized to α‐D‐galactose by galactose mutarotase (GALM; EC 5.1.3.3). Subsequently, α‐D‐galactose is metabolized in three steps (Figure 1). First, galactokinase (GALK; EC 2.7.1.6) converts α‐D‐galactose into galactose‐1‐phosphate (Gal‐1‐P). Second, Gal‐1‐P and UDP‐Glc are converted to Glc‐1‐P and UDP‐Gal by galactose‐1‐phosphate uridylyltransferase (GALT; EC 2.7.7.12). Third, UDP‐galactose 4′‐epimerase (GALE; EC 5.1.3.2) catalyzes the interconversion of UDP‐Gal and UDP‐Glc and, in humans, also the interconversion of UDP‐N‐acetylgalactosamine (UDP‐GalNAc) and UDP‐N‐acetylglucosamine (UDP‐GlcNAc). 4 The most common metabolic disease that affects the Leloir pathway is GALT deficiency (classic galactosemia). Despite a lifelong galactose‐restricted diet (standard of care), many patients develop neurological and cognitive complications, and the majority of female patients suffers from primary ovarian insufficiency. 5 The pathophysiology of this disorder is not yet fully elucidated. For many years, it has been hypothesized that GALT deficiency leads to alterations in UDP‐hexoses 6 , 7 and that these may be responsible for the galactosylation abnormalities associated with this disease. 8 , 9 , 10 , 11 However, UDP‐hexose levels measured in cell lines derived from classic galactosemia (CG) patients have shown contradictory results. 12 Several studies reported decreased UDP‐Gal levels in red blood cells deriving from CG patients. However, the results obtained in red blood cells were not able to be recapitulated in other cell types, such as lymphocytes and fibroblasts (reviewed by Haskovic et al). 12 Furthermore, other nucleotide sugars and differences through development due to age‐related and tissue‐specific metabolic needs have not been investigated. The recently developed zebrafish (Danio rerio) model for GALT deficiency 13 enabled us to study the complete profiles of nucleotide sugars. In this study we characterized for the first time the complete nucleotide profiles at four developmental stages and in tissues (brain and gonads) of wildtype and GALT deficient zebrafish, using recently established ultrahigh performance liquid chromatography‐tandem mass spectrometry (UHPLC‐MS/MS) technology. 14 , 15
FIGURE 1.

Simplified overview of the pathways involved in nucleotide sugar metabolism in humans. Not all intermediate steps are displayed. The orange ovals indicate the specific nucleotide sugars that were measured in the wildtype and galt knockout zebrafish
2. MATERIALS AND METHODS
2.1. Zebrafish husbandry
Zebrafish (Danio rerio) were housed in recirculating systems on a 14/10 day‐night regime. Husbandry and management of the animals was conducted as previously described. 16
2.2. Sample collection of wildtype (WT) and galt knockout (KO) zebrafish
The WT and galt KO zebrafish were incrossed to obtain embryos. Fish were grown and collected at the embryonic (3 days post fertilization [dpf]), larval (9 dpf), juvenile (4 weeks post fertilization [wpf]), and adult (3 months post fertilization [mpf]) stage. Prior to the collection, zebrafish were euthanized with MS222 (tricaine). Per genotype and developmental stage, three to five samples were collected for analysis. At the embryonic and larval stage, 150 embryos and 100 larvae were pooled per sample. All samples were snap frozen using liquid nitrogen and stored at −80°C prior to analysis. High resolution melting (HRM) curve analysis was applied to confirm the genotype, as previously described. 13
2.3. Galactose challenge in zebrafish embryos
At 24 hours post fertilization (hpf) WT and galt KO embryos were exposed to 200 mM galactose in E3 medium in 100 mm petri dishes, as previously described. 13 All zebrafish were monitored daily for survival, until they reached 3 dpf (72 hpf). Exposed and nonexposed embryos were analyzed and compared.
2.4. Organ dissection from adult zebrafish
Analyses in adult zebrafish were performed in the target tissue of damage, brain, and gonads. To dissect the organs, adult zebrafish were euthanized with a lethal dose of MS222 (tricaine). The relevant organs were collected using the previously described protocol. 17 Organs were stored in 1.5 mL tubes and snap frozen using liquid nitrogen. Samples were stored at −80°C prior to analysis.
2.5. Sample preparation and protein extraction
Samples were suspended in 75 mM ammonium carbonate (pH 7.4). Homogenization was performed by subsequently using an ultra‐turax for 10 seconds and a potter tube (10 strokes). Complete lysis was obtained by sonication for 2 minutes on ice using an ultrasonic processor UP50H (Hielscher) with a 2 mm diameter tip, amplitude 175 μm, power density 480 W/cm2. Lysates were centrifuged at 11500g for 20 minutes at 4°C. Protein content of the supernatant was determined by the BCA Protein Assay Kit (Thermo scientific). Extraction was performed by preparing samples with a volume equal to 400 μg of total protein. Four volumes of ice‐cold 1:1 methanol/acetonitrile (v/v) were added, mixed thoroughly and placed on crushed ice for 10 minutes. The samples were centrifuged at 11500g for 5 minutes at 4°C and the supernatant was transferred to a clean tube. The liquid phase was evaporated by an infrared evaporating system (Hettich, Dancerplus) at room temperature. Ammonium bicarbonate solution was purchased from Sigma‐Aldrich (Zwijndrecht, the Netherlands). Methanol and acetonitrile were obtained from Biosolve (Valkenswaard, the Netherlands).
2.6. Nucleotide sugar analysis
Protein extracts were dissolved in 100 μL MilliQ water. Nucleotide sugars were analyzed by reverse‐phase ion pairing chromatography (Agilent Technologies 1290 Infinity) coupled to a triple quadrupole mass spectrometer operating in negative ion mode (Agilent Technologies 6490 Triple Quad LC‐MS), as previously described. 14 , 15 The following nucleotide sugars were detected in this analysis: UDP‐glucose (Glc), UDP‐galactose (Gal), UDP‐N‐acetylhexosamines (UDP‐HexNAc, composed of UDP‐N‐acetylglucosamine (UDP‐GlcNAc) and UDP‐N‐acetylgalactosamine (GalNAc)), CMP‐N‐acetylneuraminic acid (Neu5Ac), CMP‐N‐glycolylneuraminic acid (Neu5Gc), GDP‐fucose (Fuc), UDP‐glucuronic acid (GlcA), UDP‐xylose (Xyl), CDP‐ribitol, and ADP‐ribose. Peak integration of compounds was done using the Agilent MassHunter Quantitative Analysis software (version B.08.00); all peaks with a signal ratio lower than five were excluded from further analysis. Peak areas from each nucleotide sugar were normalized on the total metabolite peak area, and fold changes to controls were calculated. The WT profiles were compared to galt KO profiles. All analyses and calculations for individual nucleotide sugars were performed on natural log transformed data of the relative abundance.
2.7. Statistical analysis
All values were shown as the natural logarithm (Ln) of the relative abundance of each nucleotide sugar. Differences between WT and galt KO samples as well as differences between developmental stages were evaluated for statistical significance using nonparametric tests (the Mann‐Whitney U test for comparison of the mean of two groups and the Kruskal Wallis test for comparison of means of more than two groups). A p‐value less than .05 was considered statistically significant.
3. RESULTS AND DISCUSSION
The complete nucleotide sugar profiles in zebrafish and at different development stages have, to our knowledge, not been described before. We report UDP‐hexoses (UDP‐Glc, UDP‐Gal), UDP‐hexosamines (UDP‐HexNAc), CMP‐sialic acids (CMP‐Neu5Ac, CMP‐Neu5Gc), GDP‐fucose (Fuc), UDP‐glucuronic acid (GlcA), UDP‐xylose (Xyl), CDP‐ribitol, and ADP‐ribose profiles in wildtype (WT) zebrafish, followed by their characterization in galt knockout (KO) zebrafish. Most of these nucleotide sugars are involved in glycosylation reactions. Glycosylation entails a heterogeneous post‐translational modification of proteins and lipids in the endoplasmic reticulum (ER) and Golgi apparatus, regulated by various factors including sugar metabolism. 18 ADP‐ribose has been proposed to be involved in signaling pathways and in response to cellular stress. 19 , 20 , 21 , 22 Our interpretation of results was as follows: (a) low levels of a nucleotide sugar suggest low demand/production and (b) high levels of a nucleotide sugar suggest high demand/production.
3.1. Nucleotide sugar profiles in WT zebrafish
First, we present the levels of nucleotide sugars during development and in brain and gonads of WT zebrafish.
3.1.1. Nucleotide sugars involved in glycosylation
UDP‐Glc, UDP‐Gal, and UDP‐HexNAc
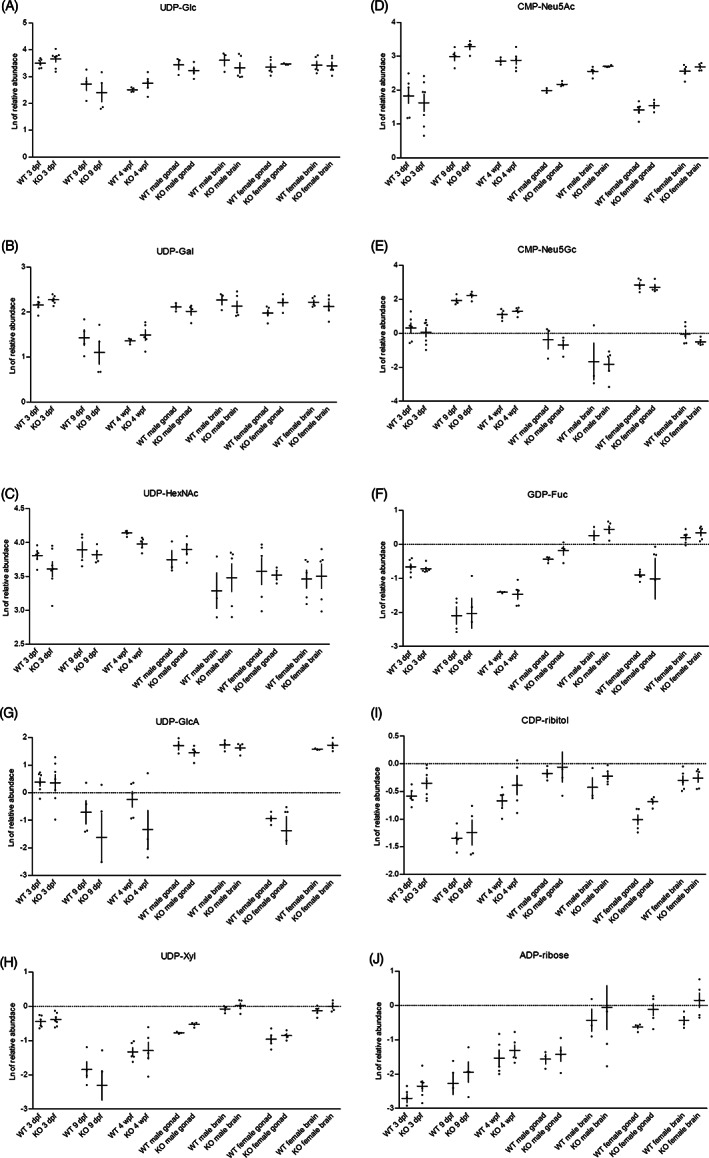
Relative UDP‐Glc and UDP‐Gal levels were lower in zebrafish of 9 days post fertilization (dpf) and 4 weeks post fertilization (wpf) (p = .013 and p = .003) for UDP‐Glc and UDP‐Gal respectively), whereas relative levels of UDP‐HexNAc were slightly higher in the 9 dpf and 4 wpf zebrafish (p = .015), compared to the other developmental stages (Figure 2A‐C). Our studies further revealed that UDP‐Gal levels were relatively lower in gonads compared to brain (p = .015).
FIGURE 2.

Nucleotide sugars in wildtype (WT) and galt knockout (KO) zebrafish. The natural logarithm (Ln) of the relative abundance (+ SE of mean [SEM]) for, A, UDP‐Glc; B, UDP‐Gal; C, UDP‐HexNAc; D, CMP‐Neu5Ac; E, CMP‐Neu5Gc; F, GDP‐Fuc; G, UDP‐GlcA; H, UDP‐Xyl; I, CDP‐ribitol; and J, ADP‐ribose. Levels in WT and galt KO zebrafish at the embryonic (3 dpf), larval (9 dpf) and juvenile (4 wpf) stage and in GALT deficiency target organs of damage, brain and gonads
CMP‐Neu5Ac and CMP‐Neu5Gc
CMP‐Neu5Ac levels increased during early development and differed between the four developmental stages (p < .001; Figure 2D, E). Highest levels were found at the larval and juvenile stages, suggesting a higher need of CMP‐Neu5Ac at these stages. In adult tissues, CMP‐Neu5Ac levels in brain were higher compared to levels in gonads, as well as in male as female tissue (p = .006). For CMP‐Neu5Gc, levels also slightly increased during early development. Interestingly, the highest levels were found in female gonads (p = .016), whereas only traces were detectable in male gonads and in male and female brain tissues. The ratio of CMP‐Neu5Gc to CMP‐Neu5Ac was also higher in female gonads as compared to male gonads and to male and female brain. Our results support the earlier observations of higher incorporation of Neu5Gc in zebrafish ovary as compared to higher levels of Neu5Ac incorporation in zebrafish brain glycans. 23
GDP‐Fuc
GDP‐Fuc levels significantly differed between the four developmental stages (p < .001; Figure 2F). Levels decreased after the embryonic stage, but relatively increased again in adult tissues, suggesting a higher demand in embryonic and adult stages. When comparing brain and gonad tissues, relatively higher levels were found in brain (p = .006).
UDP‐GlcA and ‐Xyl
Both UDP‐GlcA and UDP‐Xyl levels revealed differences throughout the four developmental stages (p = .001 and p = .000120, respectively; Figure 2G, H). Notably, UDP‐GlcA levels in female gonads were particularly lower than in male gonads and in male and female brain (p = .046). UDP‐Xyl levels in brain were relatively higher compared to levels in gonadal tissue (p = .008).
CDP‐ribitol
Levels of CDP‐ribitol also showed differences between the four developmental stages (p = .001; Figure 2I). CDP‐ribitol was found to be lower in larvae compared to other developmental stages. In female adult tissues, relatively lower levels were found in gonads compared to brain (p = .013).
3.1.2. Nucleotide sugars involved in other processes
ADP‐ribose
ADP‐ribose levels were quite low throughout development and were mainly detected in adult tissues (p = .001; Figure 2J). No statistically significant differences were found between levels in brain and gonads. Further studies are needed to further determine the role of ADP‐ribose.
3.2. Nucleotide sugar profiles in galt KO zebrafish
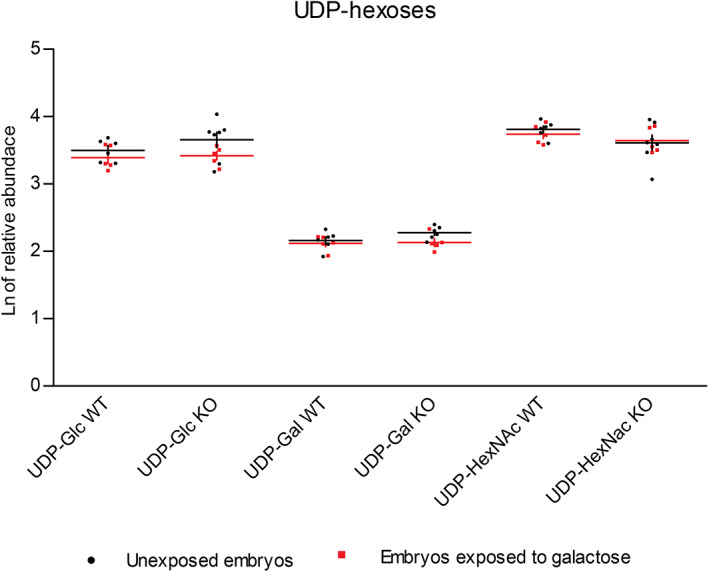
Overall, our galt KO zebrafish exhibited similar nucleotide sugar profiles to the WT zebrafish. Surprisingly, the UDP‐Gal levels did not differ between the galt KO and WT zebrafish. For the adult tissues we know that the activities of UDP‐glucose/galactose pyrophosphorylase (UGP) and GALE, which subsequently convert Glc‐1‐P to UDP‐Glc and UDP‐Gal, 24 are high. 13 Furthermore, qRT‐PCR analysis revealed that the zebrafish gene encoding for UGP is overexpressed in galt KO female gonad tissue (unpublished data). Possibly, high enzymatic activity of both GALE and UGP contribute to the maintenance of normal UDP‐Gal levels in galt KO zebrafish. We found lower levels of UDP‐HexNAc in the galt KO zebrafish at 4 wpf (p = .016). Despite exposure to exogenous galactose (Figure 3), UDP‐hexoses levels remained unaltered, in both WT and galt KO zebrafish.
FIGURE 3.

UDP‐hexoses in wildtype (WT) and galt knockout (KO) embryos. The natural logarithm (Ln) of the relative abundance (+ SE of mean [SEM]) for UDP‐hexoses levels in WT and galt KO embryos, unexposed vs exposed to exogenous galactose (200 mM)
Another difference was observed in the CDP‐ribitol levels (Figure 2I), where relatively higher levels were measured in galt KO female gonads compared to WT female gonads (p = .016).
4. CONCLUSION
Nucleotide sugar profiles were characterized in WT and galt KO zebrafish throughout development and in relevant GALT deficiency target organs, that is, gonads and brain. The nucleotide sugar levels varied throughout development and could possibly reflect the different metabolic needs. Furthermore, nucleotide sugar metabolism appeared to be different in the different analyzed tissues. We found tissue specific levels of CMP‐Neu5Ac and CMP‐Neu5Gc, with higher levels of CMP‐Neu5Ac in brain and of CMP‐Neu5Gc in gonads. GDP‐Fuc, UDP‐GlcA and UDP‐Xyl also showed tissue specific levels, with higher levels in brain. Overall, the nucleotide sugar profiles in the galt KO zebrafish were similar to the profiles detected in WT zebrafish. Our findings in galt KO zebrafish, even when challenged with galactose, do not support a role for abnormalities in UDP‐Gal or UDP‐Glc as a key pathogenic factor in GALT deficiency galactosemia, under the tested conditions. Our galt knockout zebrafish model mimics both the biochemical and clinical human phenotypes, with essentially null GALT activity, accumulation of Gal‐1‐P, and impaired fertility and motor activity. 13 The results of this study do not support that the clinical phenotype in our model is caused by alterations in UDP‐Gal or UDP‐Glc levels. Future studies with techniques that allow unequivocal measurement of all different sugar phosphate intermediates at different developmental stages and in relevant tissue of damage, as well as studies analyzing the expression of genes involved in glycosylation and other pathways will provide more insights in the complex pathophysiology.
Even though zebrafish share a high degree of genetic homology with human, the specific regulation of different pathways during early development and differences in organ physiology warrant caution in the translation of the present results to the human situation.
CONFLICT OF INTEREST
Minela Haskovic, Ana I. Coelho, Martijn Lindhout, Fokje Zijlstra, Raisa Veizaj, Rein Vos, Jo M. Vanoevelen, Jörgen Bierau, Dirk J. Lefeber, and M. Estela Rubio‐Gozalbo declare that they have no conflict of interest.
ETHICS APPROVAL
This study was approved by the Animal Ethics Committee of the University of Maastricht and the Dutch Central Animal Experiments Committee (AVD107002016545).
INFORMED CONSENT
This article does not contain any studies with human subjects performed by any of the authors.
ANIMAL RIGHTS
All institutional and national guidelines for the care and use of laboratory animals were followed.
ACKNOWLEDGEMENT
The authors would like to thank M. van Scherpenzeel for her help with the setup of this study.
Haskovic M, Coelho AI, Lindhout M, et al. Nucleotide sugar profiles throughout development in wildtype and galt knockout zebrafish. J Inherit Metab Dis. 2020;43:994–1001. 10.1002/jimd.12265
Communicating Editor: Ertan Mayatepek
Minela Haskovic, Ana I. Coelho, Dirk J. Lefeber and M. Estela Rubio‐Gozalbo shared first and last authors, respectively.
Funding information Erfelijke Stofwisselingsziekten in het Nederlandse taalgebied; ZonMw, Grant/Award Number: 435004027
REFERENCES
- 1. Handford M, Rodriguez‐Furlan C, Orellana A. Nucleotide‐sugar transporters: structure, function and roles in vivo. Braz J Med Biol Res. 2006;39(9):1149‐1158. [DOI] [PubMed] [Google Scholar]
- 2. Freeze HH, Hart GW, Schnaar RL. Glycosylation precursors In: Varki A, ed. Essentials of Glycobiology. Cold Spring Harbor: New York; 2015:51‐63. [Google Scholar]
- 3. Lazarowski ER, Harden TK. UDP‐sugars as extracellular signaling molecules: cellular and physiologic consequences of P2Y14 receptor activation. Mol Pharmacol. 2015;88(1):151‐160. [DOI] [PMC free article] [PubMed] [Google Scholar]
- 4. Holden HM, Rayment I, Thoden JB. Structure and function of enzymes of the Leloir pathway for galactose metabolism. J Biol Chem. 2003;278(45):43885‐43888. [DOI] [PubMed] [Google Scholar]
- 5. Rubio‐Gozalbo ME, Haskovic M, Bosch AM, et al. The natural history of classic galactosemia: lessons from the GalNet registry. Orphanet J Rare Dis. 2019;14(1):86. [DOI] [PMC free article] [PubMed] [Google Scholar]
- 6. Ng WG, Xu YK, Kaufman FR, Donnell GN. Deficit of uridine diphosphate galactose in galactosaemia. J Inherit Metab Dis. 1989;12(3):257‐266. [DOI] [PubMed] [Google Scholar]
- 7. Lai K, Langley SD, Khwaja FW, Schmitt EW, Elsas LJ. GALT deficiency causes UDP‐hexose deficit in human galactosemic cells. Glycobiology. 2003;13(4):285‐294. [DOI] [PubMed] [Google Scholar]
- 8. Roth S, McGuire EJ, Roseman S. Evidence for cell‐surface glycosyltransferases. Their potential role in cellular recognition. J Cell Biol. 1971;51(21):536‐547. [DOI] [PMC free article] [PubMed] [Google Scholar]
- 9. Charlwood J, Clayton P, Keir G, Mian N, Winchester B. Defective galactosylation of serum transferrin in galactosemia. Glycobiology. 1998;8(4):351‐357. [DOI] [PubMed] [Google Scholar]
- 10. Lebea PJ, Pretorius PJ. The molecular relationship between deficient UDP‐galactose uridyl transferase (GALT) and ceramide galactosyltransferase (CGT) enzyme function: a possible cause for poor long‐term prognosis in classic galactosemia. Med Hypotheses. 2005;65(6):1051‐1057. [DOI] [PubMed] [Google Scholar]
- 11. Coss KP, Hawkes CP, Adamczyk B, et al. N‐glycan abnormalities in children with galactosemia. J Proteome Res. 2014;13(2):385‐394. [DOI] [PubMed] [Google Scholar]
- 12. Haskovic M, Coelho AI, Bierau J, et al. Pathophysiology and targets for treatment in hereditary galactosemia: a systematic review of animal and cellular models. J Inherit Metab Dis. 2019;43:392‐408. 10.1002/jimd.12202. [DOI] [PMC free article] [PubMed] [Google Scholar]
- 13. Vanoevelen JM, van Erven B, Bierau J, et al. Impaired fertility and motor function in a zebrafish model for classic galactosemia. J Inherit Metab Dis. 2018;41(1):117‐127. [DOI] [PMC free article] [PubMed] [Google Scholar]
- 14. van Tol W, van Scherpenzeel M, Alsady M, et al. Cytidine diphosphate‐ribitol analysis for diagnostics and treatment monitoring of cytidine diphosphate‐l‐ribitol pyrophosphorylase a muscular dystrophy. Clin Chem. 2019;65(10):1295‐1306. [DOI] [PubMed] [Google Scholar]
- 15. Willems AP, Sun L, Schulz MA, et al. Activity of N‐acylneuraminate‐9‐phosphatase (NANP) is not essential for de novo sialic acid biosynthesis. Biochim Biophys Acta Gen Subj. 2019;1863(10):1471‐1479. [DOI] [PubMed] [Google Scholar]
- 16. Lawrence C. Advances in zebrafish husbandry and management. Methods Cell Biol. 2011;104:429‐451. [DOI] [PubMed] [Google Scholar]
- 17. Gupta T, Mullins MC. Dissection of organs from the adult zebrafish. J Vis Exp. 2010;37:1717. [DOI] [PMC free article] [PubMed] [Google Scholar]
- 18. Varki A, Lowe JB. Biological roles of glycans In: Varki A, ed. Essentials of Glycobiology. New York: Cold Spring Harbor; 2009. [Google Scholar]
- 19. Gibson BA, Kraus WL. New insights into the molecular and cellular functions of poly(ADP‐ribose) and PARPs. Nat Rev Mol Cell Biol. 2012;13(7):411‐424. [DOI] [PubMed] [Google Scholar]
- 20. Virag L, Robaszkiewicz A, Rodriguez‐Vargas JM, Oliver FJ. Poly(ADP‐ribose) signaling in cell death. Mol Aspects Med. 2013;34(6):1153‐1167. [DOI] [PubMed] [Google Scholar]
- 21. DaRosa PA, Wang Z, Jiang X, et al. Allosteric activation of the RNF146 ubiquitin ligase by a poly(ADP‐ribosyl)ation signal. Nature. 2015;517(7533):223‐226. [DOI] [PMC free article] [PubMed] [Google Scholar]
- 22. Kraus WL. PARPs and ADP‐ribosylation: 50 years … and counting. Mol Cell. 2015;58(6):902‐910. [DOI] [PMC free article] [PubMed] [Google Scholar]
- 23. Yamakawa N, Vanbeselaere J, Chang LY, et al. Systems glycomics of adult zebrafish identifies organ‐specific sialylation and glycosylation patterns. Nat Commun. 2018;9(1):4647. [DOI] [PMC free article] [PubMed] [Google Scholar]
- 24. Berry GT, Walter JH. Disorders of galactose metabolism In: Saudubray JM, ed. Inborn Metabolic Diseases. Berlin Heidelberg: Springer Verlag; 2012. [Google Scholar]


