Abstract
Background
Considerable evidence suggests that the sympathetic nervous system, mainly via adrenergic signaling, contributes to prostate cancer (PCa) progression. However, the underlying molecular mechanisms remain unknown.
Methods
The expression level of β2‐adrenergic receptor (β2‐AR) in tissue microarray was evaluated by immunohistochemistry. The effects of isoproterenol (ISO) or Sonic Hedgehog (Shh) signaling inhibitor on tumor growth were analyzed in proliferation and colony formation assays. The apoptosis of cells was analyzed by flow cytometry. Small hairpin RNA‐based knockdown of β2‐AR or Gli1 was validated by Western blot analysis and real‐time PCR. Effects of β2‐AR on prostate carcinogenesis in vivo were observed in a mouse xenograft model. The expression levels of the indicated proteins in xenograft tissues were evaluated by immunohistochemistry. Expression levels of Shh signaling components and downstream proteins were assessed by immunoblotting.
Results
We determined that β2‐AR was expressed at significantly higher levels in carcinoma than in normal prostate tissues. β2‐AR signaling also played an essential role in sustaining PCa cell proliferation in vivo and in vitro. We also found that inhibition of Shh signaling or knockdown of Gli1 expression significantly restrained ISO‐induced cell proliferation in vitro. ISO alleviated the apoptosis induced by suppressing or knocking down of Gli1. The β2‐AR agonist ISO upregulated the transcription and protein expression of target genes of Shh signaling, including c‐Myc, Cyclin D1, and VEGFA. Conversely, knocking down β2‐AR markedly suppressed the expression of Shh components in vivo and in vitro. In Gli1 knockdown cells, ISO failed to increase the expression of target genes of Shh signaling.
Conclusions
In this study, we uncovered an important role of β2‐AR signaling in regulating the Shh pathway activity in PCa tumorigenesis and provide further insight into the mechanism of the involvement of the Hh signaling pathway. Furthermore, given the efficacy of β2‐adrenergic modulation on PCa, our study might also add evidence for potential therapeutic options of β‐blockers for PCa.
Keywords: proliferation, prostate cancer, Sonic hedgehog signaling pathway, tumorigenesis, β2‐adrenergic receptor
1. INTRODUCTION
Many solid tumors receive direct innervation and the release of neurotransmitters from the sympathetic nerves, including prostate cancer (PCa). 1 These nerves play a central role in sustained tumor growth and cell dissemination. Recent studies have revealed that the sympathetic nervous system, a major pathway for stress‐induced signals, promoted the early stage of prostatic tumorigenesis through the β‐AR in a mouse model. 2
Sympathetic nerve fibers deliver adrenergic signals and promote cancer development mainly though β2‐adrenergic receptor (β2‐AR) expressed in the tumor microenvironment of PCa. 3 , 4 The activation of β2‐AR has been implicated in multiple processes of cancer initiation and progression. Several studies have shown that activation of β2‐AR increased MCL‐1 expression and BAD phosphorylation, which are responsible for apoptosis inhibition in PCa cells. 5 , 6 Additionally, β2‐AR activation upregulated proangiogenic vascular endothelial growth factor (VEGF) levels and induced angiogenesis of PCa. 7 , 8 β2‐AR stimulation also promoted neuroendocrine differentiation of prostatic adenocarcinoma cells by increasing the activity of cyclic adenosine monophosphate (cAMP)‐dependent protein kinase A (PKA). 9 Moreover, Yu et al 10 have demonstrated that knockdown of β2‐AR induced epithelial‐mesenchymal transition of transformed prostatic epithelial cells. 10 Several retrospective epidemiological studies have determined that using β‐blockers in PCa patients can decrease tumor incidence and mortality. 11 , 12 However, the effects of β2‐AR activation on PCa progression have yet to be fully elucidated.
The Sonic Hedgehog (Shh) pathway demonstrates aberrant activity in tumors 13 and plays important roles in prostatic cell proliferation, individual development, tumorigenesis, and metastasis as well as the poor prognosis of PCa. 14 , 15 , 16 Shh ligand binding with its transmembrane receptor Patched1 (Ptch1) results in the translocation of the oncoprotein Smoothened into the cilium and activates Gli zinc‐finger transcription factors, leading to Shh signaling activation. 17 Hh signaling also likely has significant crosstalk with oncogenic pathways, such as the MAPK, PI3K, nuclear factor‐κB, and transforming growth factor‐β pathways. 18 , 19
β2‐AR is known to interact with stimulatory Gα (Gs) protein, which catalyzes the adenylyl cyclase that generates cAMP, followed by the activation of downstream effectors: PKA, exchange protein activated by adenylyl cyclase (EPAC) and cyclic‐nucleotide‐gated ion channels. 20 , 21 Early evidence from Drosophila and later work in vertebrates established the cAMP/PKA pathway as a major pathway that opposes Hh signaling through phosphorylating intracellular signaling mediators and targeting them for degradation. 22 Thus, it seems possible that ligands that activate β2‐AR may act in some cases to oppose or enhance Hh signaling, which to our knowledge, has rarely been reported in PCa.
2. MATERIALS AND METHODS
2.1. Prostate tissue microarray
Tissue microarrays (TMA) (PR632, PR483c; BioMax) with 67 tissue samples, including 15 normal prostate specimens, six benign hyperplasia specimens, and 46 PCa specimens, with TNM, Gleason scores and pathological grades, were available for immunohistochemical techniques.
2.2. Immunohistochemistry of TMA sections and xenografts
Immunohistochemical staining was performed on TMA and formalin‐fixed, paraffin‐embedded tissues from PC‐3 cell line xenografts. Before staining, sections were dried for 1 hour at 60℃ and deparaffinized in xylene for 30 minutes, after which they were rehydrated by serial incubations in alcohol. Heat‐induced antigen retrieval was performed in citrate buffer at pH 6.0. Sections were subsequently blocked with goat serum and incubated with primary antibody [anti‐β2‐AR rabbit monoclonal antibody (ab182136; Abcam), anti‐Ki‐67 rabbit monoclonal antibody (9027; Cell Signaling), anti‐Shh rabbit monoclonal antibody (ab53281; Abcam), anti‐Gli1 rabbit polyclonal antibody (bs‐1206R; Bioss, China) or anti‐Ptch1 rabbit polyclonal antibody (ab53715; Abcam) overnight at 4°C (details were shown in Table 1), followed by Histostain‐SP (Streptavidin‐Peroxidase) kit reagent (SP0023; Beijing Biosynthesis Biotec, China), according to the manufacturer's instructions. The diaminobenzidine chromogen (ZSGB Biotec, China) was used for coloration. Slides were finally counterstained with hematoxylin. Negative controls were obtained after the omission of the primary antibody. Stained sections were examined and photographed on a bright‐field microscope (BX53; Olympus) connected to cellSens standard imaging software (Olympus).
Table 1.
Antibodies’ references and immunohistochemistry and Western blot analysis procedures
| Antibodies | Reference | Type | Dilution | Incubation |
|---|---|---|---|---|
| β2‐AR | ab182136, Abcam, USA | Monoclonal rabbit | 1:250/1:1000 | Overnight 4°C |
| Ki‐67 | 9027, Cell Signaling, USA | Monoclonal rabbit | 1:400 | Overnight 4°C |
| Shh | ab53281, Abcam, USA | Monoclonal rabbit | 1:400/1:1000 | Overnight 4°C |
| Gli1 | bs‐1206R, Bioss, China | Polyclonal rabbit | 1:400 | Overnight 4°C |
| ab49314, Abcam, USA | Polyclonal rabbit | 1:1000 | ||
| Ptch1 | ab53715, Abcam, USA | polyclonal rabbit | 1:250/1:1000 | Overnight 4°C |
| Cyclin D1 | 2978, Cell Signaling, USA | Monoclonal rabbit | 1:1000 | Overnight 4°C |
| c‐Myc | 5605, Cell Signaling, USA | Monoclonal rabbit | 1:1000 | Overnight 4°C |
| VEGFA | ab1316, Abcam, USA | Monoclonal mouse | 1:1000 | Overnight 4°C |
| GAPDH | 97166, Cell Signaling, USA | Monoclonal mouse | 1:5000 | Overnight 4°C |
| β‐tubulin | 100109‐MM05T, Sino Biological, China | Monoclonal mouse | 1:5000 | Overnight 4°C |
Abbreviations: β2‐AR, β2‐adrenergic receptor; GAPDH, glyceraldehyde 3‐phosphate dehydrogenase; Shh, Sonic Hedgehog; VEGFA, vascular endothelial growth factor.
2.3. Scoring of TMA
TMA protein expression was determined using a validated scoring method. 23 , 24 Stained sections were scored semiquantitatively by two independent researchers. Under a high‐power field (magnification, ×200), signals were scored as β2‐AR “low” when cytomembrane staining was negative or when there were less than 50% PCa cells with weak staining and “high” when ≥50% of PCa cells displayed a strong intensity staining in four contiguous high‐power fields in three different areas of each section. 24 Associations between clinicopathologic variables and markers were analyzed using Pearson's χ 2 test or Fisher's exact analyses.
2.4. Cell culture
The PCa cell lines PC‐3 and LNCaP (LNCaP clone FGC) were obtained from the Shanghai Institute of Life Sciences (Shanghai, China). The cell lines were authenticated by STR profiling. PC‐3 and LNCaP cells were routinely maintained in DMEM/F12 (Gibco) and RPMI‐1640 (Gibco), respectively, with 10% fetal bovine serum (Biological Industries) supplemented 1% penicillin‐streptomycin in a humidified incubator containing 5% CO2 at 37°C.
2.5. Cell proliferation assays and colony formation assays
For the cell proliferation assays, PC‐3 and LNCaP cells (3×10³/well) were seeded in growth medium supplemented with dimethyl sulfoxide (DMSO) or 1 μM isoproterenol (ISO) 25 , 26 in 96‐well plates for various time periods. Cell proliferation was evaluated by measuring cell viability using the Cell Counting Kit 8 assay (Dojindo Laboratories, Japan) according to the manufacturer's instructions.
For cell colony formation assays, PC‐3 and LNCaP cells (300/well) were seeded in triplicate in six‐well plates. Twenty‐four hours later, DMSO, 1 μM ISO (isoprenaline hydrochloride, 51‐30‐9; MedChemExpress) or 10 μM GANT61 27 (500579‐04‐4; MedChemExpress) was added to the medium, and cells were maintained for 10 to 14 days. Colonies were stained with crystal violet, and colonies containing more than 50 cells were counted. 28
2.6. β2‐AR and Gli1 knockdown cells
Lentivirus vectors containing the small hairpin RNA (shRNA) against β 2 ‐AR (shβ2‐AR) (NM_000024) or Gli1 (shGli1) (NM_005269) and the small hairpin negative control (shNC) were constructed and generated by GeneChem Company (Shanghai, China). Lentiviruses were resuspended in DMEM/F12 or RPMI‐1640 and were added dropwise on cells in six‐well plates in the presence of medium without penicillin‐streptomycin. The selection of lentivirus‐infected cells was achieved with puromycin at a final concentration of 5 μg/mL. β2‐AR and Gli gene expression levels in infected cells were validated by Western blot analysis and real‐time polymerase chain reaction (RT‐PCR). Transfection of a control shRNA at the same concentration served as a control.
2.7. Monitoring of subcutaneous xenograft growth
For in vivo β2‐AR knockdown experiments, one million PC‐3‐shNC or PC‐3‐shβ2‐AR shRNA cells were suspended in phosphate‐buffered saline and injected into one subaxilla of each 4‐week‐old male BALB/c‐nude mouse (HFK Bio, China) to generate xenografts. Tumor dimensions were monitored every other day using Vernier calipers. Tumor volume was calculated according to the formula V = (a 2 × b)/2, where a and b are the minimal and maximal diameters in millimeters, respectively. 24 Mice bearing subcutaneous xenografts greater than 600 mm3 were sacrificed. Explanted tumors were weighed, formalin‐fixed, and embedded in paraffin for subsequent analyses. Then, immunohistochemical staining with the indicated antibodies was performed on xenograft tissues. Images were quantified using ImageJ, and the mean intensity was determined and analyzed. 24
2.8. Western blotting analysis analysis
Cells were lysed with RIPA buffer in the presence of protease inhibitor cocktail (Bimake) and incubated 10 minutes on ice and centrifuged at 12 000g for 10 minutes. Protein concentrations were measured using the BCA assay. Immunoblotting was performed after the proteins were transferred to a polyvinylidene difluoride (PVDF) membrane. To detect indicated proteins, the PVDF membrane was incubated with specific primary antibodies overnight at 4°C after incubating in blocking buffer (5% nonfat dry milk in Tris‐buffered saline with 0.1% Tween‐20) for 2 hours and were subsequently incubated with the horseradish peroxidase‐conjugated secondary antibodies for 1.5 hours at room temperature. Immunocomplexes were then visualized using an enhanced chemiluminescence detection kit (Millipore, Billerica, MA) with a ChemiDoc Imaging System (Bio‐Rad, CA). Glyceraldehyde 3‐phosphate dehydrogenase (GAPDH) and β‐tubulin were also detected and served as reference proteins. The following antibodies were used for immunoblotting analyses: anti‐β2‐AR rabbit monoclonal antibody (ab182136; Abcam), anti‐Shh rabbit monoclonal antibody (ab53281; Abcam), anti‐Gli1 rabbit polyclonal antibody (ab49314; Abcam) and anti‐Ptch1 rabbit polyclonal antibody (ab53715; Abcam), Cyclin D1 rabbit monoclonal antibody (2978; Cell Signaling), c‐Myc rabbit monoclonal antibody (5605; Cell Signaling), and VEGFA mouse monoclonal antibody (ab1316; Abcam), each at 1:1000 dilution. Anti‐GAPDH mouse monoclonal antibody (97166; Cell Signaling) and anti‐β‐tubulin mouse monoclonal antibody (100109‐MM05T; Sino Biological, China) were used at 1:5000 dilution (details were shown in Table 1).
2.9. Real‐time polymerase chain reaction
Total RNA was extracted using Simply P RNA extraction kit (BSC52S1; Bioer Technology) according to the manufacturer's protocol. Complementary DNA (cDNA) was synthesized from 1 μg of RNA using a PrimeScript RT reagent kit (RR037A; TaKaRa, China). SYBR green reagent (RR820A; TaKaRa, China) was applied to perform quantitative PCR on a CFX Connect Real‐Time PCR Detection System (Bio‐Rad Laboratories) with 2 μL of cDNA, 3.4 μL of Taq PCR Master Mix, 0.3 μL of 10 μM forward primer, 0.3 μL of 10 μM reverse primer and 4 μL of ddH2O (double distilled water) under the following conditions: 95°C for 5 minutes, 40 cycles of denaturation for 3 seconds at 95°C, 30 seconds of annealing at 58°C, elongation at 72°C for 30 seconds, and extension at 65°C for 5 seconds. The primer sequences were generated by SangonBiotech (Shanghai, China) and are listed below:
| β2‐AR | Forward | 5′‐GTCTTGAGGGCTTTGTGCTC‐3′ |
| Reverse | 5′‐GGCAGCTCCAGAAGATTGAC‐3′ | |
| Gli1 | Forward | 5′‐ATGAAACTGACTGCCGTTGGGATG‐3′ |
| Reverse | 5′‐TGGATGTGCTCGCTGTTGATGTG‐3′ | |
| GAPDH | Forward | 5′‐ACGGATTTGGTCGTATTGGG‐3′ |
| Reverse | 5′‐CGCTCCTGGAAGATGGTGAT‐3′ |
Abbreviations: β2‐AR, β2‐adrenergic receptor; GAPDH, glyceraldehyde 3‐phosphate dehydrogenase.
Each measurement was performed in triplicate, and the results were normalized by the expression of the GAPDH reference gene. Target levels were determined by the method.
2.10. Flow cytometry analysis
Apoptosis detection of PCa cells was conducted through flow cytometry apoptosis assay (Beckman Coulter). Cells were collected and subjected to FITC‐conjugated Annexin V and propidium iodide (Invitrogen, Carlsbad) according to the manufacturer's protocol. All independent experiments in this section were executed in triplicate.
2.11. Statistical analysis
Statistical analyses were carried out with GraphPad Prism 7.0 (GraphPad Software). Data were analyzed as follows: (a) χ 2 test or Fisher's exact test for the associations between β2‐AR expression and clinicopathological characteristics depending on the conditions of validity (small numbers); and (b) the Student t test or analysis of variance analysis for cell line experiments in vitro and in vivo, including RT‐PCR, colony formation assay, growth assay, apoptosis assay, and xenograft expression assays. Data are presented as mean ± standard deviation. A P value of less than .05 was considered statistically significant.
3. RESULTS
3.1. β2‐AR expression in human PCa tissues
To begin to analyze the role of β2‐AR in PCa, we first performed immunohistochemistry for β2‐AR on TMA representing 46 prostate carcinomas, 15 normal prostate tissues, and six benign hyperplasia tissues (Figure 1 and Table 2). Higher β2‐AR levels were found in 70% of carcinomas vs 13% of cases of normal tissue, indicating a significant relevance between high β2‐AR levels and tumor presence (Table 2). However, benign hyperplasia tissues showed no significant elevation of β2‐AR expression versus normal tissues. Furthermore, in the analysis of clinicopathological parameters, the expression level of β2‐AR was uncorrelated with the Gleason score or other clinical features (Table 2). These findings may indicate that improperly sustained or increased β2‐AR expression is an early and general event in PCa.
Figure 1.
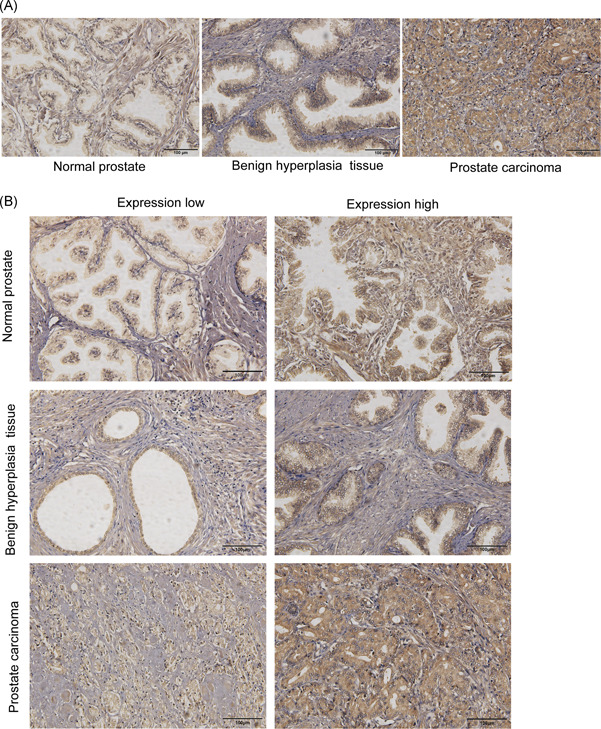
Representative images and scoring of immunohistochemical staining of β2‐AR. A, Immunohistochemistry images of β2‐AR expression in the tissues of TMA sections. Scale bar, 100 μm. B, Examples of scoring low and high immunohistochemical stains for β2‐AR are shown. β2‐AR, β2‐adrenergic receptor [Color figure can be viewed at wileyonlinelibrary.com]
Table 2.
Correlation of elevated β2‐AR expression with clinicopathological parameters of prostate cancer
| β2‐AR | |||||
|---|---|---|---|---|---|
| Total | Expression low | Expression high | P value | ||
| Age, median (range)a, y | Tumor | n = 46 | 66 (51‐82) n = 14 | 70 (20‐87) n = 32 | NS |
| Histology | Tumor | n = 46 | n = 14 | n = 32 | <.001 |
| Normal | n = 15 | n = 13 | n = 2 | ||
| Hyperplasia | n = 6 | n = 3 | n = 3 | NS | |
| Normal | n = 15 | n = 13 | n = 2 | ||
| Clinical stage | cT1/2 | n = 27 | n = 7 | n = 20 | NS |
| cT3/4 | n = 19 | n = 7 | n = 12 | ||
| Tumor grade | Gleason ≤6 | n = 8 | n = 0 | n = 8 | NS |
| Gleason 7 (3 + 4) | n = 7 | n = 2 | n = 5 | ||
| Gleason 7 (4 + 3) | n = 2 | n = 0 | n = 2 | ||
| Gleason >7 | n = 29 | n = 12 | n = 17 | ||
| Pathologic stage | pT1‐pT2 | n = 20 | n = 3 | n = 17 | .050 |
| pT3 | n = 24 | n = 11 | n = 13 | ||
| Nodal status | pN0 | n = 42 | n = 12 | n = 30 | NS |
| pN1 | n = 4 | n = 2 | n = 2 | ||
Note: Tumor grade is presented as Gleason score. Comparison of unordered qualitative variables was performed using the χ 2 test or Fisher's exact test depending on the conditions of validity (small numbers).
Abbreviation: β2‐AR, β2‐adrenergic receptor.
Comparison of quantitative variable between patients with prostate cancer was performed using the student t test.
3.2. Activating β2‐AR signaling promotes, whereas targeting β2‐AR suppresses, cell and xenograft growth in vitro and in vivo
To explore the effect of β2‐AR on tumor growth of PCa, we performed proliferation assay and colony formation assays to evaluate the effect of the chemical ISO, a broad β‐adrenergic agonist, 25 and found that PCa cells stimulated by ISO showed an increase in proliferation (Figure 2A,B). Conversely, as depicted in Figure 2C‐E, cells stably expressing shRNA targeting β2‐AR (shβ2‐AR) showed a significant delay in growth compared with nontargeting control (shNC) cells. In addition, different expression in the protein level of β2‐AR was found between PC‐3 and LNCaP cells (Figure 2F). We then evaluated the effects of β2‐AR on in vivo tumor growth. Mouse xenograft tumors derived from PC‐3‐shβ2‐AR cells grew at a lower rate and showed significant decreases in tumor volume and tumor mass (Figure 3A‐C). Remarkably, immunohistochemical analysis of xenograft tissues demonstrated that β2‐AR expression was paralleled by a decrease in the proliferation marker Ki‐67 (Figure 3D) in shβ2‐AR xenografts. Altogether, these results suggested that β2‐AR plays a critical role in the regulatory proliferation of PCa.
Figure 2.
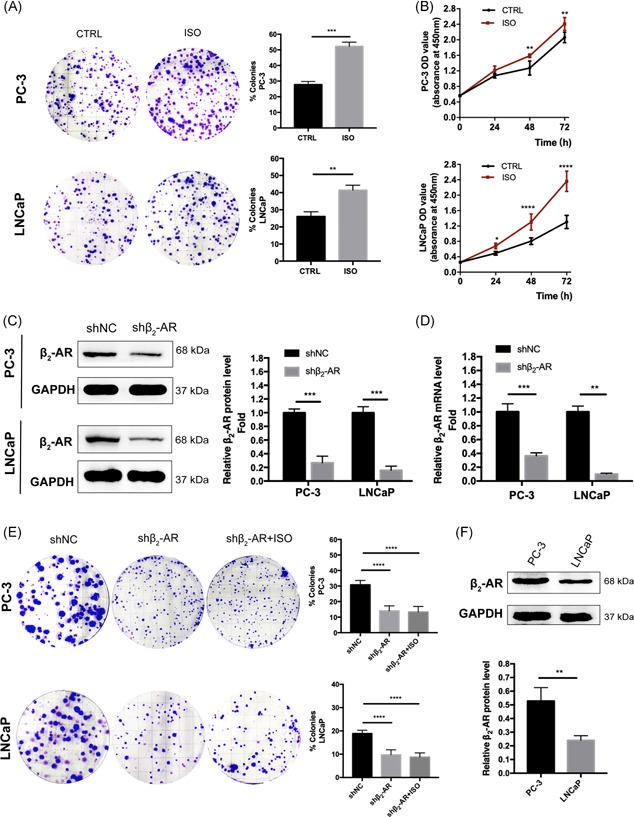
Activating β2‐AR signaling promotes, whereas targeting β2‐AR suppresses, proliferation of PCa cells in vitro. A, Colony formation assays and quantification of cells following treatment with ISO (1 μM). Data represent the mean ± SD of three experiments. *P < .05. B, Increased effect of ISO (1 μM) on cell viability of PC‐3 and LNCaP cells at 24, 48, and 72 hours. C and D, Western blotting and relative quantification of mRNA and protein expression of β2‐AR in PC‐3 and LNCaP cells transduced with a control shRNA (shNC) and shRNA targeting β2‐AR (shβ2‐AR) after 72 hours of puromycin (5 μg/mL) exposure. E, Colony formation assays and quantification of cells from (C and D) following treatment with DMSO or ISO (1 μM). Data represent the mean ± SD of three experiments. *P < .05. F, Western blotting and quantification of protein expression of β2‐AR in PC‐3 and LNCaP cells. Data represent the mean ± SD of three experiments. *P < .05. β2‐AR, β2‐adrenergic receptor; DMSO, dimethyl sulfoxide; ISO, isoproterenol; mRNA, messenger RNA; SD, standard deviation; shRNA, small hairpin RNA [Color figure can be viewed at wileyonlinelibrary.com]
Figure 3.
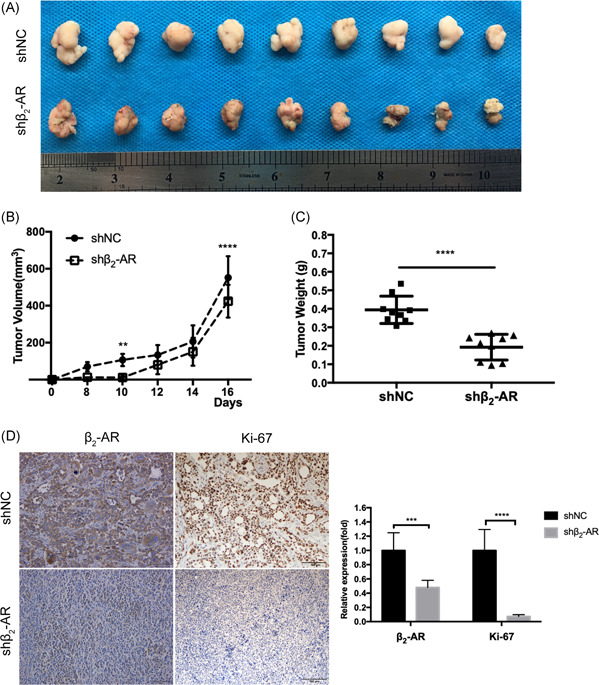
Knockdown of β2‐AR restrains xenograft growth in vivo. A‐C, PC‐3 cells stably expressing shNC or shβ2‐AR were injected subcutaneously into the subaxilla of nude mice. Representative images of dissected tumors at the end of the experiment are shown (A), and tumor growth curves (B) and tumor weights (C) of mice were analyzed. D, Representative immunohistochemistry images and quantification of β2‐AR and Ki‐67 expression in xenografts. Scale bar, 100 μm. β2‐AR, β2‐adrenergic receptor [Color figure can be viewed at wileyonlinelibrary.com]
3.3. Inhibition or knockdown of Gli1 significantly suppresses ISO‐mediated proliferation in PCa cells
Given the capacity of ISO to promote cell proliferation and induce Shh‐Gli1 signaling activity, to further illustrate whether ISO‐mediated Shh‐Gli1 activation is involved in cell proliferation, PC‐3 and LNCaP cells were pretreated with GANT61, a selective inhibitor of Gli1, and were then treated with ISO. Intriguingly, we found that the proliferation facilitated by ISO was significantly suppressed by GANT61 (Figure 4A). Furthermore, knockdown of Gli1 expression by shRNA significantly suppressed the growth of cells, even in the presence of ISO (Figure 4B‐D). Our study revealed that in the absence of Gli1, ISO showed scarcely any effect on the proliferation of PCa cells, which suggested that Shh signaling is involved in ISO‐mediated proliferation in PCa cells.
Figure 4.
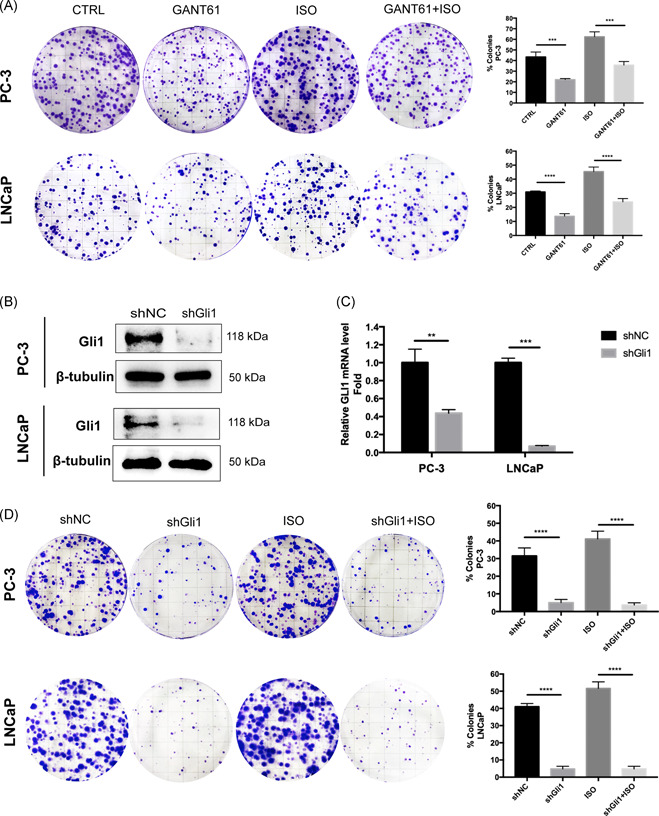
Shh‐Gli1 signaling is required for ISO‐mediated proliferation of PCa cells. A, Colony formation assays and quantification of cells treated with DMSO, GANT61 (10 μM), or ISO (1 μM) in the absence or presence of GANT61 (10 μM). Data represent the mean ± SD of three experiments. *P < .05. B and C, Western blotting and relative quantification of mRNA expression of Gli1 in PC‐3 and LNCaP cells transduced with a control shRNA (shNC) and shRNA targeting Gli1 (shGli1). D, Colony formation assays and quantification of transduced cells targeting Gli1 without or with 1 μM ISO treatment. β2‐AR, β2‐adrenergic receptor; DMSO, dimethyl sulfoxide; ISO, isoproterenol; mRNA, messenger RNA; SD, standard deviation; shRNA, small hairpin RNA [Color figure can be viewed at wileyonlinelibrary.com]
3.4. ISO facilitates resistance to the apoptosis evoked by inhibiting or knocking down of Gli1 in PCa cells
To further illustrate the role of β2‐AR and Shh‐Gli1 activation in cell growth and survival, the flow cytometry apoptosis assays of treated cells were performed and increased apoptosis was found following restraint or knockdown of Gli1 expression compared with DMSO or shNC treated cells (Figure 5), which suggested that Gli1 signaling act a vital role in the survival of PCa cells. Moreover, with the addition of ISO to the cells treated with Gant61 or shGli1 lentivirus, the apoptosis caused by the absence of Gli1 were decreased, which indicated that β2‐AR‐Shh‐Gli1 signaling exerted crucial effect on the survival of PCa cells.
Figure 5.
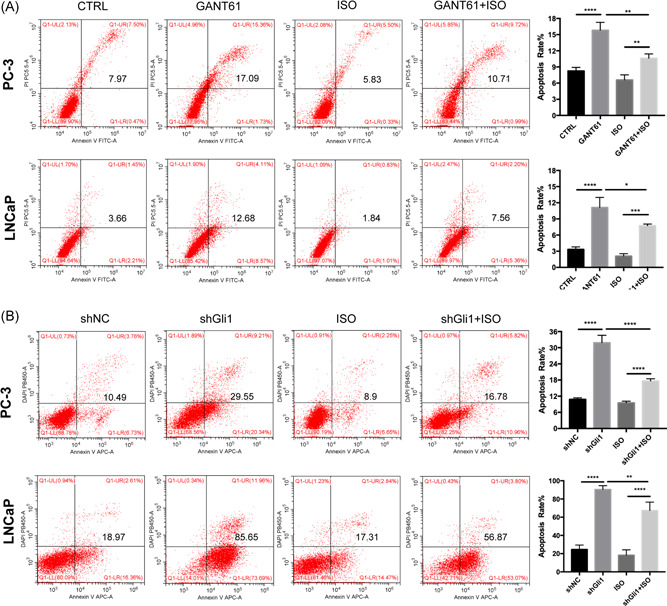
ISO antagonizes the apoptosis induced by targeting Shh‐Gli1 signaling A, Flow cytometry apoptosis assays of cells treated with DMSO, GANT61 (10 μM), or ISO (1 μM) in the absence or presence of GANT61 (10 μM) for 24 hours. Data represent the mean ± SD of three experiments. *P < .05. B, Flow cytometry apoptosis assays of PC‐3 and LNCaP cells transduced with a control shRNA (shNC) or shRNA targeting Gli1 (shGli1) treated with DMSO or ISO (1 μM) for 24 hours. Data represent the mean ± SD of three experiments. *P < .05. β2‐AR, β2‐adrenergic receptor; DMSO, dimethyl sulfoxide; ISO, isoproterenol; SD, standard deviation; shRNA, small hairpin RNA [Color figure can be viewed at wileyonlinelibrary.com]
3.5. β2‐AR activation is essential to signaling factor expression as well as the downstream transcription of target genes of the Shh‐Gli1 pathway in PCa cells
To investigate whether β2‐AR induces Shh signal activity, we first detected the expression levels of the Shh signaling components in PCa cells following treatment with ISO. The results showed that the stimulation of ISO induced the upregulation of Gli1, Shh and Ptch1 (Figure 6A). We next evaluated the expression levels of these signal factors in PCa cells transduced with shRNA targeting β2‐AR and observed a marked downregulation of Shh signal factors in the β2‐AR knockdown cells (Figure 6B). We then performed immunohistochemical analysis and detected the expression of these components in xenograft tissues. Consistently, in in vivo xenograft tumors derived from β2‐AR knockdown cells, we also found significant downregulations of Gli1, Shh, and Ptch1 (Figure 6C,D).
Figure 6.
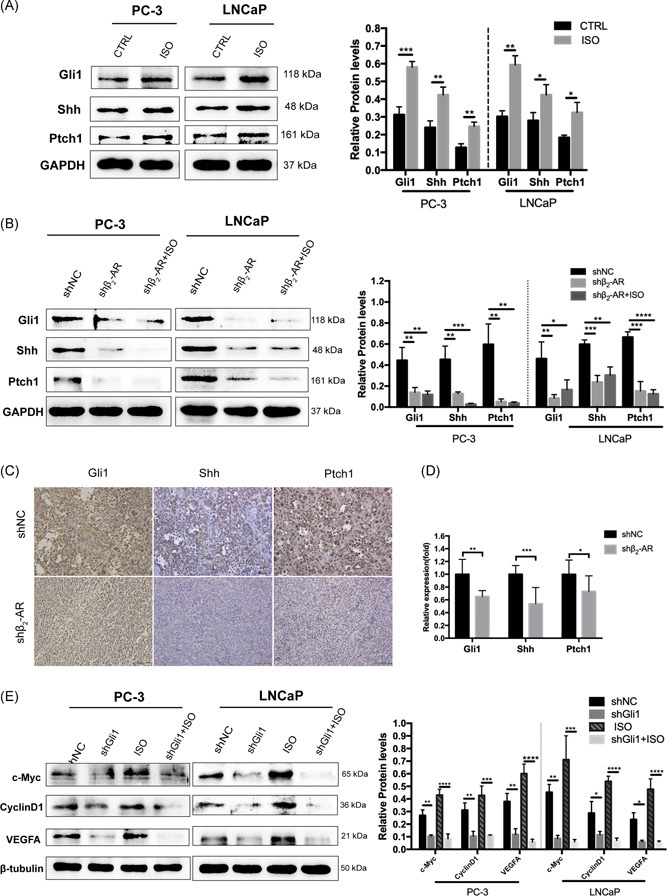
Stimulation of β2‐AR signaling promotes, whereas knockdown of β2‐AR suppresses, Shh‐Gli1 signaling activity in vivo and in vitro. A, Gli1, Shh and Ptch1 expression levels were detected by Western blotting and quantification of PC‐3 and LNCaP cells treated with DMSO or 1 μM ISO for 24 hours. B, Gli1, Shh, and Ptch1 expression levels were detected by Western blotting and quantification in PC‐3 and LNCaP cells transduced with a negative control shRNA (shNC) and shRNA targeting β2‐AR (shβ2‐AR) treated with DMSO or 1 μM ISO for 24 hours. C and D, Representative immunohistochemistry images and quantification of Gli1, Shh, and Ptch1 expression levels in xenografts. Scale bar, 100 μm. E, Western blotting assay of the expression of downstream genes of Shh signaling and quantification in PC‐3 and LNCaP cells stably expressing shNC or shGli1 following treatment with DMSO or 1 μM ISO for 24 hours. β2‐AR, β2‐adrenergic receptor; DMSO, dimethyl sulfoxide; ISO, isoproterenol; Ptch1, patched1; SD, standard deviation; shRNA, small hairpin RNA [Color figure can be viewed at wileyonlinelibrary.com]
Next, we examined the transcription of target genes of Shh signaling, including the oncoprotein transcription factor c‐Myc, the cell cycle regulator cyclin D1 and the angiogenic molecule VEGF, which have been documented as contributing to tumorigenesis. 13 As shown in Figure 5E, the expression levels of these target proteins were enhanced with the stimulation of ISO, which indicated that ISO indeed induced the activation of Shh signaling. However, in the shRNA‐based Gli1 knockdown cells (Figure 6E), ISO treatment failed to potentiate the expression of these proteins, indicating that the proteins downstream of β2‐AR signaling were activated through the Shh‐Gli1 pathway.
Taken together, these results suggested that β2‐AR has a critical role in the regulation of Shh‐Gli1 signaling activity.
4. DISCUSSION
Although a growing body of evidence suggests that β2‐AR may have a profound effect on PCa progression, the molecular mechanisms involved are unclear. In this study, we focused our investigation on the roles of β2‐AR in tumorigenesis and growth in PCa cells and a xenograft tumor model. Our in vitro pharmacological approaches using an agonist of β2‐AR revealed that the activation of β2‐AR potentiated the proliferation of PCa cells. Conversely, knockdown of β2‐AR delayed cell growth in vitro and in vivo. These effects were found to be mediated via the Shh‐Gli1 pathway, as blocking the Shh pathway pharmacologically or knocking down the expression of Gli1 sufficiently abolished the functional effect of ISO on cell proliferation and survival as well as the transcription of the target genes for proliferation of Shh signaling.
β2‐AR displays activation at different levels in the progression of PCa. Studies of castration mice and patients of PCa with androgen deprivation therapy have reported low β‐adrenergic activity and downregulation of β2‐AR mRNA, respectively. 29 , 30 However, in metastatic PCa, both high and low levels of β2‐AR have been reported. 10 , 29 Indeed, our data suggest that the regulation of β2‐AR in the normal prostatic tissues is altered away from homeostasis in the tumors but that the levels of β2‐AR expression are uncorrelated with the Gleason score. These findings may explain the existence of ambiguous levels in different stages of PCa. Still, more samples are needed to confirm this possibility.
Among the downstream effectors of β2‐AR signaling, PKA kinase has been known as a negative regulator of the Shh pathway. 31 Thus, in this study, we determined whether β2‐AR acts to oppose or enhance Shh signaling. In vitro pharmacological approaches using β2‐AR agonist and lentivirus transduction revealed that intriguingly, β2‐AR showed a positive regulation of the Shh pathway. This might due to the highly redundant network of signaling pathways in which β2‐AR is involved, 32 which might induce strong Shh signaling activity, counteracting the oppose effect of PKA. However, these findings await further investigation.
The Hh signaling pathway, especially Shh signaling, has been documented to be critical for tumor progression. In recent years, clinical trials investigating the benefit of Hh inhibitors in various types of cancers have been initiated; however, after long‐term Hh inhibition, acquired drug resistance has been observed in some tumor types. 13 Thus, more investigation is needed to gain more insight into the exact mechanisms behind the involvement of the Hh signaling pathway.
5. CONCLUSIONS
In this study, based on a xenograft model and cell assays, we uncovered an important role of β2‐AR signaling in regulating the Shh pathway activity in PCa tumorigenesis and provide further insight into the mechanism of the involvement of the Hh signaling pathway. Furthermore, given the efficacy of β2‐adrenergic modulation on PCa, our study might also add evidence for potential therapeutic options of β‐blockers 12 for PCa.
CONFLICT OF INTERESTS
The authors declare that there are no conflict of interests.
AUTHOR CONTRIBUTIONS
All authors had full access to the data and participated in the design, analysis, and interpretation of the data. MZ was responsible for developing the original idea and drafting the manuscript. QHW contributed to the development of the protocol. All of the authors reviewed and approved the manuscript before submission
ETHICS STATEMENT
All procedures performed in studies involving human tissues and animal experiments were with approval of the Ethics Committee of Chongqing Medical University. The experiments were carried out in strict accordance with the approved principles.
ACKNOWLEDGMENT
This study was funded by the National Natural Science Foundation of China (Number 81402282).
Zhang M, Wang Q, Sun X, et al. β2‐adrenergic receptor signaling drives prostate cancer progression by targeting the Sonic hedgehog‐Gli1 signaling activation. The Prostate. 2020;80:1328–1340. 10.1002/pros.24060
REFERENCES
- 1. Cole SW, Nagaraja AS, Lutgendorf SK, Green PA, Sood AK. Sympathetic nervous system regulation of the tumour microenvironment. Nat Rev Cancer. 2015;15:563‐572. [DOI] [PMC free article] [PubMed] [Google Scholar]
- 2. Magnon C, Hall SJ, Lin J, et al. Autonomic nerve development contributes to prostate cancer progression. Science. 2013;341:1236361. [DOI] [PubMed] [Google Scholar]
- 3. Nagmani R, Pasco DS, Salas RD, Feller DR. Evaluation of beta‐adrenergic receptor subtypes in the human prostate cancer cell line‐LNCaP. Biochem Pharmacol. 2003;65:1489‐1494. [DOI] [PubMed] [Google Scholar]
- 4. Penn RB, Frielle T, McCullough JR, Aberg G, Benovic JL. Comparison of R‐, S‐, and RS‐albuterol interaction with human beta 1‐ and beta 2‐adrenergic receptors. Clin Rev Allergy Immunol. 1996;14:37‐45. [DOI] [PubMed] [Google Scholar]
- 5. Sun X, Bao J, Nelson KC, Li KC, Kulik G, Zhou X. Systems modeling of anti‐apoptotic pathways in prostate cancer: psychological stress triggers a synergism pattern switch in drug combination therapy. PLoS Comput Biol. 2013;9:e1003358. [DOI] [PMC free article] [PubMed] [Google Scholar]
- 6. Sastry KS, Karpova Y, Prokopovich S, et al. Epinephrine protects cancer cells from apoptosis via activation of cAMP‐dependent protein kinase and BAD phosphorylation. J Biol Chem. 2007;282:14094‐14100. [DOI] [PubMed] [Google Scholar]
- 7. Park SY, Kang JH, Jeong KJ, et al. Norepinephrine induces VEGF expression and angiogenesis by a hypoxia‐inducible factor‐1α protein‐dependent mechanism. Int J Cancer. 2011;128:2306‐2316. [DOI] [PubMed] [Google Scholar]
- 8. Hulsurkar M, Li Z, Zhang Y, Li X, Zheng D, Li W. Beta‐adrenergic signaling promotes tumor angiogenesis and prostate cancer progression through HDAC2‐mediated suppression of thrombospondin‐1. Oncogene. 2017;36:1525‐1536. [DOI] [PubMed] [Google Scholar]
- 9. Cox ME, Deeble PD, Bissonette EA, Parsons SJ. Activated 3′,5′‐cyclic AMP‐dependent protein kinase is sufficient to induce neuroendocrine‐like differentiation of the LNCaP prostate tumor cell line. J Biol Chem. 2000;275:13812‐13818. [DOI] [PubMed] [Google Scholar]
- 10. Yu J, Cao Q, Mehra R, et al. Integrative genomics analysis reveals silencing of beta‐adrenergic signaling by polycomb in prostate cancer. Cancer Cell. 2007;12:419‐431. [DOI] [PubMed] [Google Scholar]
- 11. Perron L, Bairati I, Harel F, Meyer F. Antihypertensive drug use and the risk of prostate cancer (Canada). Cancer Causes Control. 2004;15:535‐541. [DOI] [PubMed] [Google Scholar]
- 12. Grytli HH, Fagerland MW, Fosså SD, Taskén KA. Association between use of β‐blockers and prostate cancer‐specific survival: a cohort study of 3561 prostate cancer patients with high‐risk or metastatic disease. Eur Urol. 2014;65:635‐641. [DOI] [PubMed] [Google Scholar]
- 13. Gonnissen A, Isebaert S, Haustermans K. Hedgehog signaling in prostate cancer and its therapeutic implication. Int J Mol Sci. 2013;14:13979‐14007. [DOI] [PMC free article] [PubMed] [Google Scholar]
- 14. Karhadkar SS, Bova GS, Abdallah N, et al. Hedgehog signalling in prostate regeneration, neoplasia and metastasis. Nature. 2004;431:707‐712. [DOI] [PubMed] [Google Scholar]
- 15. Bushman W. Hedgehog signaling in prostate development, regeneration and cancer. J Dev Biol. 2016;4:30. [DOI] [PMC free article] [PubMed] [Google Scholar]
- 16. Kim TJ, Lee JY, Hwang TK, Kang CS, Choi YJ. Hedgehog signaling protein expression and its association with prognostic parameters in prostate cancer: a retrospective study from the view point of new 2010 anatomic stage/prognostic groups. J Surg Oncol. 2011;104:472‐479. [DOI] [PubMed] [Google Scholar]
- 17. Stecca B, Altaba AR. Context‐dependent regulation of the GLI code in cancer by HEDGEHOG and non‐HEDGEHOG signals. J Mol Cell Biol. 2010;2:84‐95. [DOI] [PMC free article] [PubMed] [Google Scholar]
- 18. Sheng T, Li C, Zhang X, et al. Activation of the hedgehog pathway in advanced prostate cancer. Mol Cancer. 2004;3:29. [DOI] [PMC free article] [PubMed] [Google Scholar]
- 19. Lauth M, Toftgård R. Non‐canonical activation of GLI transcription factors: implications for targeted anti‐cancer therapy. Cell Cycle. 2007;6:2458‐2463. [DOI] [PubMed] [Google Scholar]
- 20. Cole SW, Sood AK. Molecular pathways: beta‐adrenergic signaling in cancer. Clin Cancer Res. 2012;18:1201‐1206. [DOI] [PMC free article] [PubMed] [Google Scholar]
- 21. Braadland PR, Ramberg H, Grytli HH, Taskén KA. β‐Adrenergic receptor signaling in prostate cancer. Front Oncol. 2015;4:375. [DOI] [PMC free article] [PubMed] [Google Scholar]
- 22. Waschek JA, James A. WASCHEK: EMANUEL DICICCO‐BLOOM, ARNAUD NICOT, and VINCENT LELIEVRE. Hedgehog signaling new targets for GPCRs coupled to cAMP and protein kinase A. Ann NY Acad Sci. 2006;1070:120‐128. [DOI] [PubMed] [Google Scholar]
- 23. Ujiie H, Kadota K, Nitadori JI, et al. The tumoral and stromal immune microenvironment in malignant pleural mesothelioma: a comprehensive analysis reveals prognostic immune markers. Oncoimmunology. 2015;4:e1009285. [DOI] [PMC free article] [PubMed] [Google Scholar]
- 24. Rodriguez‐Bravo V, Pippa R, Song W‐M, et al. Nuclear pores promote lethal prostate cancer by increasing POM121‐driven E2F1, MYC, and AR nuclear import. Cell. 2018;174:1200‐1215.e20. [DOI] [PMC free article] [PubMed] [Google Scholar]
- 25. Thomsen ARB, Plouffe B, Cahill TJ III, et al. GPCR‐G protein‐β‐arrestin super‐complex mediates sustained G protein signaling. Cell. 2016;166:907‐919. [DOI] [PMC free article] [PubMed] [Google Scholar]
- 26. Zhang PH, He XY, Tan JJ, Zhou XY, Zou L. β‐Arrestin2 mediates β‐2 adrenergic receptor signaling inducing prostate cancer cell progression. Oncol Rep. 2011;26(6):1471‐1477. [DOI] [PubMed] [Google Scholar]
- 27. Schneider RK, Mullally A, Dugourd A, et al. Gli1+ Mesenchymal stromal cells are a key driver of bone marrow fibrosis and an important cellular therapeutic target. Cell Stem Cell. 2017;20:785‐800.e8. [DOI] [PMC free article] [PubMed] [Google Scholar]
- 28. Zhang WC, Shyh‐Chang N, Yang H, et al. Glycine decarboxylase activity drives non‐small cell lung cancer tumor‐initiating cells and tumorigenesis. Cell. 2012;148:259‐272. [DOI] [PubMed] [Google Scholar]
- 29. Ramberg H, Eide T, Krobert KA, et al. Hormonal regulation of beta2‐adrenergic receptor level in prostate cancer. Prostate. 2008;68:1133‐1142. [DOI] [PubMed] [Google Scholar]
- 30. Zepp EA, Thomas JA. Effect of androgens on isoproterenol‐induced increases in mouse accessory sex organ cyclic AMP in vitro. Biochem Pharmacol. 1978;27:465‐468. [DOI] [PubMed] [Google Scholar]
- 31. Zhang B, Zhuang T, Lin Q, et al. Patched1‐ArhGAP36‐PKA‐Inversin axis determines the ciliary translocation of Smoothened for Sonic Hedgehog pathway activation. Proc Natl Acad Sci USA. 2019;116:874‐879. [DOI] [PMC free article] [PubMed] [Google Scholar]
- 32. Kulik G. ADRB2‐targeting therapies for prostate cancer. Cancers (Basel). 2019;11:E358. [DOI] [PMC free article] [PubMed] [Google Scholar]


