

Abstract
Phenotypic divergence among natural populations can be explained by natural selection or by neutral processes such as drift. Many examples in the literature compare putatively neutral (F ST) and quantitative genetic (Q ST) differentiation in multiple populations to assess their evolutionary signature and identify candidate traits involved with local adaptation. Investigating these signatures in closely related or recently diversified species has the potential to shed light on the divergence processes acting at the interspecific level. Here, we conducted this comparison in two subspecies of snapdragon plants (eight populations of Antirrhinum majus pseudomajus and five populations of A. m. striatum) in a common garden experiment. We also tested whether altitude was involved with population phenotypic divergence. Our results identified candidate phenological and morphological traits involved with local adaptation. Most of these traits were identified in one subspecies but not the other. Phenotypic divergence increased with altitude for a few biomass‐related traits, but only in A. m. striatum. These traits therefore potentially reflect A. m. striatum adaptation to altitude. Our findings imply that adaptive processes potentially differ at the scale of A. majus subspecies.
Keywords: altitudinal gradient, Antirrhinum majus, local adaptation, quantitative genetics, subspecies divergence
1. INTRODUCTION
Local adaptation ‐ the evolutionary response to selection that makes populations fitter in their own local habitat than in other populations' local habitats ‐ is widespread in both plant and animal species (Halbritter et al., 2018; Kawecki & Ebert, 2004; Leinonen, McCairns, O'Hara, & Merilä, 2013). There is evidence for its role in the adaptive divergence of plant species (Halbritter et al., 2018; Hereford, 2009; Leimu & Fischer, 2008). For example, empirical studies have demonstrated differential adaptation in plant sister or hybridizing species, for instance between pairs of Silene (Favre, Widmer, & Karrenberg, 2017), Senecio (Abbott & Brennan, 2014), and Mimulus (Angert & Schemske, 2005) species. These studies compared local adaptation for sister species confronted with different ecological requirements; moister and more fertile versus drier and disturbed sites for Silene species (Favre et al., 2017), at high versus low altitude for Senecio species (Abbott & Brennan, 2014) and Mimulus species (Angert & Schemske, 2005). Different species may also respond similarly to the same type of environmental gradient. Recently, Halbritter et al. (2018) combined the information from studies of multiple plant species along elevation gradients. They found significant evidence for adaptation to different elevations in terms of survival and biomass, with a lower survival at foreign elevations, and a clear trend towards smaller plants at higher elevation. Their results also showed variation across‐ and within‐species in plant responses to elevation. For example, in Capsella bursa‐pastoris, native plants from higher elevation flowered at different times, both earlier and later, than plants from lower elevation (Neuffer & Hurka, 1986). The study of local adaptation in populations of closely related taxa exposed to environmental gradients, e.g., altitude, is an opportunity to investigate the conditions promoting or impeding the consistency of adaptive responses.
An indirect approach to investigate whether local adaptation might potentially be involved in the phenotypic divergence of populations is the Q ST–F ST comparison (McKay & Latta, 2002; Merilä & Crnokrak, 2001; Spitze, 1993). The comparison of population genetic differentiation estimated for putatively neutral molecular markers with the population quantitative genetic differentiation estimated for phenotypic traits can be used to identify candidate traits playing a role in local adaptation (Whitlock, 2008). This is done by estimating whether trait quantitative genetic differentiation among populations is more likely the result of divergent selection (Q ST > F ST), stabilizing selection (Q ST < F ST), or neutral evolutionary divergence (Q ST = F ST, e.g., as a result of drift). Some debate around the accuracy of Q ST–F ST comparisons resulted in a variety of methodological adjustments (Edelaar, Burraco, & Gomez‐Mestre, 2011; Ovaskainen, Karhunen, Zheng, Arias, & Merilä, 2011; Whitlock, 2008; Whitlock & Gilbert, 2012). In plants, reciprocal transplants directly comparing fitness between native and non‐native habitats are often preferred to Q ST–F ST approaches conducted in common gardens because they evaluate the effect of environmental conditions (Angert & Schemske, 2005; Etterson, 2004; Kim & Donohue, 2013). When reciprocal transplant experiments cannot be easily undertaken, Q ST–F ST comparisons represent an opportunity for exploring local adaptation hypotheses.
Here, we investigate patterns of local adaptation in two closely related plant subspecies of Snapdragon (Antirrhinum majus L., Plantaginaceae) by using Q ST–F ST comparisons estimated in a common garden experiment, and evaluate whether altitudinal gradients might play a role in the potential adaptive divergence of populations. We studied eight populations of magenta‐flowered A. m. pseudomajus and five populations of yellow‐flowered A. m. striatum sampled along altitudinal gradients. These two subspecies are interfertile (Andalo et al., 2010). They are distributed parapatrically, with the geographic range of A. m. striatum surrounded by the range of A. m. pseudomajus, and come frequently into contact at the margins of their ranges where there is evidence for gene exchange (Khimoun et al., 2011; Ringbauer, Kolesnikov, Field, & Barton, 2018). Their geographic separation is not explained by actual climatic differences, as illustrated by the substantial overlap of environmental conditions between the two subspecies (Khimoun et al., 2013). This system is therefore promising to explore potential differential adaptive responses of closely related subspecies, in particular regarding the role played by altitude in adaptive divergence.
There is poor support in the literature for adaptive changes in reproductive traits along altitudinal gradients (Halbritter et al., 2018). In contrast, adaptive differentiation is expected for biomass‐related traits and height, with a trend toward smaller plants at high altitude compared to plants at lowland sites (Halbritter et al., 2018). We tested this hypothesis for four morphological traits (basal stem diameter, number of branches on the plant, number of vegetative nodes on the main stem, and total height of the plant). We also studied three additional traits: a phenological trait (germination date), a developmental trait (average internode length) and a functional trait (specific leaf area, SLA). We expected populations from higher altitudes to germinate later and over a shorter period (Donohue, Rubio de Casas, Burghardt, Kovach, & Willis, 2010; Gimenez‐Benavides, Escudero, & Iriondo, 2006). This is because such germination allows plants to track the late arrival and the shorter‐term availability of suitable climatic conditions for growth at higher altitudes (Körner, 1999). Because internode length is a trait related to both plant height and growth rates, we had no clear expectation for how this trait might respond to altitude. Finally, SLA relates to leaf construction cost and captures information about leaf economic strategies (Wright et al., 2004); low SLA suggests high leaf construction cost and high stress tolerance. Selective pressures associated with lower temperatures at higher elevations are expected to promote leaf trait syndromes associated with superior stress tolerance but inferior competitiveness (Read, Moorhead, Swenson, Bailey, & Sanders, 2014). These relationships are generally stronger among species than among populations of the same species (Read et al., 2014). Therefore, we expected either no correlation or a negative correlation between SLA and elevation among populations.
In our study, we estimated neutral genetic differentiation (F ST), and quantitative genetic differentiation (Q ST) based on the partition of trait genetic variance and trait heritability (h 2) in A. majus. Previous studies of genetic differentiation between populations and subspecies of A. majus at putatively neutral microsatellite markers showed that gene flow was limited between populations (Debout, Lhuillier, Malé, Pujol, & Thébaud, 2012; Pujol et al., 2017), thus favouring adaptive divergence. We tested whether traits were potentially involved with local adaptation by comparing Q ST and F ST, and we investigated whether quantitative genetic differentiation increased with altitudinal difference, and the possibility that environmental changes associated with altitude, which include a suite of climatic variables, drove adaptive responses.
2. MATERIALS AND METHODS
2.1. Study system
Antirrhinum majus L. (Plantaginaceae) is a hermaphroditic, self‐incompatible, short‐lived perennial species, characterized by a patchy distribution in southern Europe centred over the Pyrenees Mountains (Khimoun et al., 2011). It occurs from sea level to an altitude of 1,900 m (Andalo et al., 2010), on limestone or siliceous substrates and in habitats with contrasting moisture regimes (rainfall 500–1,000 mm per year), where it forms restricted stands mostly on rocky outcrops and screes. The species thrives in disturbed habitats, and is especially common along roadsides and railway embankments (Khimoun et al., 2011).
2.2. Subspecies of A. majus
The two interfertile subspecies of A. majus, A. m. pseudomajus and A. m. striatum produce magenta and yellow zygomorphic flowers, respectively (Andalo et al., 2010). For putative neutral microsatellite loci, they show ca. 1% genetic differentiation (estimated via F ST), which is one order of magnitude lower than the ca. 10% differentiation found among populations within subspecies (Pujol et al., 2017). There is evidence for gene exchange between subspecies in multiple populations across contact zones (Khimoun et al., 2011). Genome scans across a particular contact zone in the Pyrenees revealed little to negligible differentiation between the two subspecies, with the exception of loci underlying flower colour differences, which were characterized by high differentiation (Tavares et al., 2018; Whibley, 2006). Frequency dependent selection exerted by pollinators on the basis of flower colour is acknowledged to maintain the two subspecies as separate entities (Tastard, Ferdy, Burrus, Thébaud, & Andalo, 2012). The different geographic distributions of A. m. pseudomajus and A. m. striatum are not explained by habitat differences, as illustrated by the substantial overlap of environmental conditions between the two species (Khimoun et al., 2013).
2.3. Collection sites and plant material
Thirteen wild populations of A. majus were sampled in 2011 across its geographic range (between north‐eastern Spain and south‐western France) to represent the overall diversity of the species, with eight populations of A. m. pseudomajus and five populations of A. m. striatum included (Figure 1; Table S1). For each subspecies, we sampled populations from low and high altitude habitats in different parts of the species geographic range. The variance in altitude was not significantly different between subspecies (see Supporting Information) and should not drive potential differences between taxa. Populations sampled along elevation gradients are likely to be confronted with contrasting environmental conditions. Fifty‐year averages (1950–2000) of mean annual temperature and annual average rainfall were extracted from the WorldClim database (resolution 1 km2, www.worldclim.org, Hijmans, Cameron, Parra, Jones, & Jarvis, 2005). They ranged from 14.8°C and 52 mm (at BAN, 61 m above sea level) to 6.1°C and 94 mm (at MON, 1,564 m above sea level; Figure S1). The sampling of populations in different valleys or on different summits limits spatial autocorrelation in the data and shared phylogeographic history between populations from similar altitudes. Thus, populations with similar elevation are not geographically closer.
FIGURE 1.

Map of Antirrhinum majus populations. A. majus populations were sampled across the geographic range of the species in Southern France. Red dots represent A. m. pseudomajus populations, yellow dots represent A. m striatum populations. Population names and description can be found in Table S1 [Colour figure can be viewed at wileyonlinelibrary.com]
From each wild population, seeds were randomly collected in October 2011 and used to grow plants in 2012, in a greenhouse at the CNRS Experimental Ecology Station in Moulis, France. Seeds were sown in spring in individual pots (9 × 9 × 10 cm) filled with universal compost. Plants germinated and grew with no nutrient addition under an average temperature from 15°C to 28°C and weekly watering. Mature plants were hand‐pollinated during the summer 2012 to produce progeny from crosses within populations where mates from different families were assigned randomly. Seed of full sib families produced from these plants was stored at room temperature, in the dark, under dry conditions until they were used to produce the plants measured in our experiment. This intermediate generation of plants grown under controlled conditions allowed us to reduce potential maternal environmental effects that could have otherwise affected plants grown from seeds sampled in the wild.
2.4. Common garden experiment
Nine to 42 seed families from each of the 13 study populations were grown outdoors in spring 2014 in a common garden at ENSFEA (Toulouse, France). Two plants per family were grown. Some plants died before measurements were made, which resulted in some families being represented by only one plant (Table S1). Plants were grown in individual pots (9 × 9 × 10 cm) filled with universal compost, with no nutrient addition, under outdoor climatic conditions (average month temperatures ranging from 20.6°C to 21.5°C and cumulative monthly rainfall ranging from 28.3 to 73.4 mm). Plants were arranged in a randomized block design (40 plastic containers, 600 × 400 × 120 mm) with each container including 24 randomly chosen plants. Containers of this size were chosen because they optimized the spatial arrangement of pots and the rotation of container locations. Such randomized block design is not expected to inflate artificially differences between populations and families because plants from different populations and families were randomly distributed across several containers. A potential block effect on groups of plants within containers was controlled for at the statistical level. The bottom of each container was covered with an irrigation sheet (400 g.m−2) that allowed regulation of the moisture content of the compost. Plants were supplied with water in case of prolonged drought. Damage caused by herbivorous insects was contained by using a wintering veil. This veil also limited pollination.
2.5. Phenotypic data
We investigated several vegetative traits on each individual: a phenological trait, a functional trait, a developmental trait, and four morphological traits. The functional trait (SLA) was calculated as the ratio between the cumulated area of five mature but nonsenescent fresh leaves and their oven‐dried mass (Pérez‐Harguindeguy et al., 2016; Pujol, Salager, Beltran, Bousquet, & McKey, 2008). Leaf area was measured by using the R package Momocs v. 1.2.9 (Bonhomme, Picq, Gaucherel, & Claude, 2014). Flower‐related traits were measured but they were not included in this study. This is because not enough statistical power was available to analyse them within subspecies, as less data was available for these traits (not all plants that grew flowered).
2.6. Molecular analyses
To infer genetic diversity estimates in each population and to compute F ST, we genotyped the 637 plants that germinated. DNA was extracted from silica gel dried leaf samples using the Biosprint 15 DNA Plant kit (Qiagen) following the manufacturer's instructions. Individuals were genotyped for 23 putatively neutral microsatellite markers that were developed for population genetic studies (Debout et al., 2012; Pujol et al., 2017). To compute F ST, we used population pairwise F ST estimates and the overall F ST estimate amongst populations from the study by Pujol et al. (2017). We used the GenoDive 3.0 software (Meirmans & Van Tienderen, 2004) to compute the complementary parameters required for this study, e.g., the genetic diversity at each locus.
2.7. Statistical analysis
All statistical analyses were performed using the R.3.5.0 software (R Core Team, 2018).
2.7.1. Phenotypic traits
First, to test for phenotypic differences between subspecies, hierarchical generalized linear models were conducted with population nested in subspecies. Second, for each subspecies, linear mixed models were conducted to test for phenotypic differences among populations, with population as a fixed effect and the plastic container (“block”) as a random effect. Estimates of marginal means for each trait in each population were extracted using the emmeans package (Lenth, Singmann, Love, Buerkner, & Herve, 2019). These linear mixed‐effects models were implemented in R via the lme4 package (Bates, Mächler, Bolker, & Walker, 2015). Trait changes with altitude were analysed using a linear regression of the marginal means by altitude. Finally, the means for each phenotypic trait were also generated, and provided in the Supporting Information (Figure S1).
2.7.2. Calculation of h 2 and phenotypic differentiation indices (Q ST)
For each subspecies, narrow‐sense heritabilities (h 2) were estimated for each phenotypic trait across all populations using a model with population, family and plastic containers as random factors as h 2 = 2V w/(V w + V res), where V w is the family variance component and V res is the residual variance component corresponding to the within‐population variance component. We multiplied V w by two in the calculation of h 2 because we used a full‐sib crossing design (Roff, 1997). Caution must be taken when using this type of h 2 estimates. Estimates based on full‐sib designs can be less precise than estimates calculated on the basis of a full pedigree. We maximised the precision of our h 2 estimates by calculating h 2 based on all the families, without considering the differences of h 2 between different populations. We also calculated confidence intervals of h 2 by using a parametric bootstrap method adapted from O'Hara and Merilä (2005).
For each trait and each subspecies, quantitative trait divergence indices (Q ST) were generated among populations (overall Q ST) and for each population pair (population pairwise Q ST) based on mixed model analyses. In these models, population, family and plastic containers were random factors. Variance components were extracted from these analyses for each trait and used for estimating Q ST using the following formula (Spitze, 1993): Q ST = V b/(V b + 2h 2 (V w + V res)) with Vb being the trait genetic variance among populations. h 2 was calculated based on all the families and populations by subspecies. Here, no environmental sources of phenotypic variance due to the ecological conditions of the location of origin of populations could in theory bias Q ST estimates because data were obtained from a common garden experiment (Pujol, Wilson, Ross, & Pannell, 2008). When a variance component was nonsignificant, it was considered as null in further calculations. When necessary (as for population pairwise Q ST calculation), data were normalized by using a square root transformation. All variance components were estimated by using the linear mixed model approach implemented in the R package lme4 v. 1.1.17 (Bates et al., 2015). Confidence intervals of Q ST values were calculated following a parametric bootstrap method adapted from O'Hara and Merilä (2005).
2.7.3. Overall Q ST–F ST comparisons
We compared overall Q ST and F ST for each trait to investigate if divergence was compatible with a scenario of genetic drift (overall Q ST = F ST), or whether it was more probably explained by directional selection (overall Q ST > F ST) or by stabilizing selection (overall Q ST < F ST). Comparisons between overall Q ST and F ST values were performed for each trait based on two methods: (a) a comparison of confidence intervals (CIs), the Q ST is considered nonsignificantly different from neutral differentiation when the CI of the overall Q ST for a trait overlaps the mean F ST value; and (b) a bootstrapping method developed by Whitlock and Guillaume (2009). This latter approach aims at comparing the observed difference between the overall Q ST and the F ST with the expected simulated distribution of this difference under a scenario of neutral evolution. We generated 100,000 bootstrap replicates of the expected Q ST–F ST difference under the neutrality hypothesis for each trait, and built the corresponding distribution. In this approach, p‐values were estimated by assessing whether the observed value of the Q ST–F ST difference overlapped its expected distribution under neutrality. We used the modification by Lind, Ingvarsson, Johansson, Hall, and Johansson (2011) of the approach of Whitlock and Guillaume (2009) to estimate the variance components of the simulated values of the Q ST–F ST difference.
2.7.4. Mantel tests
Mantel tests (Mantel, 1967) were used to analyse correlations between geographic distances, environmental distances (altitudinal), neutral genetic differentiation (population pairwise F ST), and quantitative genetic differentiation (population pairwise Q ST). They were run separately for each subspecies. First, a correlation test between population pairwise F ST and population pairwise geographic distance matrices was performed to test for an isolation by distance relationship. Second, a correlation test between population pairwise F ST and population pairwise Q ST was performed for each trait to test if neutral genetic differentiation explained divergence in quantitative traits. Third, a correlation test between population pairwise Q ST and population pairwise altitudinal differences was performed for each trait to test whether divergence in quantitative traits was related to altitudinal differences. Finally, we conducted partial Mantel tests to test for the association between population pairwise Q ST and population pairwise altitude differences, while controlling for neutral genetic differentiation (F ST). All Mantel and partial Mantel tests were performed in R, with a significance threshold α = 0.05, using the vegan package (Oksanen et al., 2009).
3. RESULTS
3.1. Phenotypic differentiation between subspecies and populations
The two subspecies ‐ A. m. pseudomajus and A. m. striatum ‐ showed significant differences for several phenotypic traits (Table 1a; Figure S2). When grown in a common garden, plants of A. m. pseudomajus were on average taller, with more branches and nodes than plants of A. m striatum. However, both subspecies germinated on average at the same time, and showed similar internode length and SLA. Phenotypic differentiation between subspecies (ca. 1.9%) was lower than among populations (ca. 13.7%, see mean R 2 in Table 1a). For each subspecies, most traits showed phenotypic divergence among populations (see LRT in Table 1b). Germination date was the only trait that showed no significant difference among populations of A. m. pseudomajus (see LRT in Table 1b).
TABLE 1.
Effects of subspecies and populations on phenotypic traits. (a) R 2 and p‐value from hierarchical generalized linear models (GLM) with subspecies alone and populations nested in subspecies. (b) Likelihood ratio tests (LRT) comparing the maximum‐likelihood fit between a model where populations were pooled and a model estimating the effect of the population of origin. A significant p‐value means the model including populations effect fitted the data better than the null model. Significant results (p < .05) are in bold
| (a) | Subspecies | Populations in subspecies | ||
|---|---|---|---|---|
| R 2 | p‐value | R 2 | p‐value | |
| Germination date | .0005 | .968 | .02 | .260 |
| Diameter | .003 | .1719 | .05 | .00068 |
| Nodes | .045 | <.0001 | .19 | <.0001 |
| Branches | .032 | <.0001 | .10 | .00001 |
| Plant height | .041 | <.0001 | .26 | <.0001 |
| Internode length | .003 | .285 | .20 | 0 |
| SLA | .010 | .052 | .137 | .0003 |
| Mean | .019 | .137 | ||
| (b) | A. m. pseudmomajus | A. m. striatum | ||
|---|---|---|---|---|
| LRT | p‐value | LRT | p‐value | |
| Germination date | 6 | .570 | 12 | .021 |
| Diameter | 17 | .001 | 23 | <.0001 |
| Nodes | 73 | <.0001 | 27 | <.0001 |
| Branches | 30 | <.0001 | 19 | <.0001 |
| Plant height | 32 | <.0001 | 81 | <.0001 |
| Internode length | 61 | <.0001 | 24 | <.0001 |
| SLA | 29 | .004 | 28 | .004 |
3.2. Neutral genetic differentiation
Population neutral genetic differentiation was low but significant. Overall F ST among populations of A. m. pseudomajus was 0.109 (p < .001), and ranged from 0.06 to 0.159 across population pairs (see Table S2, and see Pujol et al., 2017 for more details on population pairwise neutral genetic differentiation). F ST among populations of A. m. striatum was 0.097 (p < .001), and ranged from 0.055 to 0.131 (Table S2). There was no significant relationship between population pairwise F ST and population pairwise geographic distance, or between population pairwise F ST/(1−F ST) and the log of population pairwise geographic distance for either subspecies (Figure 2a,b, F ST vs. distance: A. m. pseudomajus Mantel r = .018, p = .457, A. m. striatum Mantel r = −.15, p = .625, F ST/(1−F ST) vs. log distance: A. m. pseudomajus Mantel r = .04, p = .405, A. m. striatum Mantel r = −.18, p = .595). Similarly, there was no significant relationship between population pairwise F ST and population pairwise altitude difference for either subspecies (Figure 2c), although Mantel tests showed a relationship close to significance levels in A. m. pseudomajus (A. m. pseudomajus Mantel r = .23, p = .052, A. m. striatum Mantel r = −.3, p = .943).
FIGURE 2.
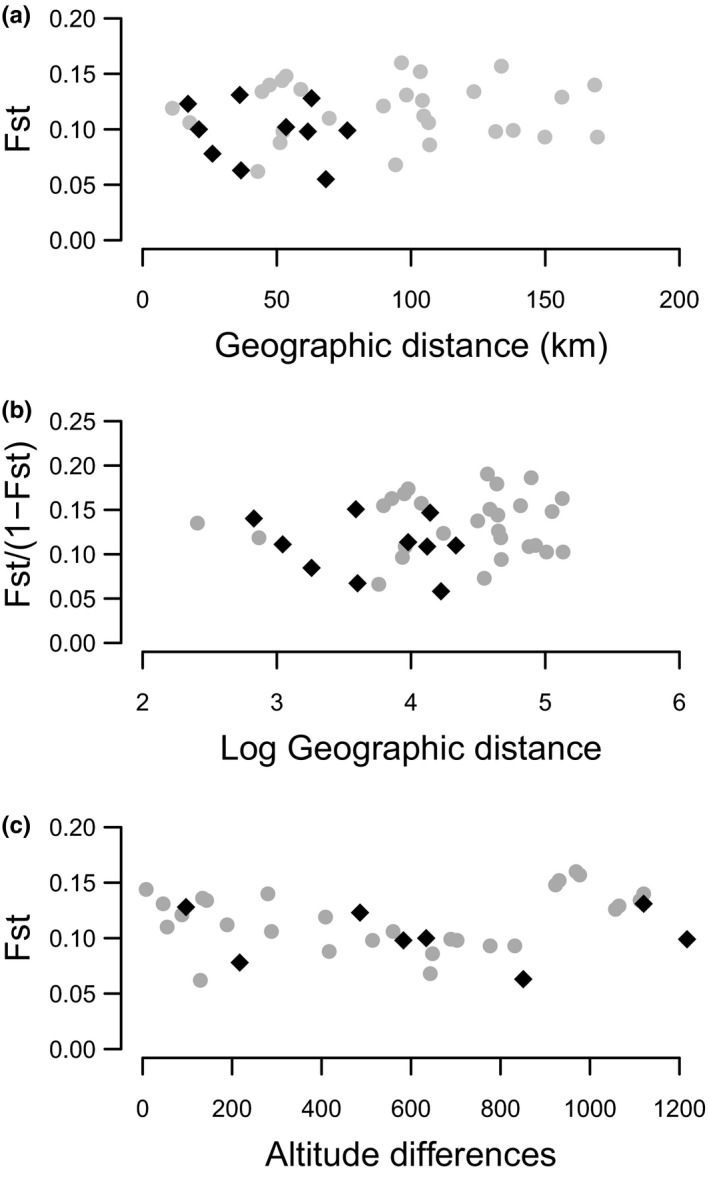
Pairwise neutral genetic differentiation F ST plotted against pairwise geographic distances or altitudinal differences. Pairwise F ST was estimated among eight Antirrhinum majus pseudomajus populations pairs (grey dots), and five A. m. striatum populations pairs (black diamonds). There were nonsignificant relationship between (a) F ST and geographic distance in A. m. pseudomajus (Mantel r = .018, p = .46 ns) and in A. m striatum (Mantel r = −.15, p = .63 ns); (b) F ST/(1−F ST) and the log of geographic distance in A. m. pseudomajus (Mantel r = .04, p = .41 ns) and in A. m striatum (Mantel r = −.18, p = .6 ns); and (c) F ST and altitude differences in A. m. pseudomajus (Mantel r = .23, p = .05 ns) and in A. m striatum (Mantel r = −0.3, p = .94 ns) [Colour figure can be viewed at wileyonlinelibrary.com]
3.3. Changes in phenotypic traits with altitude
We found significant correlations between trait values (i.e., population estimates of marginal means) and altitude for two traits across A. m. striatum populations. Plants from populations at low altitude had more nodes and branches than plants from populations at high altitude for A. m. striatum (Figure 3, see population arithmetic means in Figure S2 and population estimates of marginal means for other traits in Figure S3). No phenotypic changes associated with altitude were significant in A. m. pseudomajus.
FIGURE 3.

Trait changes with altitude. Population estimates of marginal means with standard errors of two phenotypic traits ((a) number of nodes, (b) number of branches) in populations of two subspecies of Antirrhinum majus grown in a common garden. Means are plotted against altitude of origin. Lines refer to the linear regression between trait mean estimates and altitude. Grey dots represent A. m. pseudomajus populations, black diamonds represent A. m. striatum populations. Equation of nonsignificant linear regressions were (a) y = 0.00125 x + 12 (p = .43 ns); and (b) y = −0.00048 x + 18 (p = .78 ns) for A. m. pseudomajus [Colour figure can be viewed at wileyonlinelibrary.com]
3.4. Inheritance of quantitative traits
Heritability estimates ranged between 0.11 and 0.83 for A. m. pseudomajus, and 0.01 and 0.89 for A. m. striatum (Table S3). Highest heritability estimates were for internode length in A. m. pseudomajus (0.83) and SLA in A. m. striatum (0.89). Several traits had similar heritabilities in each subspecies (stem diameter, number of nodes, internode length), as illustrated by their overlapping confidence intervals (CIs). However, this was not the case for other traits, i.e., there was no CI overlap (germination date, number of branches, plant height, SLA, Table S3).
3.5. Q ST–F ST comparisons
Overall Q ST was not different from mean F ST for A. m. pseudomajus traits (Figure 4a). In contrast, overall Q ST was higher than mean F ST for three traits in A. m. striatum as illustrated by their nonoverlapping CIs (number of branches, plant height and internode length, Figure 4b). Overall Q ST was lower than mean F ST for germination date in A. m. pseudomajus (Figure 4a). These results are fully consistent with results obtained via the bootstrapping method developed by Whitlock and Guillaume (2009). For one trait in A. m. pseudomajus (germination date), and for three traits in A.m. striatum (number of branches, plant height and internode length), observed values of overall Q ST–F ST differences were either in the tail of the expected probability distribution under the hypothesis of neutrality, or did not overlap with this distribution (Figure S4 and S5).
FIGURE 4.

Overall Q ST estimates with their 95% CI. Overall Q ST estimates with their 95% CI are represented for seven phenotypic traits in eight Antirrhinum majus pseudomajus populations (grey dots) and five A. m. striatum populations (black diamonds) that were grown in a common garden. Average population F ST is represented by the dashed grey line for A. m. pseudomajus, and the dashed black line for A. m. striatum. Branches, number of branches; Diameter, stem diameter; Germ.date, germination date; Height, plant height; Inter. Length, internodes length; Nodes, number of nodes; SLA, specific leaf area [Colour figure can be viewed at wileyonlinelibrary.com]
In the present study, the average difference between overall Q ST–F ST estimates was around 0.15, which is consistent with values found in the literature (around 0.12, see meta‐analysis from Leinonen, O'Hara, Cano, & Merilä, 2008). Yet, this difference reached 0.7 for the traits that we considered significant (traits with nonoverlapping Q ST and F ST CIs). This suggests that only traits with very high Q ST values could be tested significant for the Q ST–F ST difference in our study because the confident intervals were very large for most overall Q ST estimates (Figure 4). This might be caused by lack of statistical power. This lack of statistical power might induce conservative results, with possible false negative overall Q ST–F ST differences.
Mantel tests showed no relationship between population pairwise Q ST and F ST for most traits (Table 2). Only population pairwise Q ST for germination date in A. m. striatum was significantly correlated with population pairwise F ST.
TABLE 2.
Mantel tests and partial Mantel tests on pairwise Q ST versus F ST and Q ST versus difference in altitude of origin (Alt. diff.), as well as partial Mantel tests on Q ST versus Alt. diff. controlled for F ST, for phenology traits in (a) eight populations of A. m. pseudomajus; and (b) five populations of A. m. striatum, that were grown in a common garden. Significant values are indicated in bold
| Traits | Q ST versus F ST | Q ST versus Alt. diff. | Q ST versus Alt. diff./F ST | |||||||
|---|---|---|---|---|---|---|---|---|---|---|
| Mantel r | p‐value | Mantel r | p‐value | Mantel r | p‐value | |||||
| (a) A majus pseudomajus | ||||||||||
| Germination date | −.37 | .937 | −.13 | .745 | −.06 | .602 | ||||
| Diameter | −.07 | .618 | −.19 | .933 | −.18 | .780 | ||||
| Nodes | .07 | .464 | −.14 | .795 | −.16 | .888 | ||||
| Branches | .11 | .279 | −.13 | .713 | −.16 | .820 | ||||
| Height | .24 | .187 | −.15 | .831 | −.21 | .911 | ||||
| Internode length | .20 | .250 | .05 | .311 | −.01 | .442 | ||||
| SLA | .20 | .246 | .02 | .379 | −.04 | .529 | ||||
| (b) A majus striatum | ||||||||||
| Germination date | .54 | .042 | .05 | .333 | .27 | .233 | ||||
| Diameter | .08 | .366 | −.09 | .583 | −.07 | .566 | ||||
| Nodes | −.3 | .825 | .93 | .016 | .92 | .025 | ||||
| Branches | −.23 | .758 | .91 | .025 | .91 | .058 | ||||
| Height | −.61 | .891 | .09 | .317 | −.13 | .6 | ||||
| Internode length | .36 | .241 | −.14 | .667 | −.04 | .258 | ||||
| SLA | −.74 | .950 | .12 | .300 | −.17 | .858 | ||||
3.6. Increased quantitative genetic differentiation with altitude difference
Mantel tests showed a significant correlation between population pairwise Q ST and population pairwise altitudinal differences for two traits in A. m. striatum: the number of nodes and the number of branches (Table 2, Figure 5). For both traits, the increase in pairwise population differentiation associated with an increase in altitudinal difference was higher for the Q ST than for the F ST (Figure 5c,e). Partial mantel tests showed that population pairwise Q ST was significantly correlated with differences in altitude for number of nodes (and marginally significant for number of branches, see Q ST vs. Alt. diff./F ST in Table 2) while controlling for neutral genetic differentiation (F ST). This result is expected under the hypothesis that the divergence among populations of A. m. striatum in the number of nodes is a result of altitude‐mediated divergent selection. In contrast, none of the seven traits showed a significant correlation between population pairwise Q ST and population pairwise altitude difference in A. m. pseudomajus.
FIGURE 5.

Illustration of the relationship between population pairwise Q ST, F ST and altitudinal differences. Population pairwise quantitative trait differentiation (Q ST) for the germination date, the number of branches and the number of nodes in Antirrhinum majus striatum (a, c and e, black diamonds) and A. m. pseudomajus (b, d and f, black dots). Black lines are only indicative. They represent the informal linear relationship of population pairwise Q ST on population pairwise altitudinal differences (m), thereby illustrating the statistical dependency formally tested by Mantel test approaches. Grey dots and dashed line refer to population neutral genetic differentiation (F ST) [Colour figure can be viewed at wileyonlinelibrary.com]
4. DISCUSSION
Our results support the hypothesis of differential adaptation between A. m. pseudomajus and A. m. striatum subspecies. We detected phenotypic differentiation in a common garden among populations of A. m pseudomajus, among populations of A. m striatum, and among subspecies. For both subspecies, local adaptation and neutral evolution explained the extent to which populations diverged over their geographic range, with slight differences between subspecies. Signatures of potential selection were found for few traits. Potential divergence along altitude was also detected, but only for one subspecies: A. m. striatum.
Our findings support the idea that Q ST–F ST comparisons are a good first step for exploring the potential roles of divergent natural selection and neutral evolutionary processes in phenotypic divergence (Edelaar et al., 2011; Ovaskainen et al., 2011; Whitlock, 2008; Whitlock & Gilbert, 2012). They highlighted how traits can be used to identify the potential ecological pressures underlying natural selection, with some traits potentially involved with A. majus adaptation to the conditions of populations' local sites of origin, and a subsample of these traits potentially playing a role in A. m. striatum adaptation to altitude.
4.1. Adaptive evolution of A. m. striatum populations along the altitudinal gradient
Our results imply that the quantitative genetic basis of two of the seven traits studied (number of nodes, and the marginally significant number of branches) was shaped by divergent selection between populations from different altitudes in A. m. striatum but not in A. m. pseudomajus. Most studies on plant adaptation to altitude report the selection of smaller plants at higher altitudes (Halbritter et al., 2018; Körner, 1999). In agreement with this expectation, we found that A. m. striatum plants at higher altitudes had fewer branches and fewer nodes. It is important to note that branches can only grow from axillary buds located between leaf and stem at the level of nodes. These two developmentally correlated traits can reflect the same growth measurement. Their lack of independence is therefore not surprising. Although evidence for changes in leaf traits with elevation can be found in the literature (Halbritter et al., 2018; Read et al., 2014), our results did not support a potential scenario of selection based on SLA in A. m. striatum.
4.2. Support for different subspecies scenarios of adaptation to local sites of origin
Our results showed that quantitative genetic differentiation was higher than what could be explained by neutral evolutionary divergence among A. m. striatum populations for three of the seven traits (number of branches, plant height and internode length). They imply that adaptation to local sites of origin potentially shaped the phenotypic diversity of populations for A. m. striatum across their geographic range. We used classical overall Q ST–F ST comparisons to detect potential adaptation to local sites conditions (reviewed in Leinonen et al., 2013) and also more recent methods to insure that our findings were robust against a range of neutral evolution scenarios for these traits (Whitlock, 2008). Furthermore, our approach minimized the possibility that phenotypic differences between populations were generated by environmental effects by using a common garden experiment, and including trait heritability estimates in Q ST calculations (Pujol, Salager, et al., 2008; Pujol, Wilson, et al., 2008; Spitze, 1993). In contrast, four of the seven studied traits (germination date, diameter, number of nodes and SLA) did not show departure from plausible baseline scenarios of neutral evolutionary divergence when using overall Q ST–F ST comparisons. One particular trait (germination date) was in fact more similar among populations than expected under neutrality in A. m. pseudomajus. A scenario of stabilizing selection is classically extrapolated in the case of similar results (Lamy, Plomion, Kremer, & Delzon, 2012) but another plausible explanation is that population similarity might have been caused by convergent phenotypic responses to the common garden environmental similarity. Here we found different patterns between subspecies, which supports the hypothesis of their potential adaptive divergence. Caution must nevertheless be exercised when interpreting different Q ST–F ST patterns between subspecies as the signature of different adaptive processes. Our results cannot be interpreted as direct proof, but only as evidence that potentially favours this hypothesis.
4.3. The ecological significance of adaptation to local sites of origin in A. majus
In the absence of environmental measures included in the overall Q ST–F ST analysis, it is impossible to identify the environmental agents of local selection that shape the quantitative genetic variation of traits. The functions behind the divergent traits can nevertheless be used to discuss plausible evolutionary scenarios of natural selection. Our results imply that adaptation to local sites of origin has potentially shaped the vegetative architecture of plants that is specific to each A. majus population. The quantitative genetic variation of several phenotypic traits characterising the vegetative growth and development of plants (plant height, internode length, number of branches) has probably diverged among populations as a result of adaptation to local sites of origin. Divergence in the genetic variation underlying the shape and size of plants was previously found at the level of Antirrhinum species, though its adaptive significance was not tested (Langlade et al., 2005). In southern France and northern Spain experiencing a Mediterranean climate, dryer locations are expected to select for plants with a bushier vegetative architecture, i.e., plants with smaller leaves and more branches that have better water use efficiency and resilience to drought stress (Langlade et al., 2005). It is difficult to identify exactly which environmental pressures underlie selection at local sites because several combinations of environmental parameters (vegetation cover, wind, disturbance, temperature, water availability, etc) can interact to affect phenotypic traits.
4.4. Gene flow, ecological and reproductive isolation
Our findings imply that the most likely evolutionary scenario applying to A. majus requires invoking a history of adaptation to local sites in a complex background of gene flow, ecological heterogeneity and reproductive isolation. The Pyrenees are widely acknowledged to constitute a heterogeneous landscape that promotes complex patterns of population connectivity and is prone to generate local adaptation (Alberto et al., 2010). Our Q ST–F ST comparisons reflected a potential scenario of population divergent adaptation to contrasting environmental conditions between local sites of origins. Our findings also suggested that evolutionary signatures of local adaptation differed between A. m. pseudomajus and A. m striatum, as illustrated by the potential adaptation to altitude detected only for A. m. striatum. One might speculate that this divergence might be related to the distribution of A. m. striatum populations across a narrower range of climatic conditions, even if both subspecies share to a large extent the same ecological niche (Khimoun et al., 2013). However, caution must be exercised with this explanation because the state of the environment in the past, when divergence might have occurred, is unknown and might have differed from that at present. Contrasting hypotheses might be interesting to consider, e.g., different evolutionary potentials in the presence of similar environmental pressures. These scenarios are not exclusive and can reinforce each other through a feedback loop between reproductive isolation, neutral divergence and selection.
Restricted gene flow or strong selection pressures are required for evolutionary divergence. Genetic drift, or foundation events by different gene pools, might have shaped differentially the genetic background of A. majus populations and to some extent subspecies at the scale of their global geographic range. There is evidence for the genetic signature of restricted gene exchanges in A. majus (Pujol et al., 2017). No genetic isolation by distance was found, but ecological barriers characterizing the mountain landscape of the Pyrenees probably participate to isolate populations (Pujol et al., 2017). At first sight, A. majus subspecies' divergence might not be expected because both subspecies are interfertile (Andalo et al., 2010), and no genome wide barrier to gene flow was found between them at the scale of a hybrid zone across c. 2 km in the Pyrenees (Ringbauer et al., 2018). There is also evidence for gene exchanges between the two subspecies in several contact zone locations at the periphery of their geographic ranges (Khimoun et al., 2011). Yet, subspecies' flower colour differences attest that flower colour genes are under frequency dependent selection and generate reproductive isolation between subspecies (Ringbauer et al., 2018; Tastard et al., 2012). This reproductive isolation might contribute to the subspecies phenotypic divergence of the other traits that we detected here.
In conclusion, our findings corroborate the utility of Q ST–F ST approaches conducted in common garden experiments to explore potential adaptive evolutionary divergence among populations and between subspecies in plants. They also illustrate the limits of this approach that identifies traits that might be involved with local adaptation but which fails to provide direct evidence for their response to selection. Here, our common garden results for A. m. pseudomajus and A. m. striatum populations identified vegetative traits that might play a role in the local adaptation and the differential adaptation of A. m. pseudomajus and A. m. striatum along altitudinal gradients. They suggest that the adaptation to climate variables of these otherwise interfertile subspecies might differ as a result of reproductive isolation.
AUTHOR CONTRIBUTIONS
BP designed the research program. SM, JA, VB, ML carried out the experiments; AG and SM analysed the data; AG, SM and BP wrote the manuscript.
Supporting information
Supplementary Material
ACKNOWLEDGEMENTS
We thank Jessica Côte for helpful discussions on the methods and David Field for helpful comments on the manuscript. This project has received funding from the European Research Council (ERC) under the European Union's horizon 2020 research and innovation programme (grant agreement No ERC‐CoG‐2015‐681484‐ANGI) awarded to BP. This work was supported by funding from the French “Agence Nationale de la Recherche” (ANR‐13‐JSV7‐0002 “CAPA”) to BP. This project was also supported by the ANR funded French Laboratory of Excellence projects “LABEX TULIP” and “LABEX CEBA” (ANR‐10‐LABX‐41, ANR‐10‐LABX‐25‐01). Version 3 of this preprint has been peer‐reviewed and recommended by Peer Community In Evolutionary Biology (https://doi.org/10.24072/pci.evolbiol.100097)". We thank the PCI recommender Emmanuelle Porcher, and three reviewers: Santiago C. Gonzalez‐Martinez, Sophie Karrenberg, and an anonymous reviewer for helpful comments.
Marin S, Gibert A, Archambeau J, Bonhomme V, Lascoste M, Pujol B. Potential adaptive divergence between subspecies and populations of snapdragon plants inferred from Q ST–F ST comparisons. Mol Ecol. 2020;29:3010–3021. 10.1111/mec.15546
Sara Marin and Anaïs Gibert share first authorship of this work.
DATA AVAILABILITY STATEMENT
All the data sets (phenotypic data, molecular data and metadata input files) used in the analyses presented in this article and the R code protocols used to run these analyses with these data sets are already freely accessible on the ZENODO [Open Aire EU official] repository: https://doi.org/10.5281/zenodo.3628168
REFERENCES
- Abbott, R. J. , & Brennan, A. C. (2014). Altitudinal gradients, plant hybrid zones and evolutionary novelty. Philosophical Transactions of the Royal Society B: Biological Sciences, 369(1648), 20130346 10.1098/rstb.2013.0346 [DOI] [PMC free article] [PubMed] [Google Scholar]
- Alberto, F. , Niort, J. , Derory, J. , Lepais, O. , Vitalis, R. , Galop, D. , & Kremer, A. (2010). Population differentiation of sessile oak at the altitudinal front of migration in the French Pyrenees: Genetic diversity of oaks in the Pyrenees. Molecular Ecology, 19(13), 2626–2639. 10.1111/j.1365-294X.2010.04631.x [DOI] [PubMed] [Google Scholar]
- Andalo, C. , Cruzan, M. B. , Cazettes, C. , Pujol, B. , Burrus, M. , & Thébaud, C. (2010). Post‐pollination barriers do not explain the persistence of two distinct Antirrhinum subspecies with parapatric distribution. Plant Systematics and Evolution, 286(3–4), 223–234. 10.1007/s00606-010-0303-4 [DOI] [Google Scholar]
- Angert, A. L. , & Schemske, D. W. (2005). The evolution of species' distributions: Reciprocal transplants across the elevation ranges of Mimulus cardinalis and M. lewisii . Evolution, 59(8), 1671–1684. 10.1111/j.0014-3820.2005.tb01817.x [DOI] [PubMed] [Google Scholar]
- Bates, D. , Mächler, M. , Bolker, B. , & Walker, S. (2015). Fitting linear mixed‐effects models using lme4. Journal of Statistical Software, 67(1), 1–48. 10.18637/jss.v067.i01 [DOI] [Google Scholar]
- Bonhomme, V. , Picq, S. , Gaucherel, C. , & Claude, J. (2014). Momocs: Outline analysis using R . Journal of Statistical Software, 56(13), 24 10.18637/jss.v056.i13 [DOI] [Google Scholar]
- Debout, G. D. G. , Lhuillier, E. , Malé, P.‐J.‐G. , Pujol, B. , & Thébaud, C. (2012). Development and characterization of 24 polymorphic microsatellite loci in two Antirrhinum majus subspecies (Plantaginaceae) using pyrosequencing technology. Conservation Genetics Resources, 4(1), 75–79. 10.1007/s12686-011-9478-4 [DOI] [Google Scholar]
- Donohue, K. , Rubio de Casas, R. , Burghardt, L. , Kovach, K. , & Willis, C. G. (2010). Germination, postgermination adaptation, and species ecological ranges. Annual Review of Ecology, Evolution, and Systematics, 41(1), 293–319. 10.1146/annurev-ecolsys-102209-144715 [DOI] [Google Scholar]
- Edelaar, P. , Burraco, P. , & Gomez‐Mestre, I. (2011). Comparisons between Q ST and F ST‐how wrong have we been? Molecular Ecology, 20(23), 4830–4839. 10.1111/j.1365-294X.2011.05333.x [DOI] [PubMed] [Google Scholar]
- Etterson, J. R. (2004). Evolutionary potential of Chamaecrista fasciculata in relation to climate change. II. Genetic architecture of three populations reciprocally planted along an environmental gradient in the great plains. Evolution, 58(7), 1459–1471. 10.1111/j.0014-3820.2004.tb01727.x [DOI] [PubMed] [Google Scholar]
- Favre, A. , Widmer, A. , & Karrenberg, S. (2017). Differential adaptation drives ecological speciation in campions (Silene): Evidence from a multi‐site transplant experiment. New Phytologist, 213(3), 1487–1499. 10.1111/nph.14202 [DOI] [PubMed] [Google Scholar]
- Gimenez‐Benavides, L. , Escudero, A. , & Iriondo, J. M. (2006). Local adaptation enhances seedling recruitment along an altitudinal gradient in a high mountain mediterranean plant. Annals of Botany, 99(4), 723–734. 10.1093/aob/mcm007 [DOI] [PMC free article] [PubMed] [Google Scholar]
- Halbritter, A. H. , Fior, S. , Keller, I. , Billeter, R. , Edwards, P. J. , Holderegger, R. , … Alexander, J. M. (2018). Trait differentiation and adaptation of plants along elevation gradients. Journal of Evolutionary Biology, 31(6), 784–800. 10.1111/jeb.13262 [DOI] [PubMed] [Google Scholar]
- Hereford, J. (2009). A quantitative survey of local adaptation and fitness trade‐offs. The American Naturalist, 173(5), 579–588. 10.1086/597611 [DOI] [PubMed] [Google Scholar]
- Hijmans, R. J. , Cameron, S. E. , Parra, J. L. , Jones, P. G. , & Jarvis, A. (2005). Very high resolution interpolated climate surfaces for global land areas. International Journal of Climatology, 25(15), 1965–1978. 10.1002/joc.1276 [DOI] [Google Scholar]
- Kawecki, T. J. , & Ebert, D. (2004). Conceptual issues in local adaptation. Ecology Letters, 7(12), 1225–1241. 10.1111/j.1461-0248.2004.00684.x [DOI] [Google Scholar]
- Khimoun, A. , Burrus, M. , Andalo, C. , Liu, Z.‐L. , Vicédo‐Cazettes, C. , Thébaud, C. , & Pujol, B. (2011). Locally asymmetric introgressions between subspecies suggest circular range expansion at the Antirrhinum majus global scale. Journal of Evolutionary Biology, 24(7), 1433–1441. 10.1111/j.1420-9101.2011.02276.x [DOI] [PubMed] [Google Scholar]
- Khimoun, A. , Cornuault, J. , Burrus, M. , Pujol, B. , Thebaud, C. , & Andalo, C. (2013). Ecology predicts parapatric distributions in two closely related Antirrhinum majus subspecies. Evolutionary Ecology, 27(1), 51–64. 10.1007/s10682-012-9574-2 [DOI] [Google Scholar]
- Kim, E. , & Donohue, K. (2013). Local adaptation and plasticity of Erysimum capitatum to altitude: Its implications for responses to climate change. Journal of Ecology, 101(3), 796–805. 10.1111/1365-2745.12077 [DOI] [Google Scholar]
- Körner, C. (1999). Alpine plant life. Berlin Heidelberg, Springer; 10.1007/978-3-642-98018-3 [DOI] [Google Scholar]
- Lamy, J.‐B. , Plomion, C. , Kremer, A. , & Delzon, S. (2012). Q ST < F ST as a signature of canalization. Molecular Ecology, 21(23), 5646–5655. 10.1111/mec.12017 [DOI] [PubMed] [Google Scholar]
- Langlade, N. B. , Feng, X. , Dransfield, T. , Copsey, L. , Hanna, A. I. , Thebaud, C. , … Coen, E. (2005). Evolution through genetically controlled allometry space. Proceedings of the National Academy of Sciences, 102(29), 10221–10226. 10.1073/pnas.0504210102 [DOI] [PMC free article] [PubMed] [Google Scholar]
- Leimu, R. , & Fischer, M. (2008). A meta‐analysis of local adaptation in plants. PLoS One, 3(12), e4010 10.1371/journal.pone.0004010 [DOI] [PMC free article] [PubMed] [Google Scholar]
- Leinonen, T. , McCairns, R. J. S. , O'Hara, R. B. , & Merilä, J. (2013). Q ST–F ST comparisons: Evolutionary and ecological insights from genomic heterogeneity. Nature Reviews Genetics, 14(3), 179–190. 10.1038/nrg3395 [DOI] [PubMed] [Google Scholar]
- Leinonen, T. , O'Hara, R. B. , Cano, J. M. , & Merilä, J. (2008). Comparative studies of quantitative trait and neutral marker divergence: A meta‐analysis: Q ST–F ST meta‐analysis. Journal of Evolutionary Biology, 21(1), 1–17. 10.1111/j.1420-9101.2007.01445.x [DOI] [PubMed] [Google Scholar]
- Lenth, R. , Singmann, H. , Love, J. , Buerkner, P. , & Herve, M. (2019). Package ‘emmeans’: Estimated marginal means, aka least‐squares means. Version 1.4.3.01. CRAN. [Google Scholar]
- Lind, M. I. , Ingvarsson, P. K. , Johansson, H. , Hall, D. , & Johansson, F. (2011). Gene flow and selection on phenotypic plasticity in an island system of Rana temporaria . Evolution, 65(3), 684–697. 10.1111/j.1558-5646.2010.01122.x [DOI] [PubMed] [Google Scholar]
- Mantel, N. (1967). The detection of disease clustering and a generalized regression approach. Cancer Research, 27(2), 209–220. [PubMed] [Google Scholar]
- McKay, J. K. , & Latta, R. G. (2002). Adaptive population divergence: Markers, QTL and traits. Trends in Ecology and Evolution, 17(6), 285–291. 10.1016/S0169-5347(02)02478-3 [DOI] [Google Scholar]
- Meirmans, P. G. , & Van Tienderen, P. H. (2004). Genotype and genodive: Two programs for the analysis of genetic diversity of asexual organisms. Molecular Ecology Notes, 4(4), 792–794. 10.1111/j.1471-8286.2004.00770.x [DOI] [Google Scholar]
- Merilä, J. , & Crnokrak, P. (2001). Comparison of genetic differentiation at marker loci and quantitative traits: Natural selection and genetic differentiation. Journal of Evolutionary Biology, 14(6), 892–903. 10.1046/j.1420-9101.2001.00348.x [DOI] [Google Scholar]
- Neuffer, B. , & Hurka, H. (1986). Variation of development time until flowering in natural populations of Capsella bursa‐pastoris (Cruciferae). Plant Systematics and Evolution, 152(3–4), 277–296. 10.1007/BF00989433 [DOI] [Google Scholar]
- O'Hara, R. B. & Merilä, J. (2005). Bias and precision in Q ST estimates: Problems and some solutions. Genetics, 171(3), 1331–1339. 10.1534/genetics.105.044545 [DOI] [PMC free article] [PubMed] [Google Scholar]
- Oksanen, J. , Kindt, R. , Legendre, P. , O'Hara, B. , Simpson, G. , Solymos, P. , … Wagner, H. (2009). The VEGAN Package: Community ecology package. [Google Scholar]
- Ovaskainen, O. , Karhunen, M. , Zheng, C. , Arias, J. M. C. , & Merilä, J. (2011). A new method to uncover signatures of divergent and stabilizing selection in quantitative traits. Genetics, 189(2), 621–632. 10.1534/genetics.111.129387 [DOI] [PMC free article] [PubMed] [Google Scholar]
- Pérez‐Harguindeguy, N. , Díaz, S. , Garnier, E. , Lavorel, S. , Poorter, H. , Jaureguiberry, P. , … Cornelissen, J. H. C. (2016). Corrigendum to: New handbook for standardised measurement of plant functional traits worldwide. Australian Journal of Botany, 64(8), 715 10.1071/BT12225_CO [DOI] [Google Scholar]
- Pujol, B. , Archambeau, J. , Bontemps, A. , Lascoste, M. , Marin, S. , & Meunier, A. (2017). Mountain landscape connectivity and subspecies appurtenance shape genetic differentiation in natural plant populations of the snapdragon (Antirrhinum majus L.). Botany Letters, 164(2), 111–119. 10.1080/23818107.2017.1310056 [DOI] [Google Scholar]
- Pujol, B. , Salager, J.‐L. , Beltran, M. , Bousquet, S. , & McKey, D. (2008). Photosynthesis and leaf structure in domesticated cassava (Euphorbiaceae) and a close wild relative: Have leaf photosynthetic parameters evolved under domestication? Biotropica, 40(3), 305–312. 10.1111/j.1744-7429.2007.00373.x [DOI] [Google Scholar]
- Pujol, B. , Wilson, A. J. , Ross, R. I. C. , & Pannell, J. R. (2008). Are Q ST–F ST comparisons for natural populations meaningful? Molecular Ecology, 17(22), 4782–4785. 10.1111/j.1365-294X.2008.03958.x [DOI] [PubMed] [Google Scholar]
- R Core Team . (2018). R: A language and environment for statistical computing. Retrieved from http://www.R-project.org/ [Google Scholar]
- Read, Q. D. , Moorhead, L. C. , Swenson, N. G. , Bailey, J. K. , & Sanders, N. J. (2014). Convergent effects of elevation on functional leaf traits within and among species. Functional Ecology, 28(1), 37–45. 10.1111/1365-2435.12162 [DOI] [Google Scholar]
- Ringbauer, H. , Kolesnikov, A. , Field, D. L. , & Barton, N. H. (2018). Estimating barriers to gene flow from distorted isolation‐by‐distance patterns. Genetics, 208(3), 1231–1245. 10.1534/genetics.117.300638 [DOI] [PMC free article] [PubMed] [Google Scholar]
- Roff, D. A. (1997). Evolutionary quantitative genetics, Boston, MA: Springer; 10.1007/978-1-4615-4080-9 [DOI] [Google Scholar]
- Spitze, K. (1993). Population structure in Daphnia obtusa: Quantitative genetic and allozymic variation. Genetics, 135(2), 367–374. [DOI] [PMC free article] [PubMed] [Google Scholar]
- Tastard, E. , Ferdy, J.‐B. , Burrus, M. , Thébaud, C. , & Andalo, C. (2012). Patterns of floral colour neighbourhood and their effects on female reproductive success in an Antirrhinum hybrid zone: Flower colour and selection in a hybrid zone. Journal of Evolutionary Biology, 25(2), 388–399. 10.1111/j.1420-9101.2011.02433.x [DOI] [PubMed] [Google Scholar]
- Tavares, H. , Whibley, A. , Field, D. L. , Bradley, D. , Couchman, M. , Copsey, L. , … Coen, E. (2018). Selection and gene flow shape genomic islands that control floral guides. Proceedings of the National Academy of Sciences, 115(43), 11006–11011. 10.1073/pnas.1801832115 [DOI] [PMC free article] [PubMed] [Google Scholar]
- Whibley, A. C. (2006). Evolutionary paths underlying flower color variation in Antirrhinum . Science, 313(5789), 963–966. 10.1126/science.1129161 [DOI] [PubMed] [Google Scholar]
- Whitlock, M. C. (2008). Evolutionary inference from Q ST . Molecular Ecology, 17(8), 1885–1896. 10.1111/j.1365-294X.2008.03712.x [DOI] [PubMed] [Google Scholar]
- Whitlock, M. C. , & Gilbert, K. J. (2012). Q ST in a hierarchically structured population. Molecular Ecology Resources, 12(3), 481–483. 10.1111/j.1755-0998.2012.03122.x [DOI] [PubMed] [Google Scholar]
- Whitlock, M. C. , & Guillaume, F. (2009). Testing for spatially divergent selection: Comparing Q ST to F ST . Genetics, 183(3), 1055–1063. 10.1534/genetics.108.099812 [DOI] [PMC free article] [PubMed] [Google Scholar]
- Wright, I. J. , Reich, P. B. , Westoby, M. , Ackerly, D. D. , Baruch, Z. , Bongers, F. , … Villar, R. (2004). The worldwide leaf economics spectrum. Nature, 428(6985), 821–827. 10.1038/nature02403 [DOI] [PubMed] [Google Scholar]
Associated Data
This section collects any data citations, data availability statements, or supplementary materials included in this article.
Supplementary Materials
Supplementary Material
Data Availability Statement
All the data sets (phenotypic data, molecular data and metadata input files) used in the analyses presented in this article and the R code protocols used to run these analyses with these data sets are already freely accessible on the ZENODO [Open Aire EU official] repository: https://doi.org/10.5281/zenodo.3628168