

Summary
Photosynthetic bacteria are abundant in alkaline, terrestrial hot springs and there is a long history of research on phototrophs in Yellowstone National Park (YNP). Hot springs provide a framework to examine the ecophysiology of phototrophs in situ because they provide natural gradients of geochemistry, pH and temperature. Phototrophs within the Cyanobacteria and Chloroflexi groups are frequently observed in alkaline hot springs. Decades of research has determined that temperature constrains Cyanobacteria in alkaline hot springs, but factors that constrain the distribution of phototrophic Chloroflexi remain unresolved. Using a combination of 16S rRNA gene sequencing and photoassimilation microcosms, we tested the hypothesis that temperature would constrain the activity and composition of phototrophic Cyanobacteria and Chloroflexi. We expected diversity and rates of photoassimilation to decrease with increasing temperature. We report 16S rRNA amplicon sequencing along with carbon isotope signatures and photoassimilation from 45 to 72°C in two alkaline hot springs. We find that Roseiflexus, Chloroflexus (Chloroflexi) and Leptococcus (Cyanobacteria) operational taxonomic units (OTUs) have distinct distributions with temperature. This distribution suggests that, like phototrophic Cyanobacteria, temperature selects for specific phototrophic Chloroflexi taxa. The richness of phototrophic Cyanobacteria decreased with increasing temperature along with a decrease in oxygenic photosynthesis, whereas Chloroflexi richness and rates of anoxygenic photosynthesis did not decrease with increasing temperature, even at temperatures approaching the upper limit of photosynthesis (~72–73°C). Our carbon isotopic data suggest an increasing prevalence of the 3‐hydroxypropionate pathway with decreasing temperature coincident with photoautotrophic Chloroflexi. Together these results indicate temperature plays a role in defining the niche space of phototrophic Chloroflexi (as has been observed for Cyanobacteria), but other factors such as morphology, geochemistry, or metabolic diversity of Chloroflexi, in addition to temperature, could determine the niche space of this highly versatile group.
Introduction
Photosynthetic bacteria are key primary producers in alkaline, terrestrial hot springs and a rich history of research has focused on phototrophs in Yellowstone National Park (YNP) (Pierson and Castenholz, 1974; Madigan and Brock, 1977; reviewed in the study by Tank et al., 2017; Hamilton et al., 2019). Hot springs provide a framework to test the ecophysiology of phototrophs in situ because they are dynamic and complex environments with natural gradients of temperature, sulfide and pH that harbour highly adapted microbial communities. Cyanobacteria and Chloroflexi are two phyla that contain putative phototrophs commonly observed in alkaline hot springs (Miller et al., 2009; reviewed in the study by Tank et al., 2017, Hamilton et al., 2019). While decades of work in several Yellowstone Hot Springs have shown that Cyanobacteria are constrained by temperature (Ward et al. 1998; Becraft et al., 2011, 2015, reviewed in the study by Ward et al., 2012), even at the ecotype level (Ward et al., 2006), the effect of temperature on the distribution of Chloroflexi in hot springs remains unresolved.
Cyanobacteria and Chloroflexi are diverse groups that contain phototrophs and non‐phototrophs. Historically, all members of phylum Cyanobacteria were considered obligate photoautotrophs, but recent phylogenomic analysis revealed non‐phototrophic lineages recovered from human gut and groundwater (Soo et al., 2014; Matheus Carnevali et al., 2019, Monchamp et al. 2019). Chloroflexi is a diverse phylum including autotrophic, heterotrophic and mixotrophic taxa. A handful of phototrophic Chloroflexi isolates have been recovered from hot springs (Pierson and Castenholz, 1974; Hanada et al., 2002) and their distribution in hot springs has been intensively studied in a few, limited sites (e.g. Bauld and Brock, 1973; Klatt et al., 2013a,b; Thiel et al., 2016; reviewed in Tank et al., 2017). The characterized phototrophic isolates of Chloroflexi are within a single class, Chloroflexia, and include the genera Roseiflexus, Oscillochloris and Chloroflexus (Hanada, 1995, 2002). Accumulating evidence suggests phototrophy may also be present in other classes within the phylum. For example, a sister clade to the Anaerolineae named WPS‐2 (formerly ‘subphylum I’) contains strains that encode phototrophic machinery but lack carbon fixation machinery (Ward et al., 2019a, b). The non‐phototrophic Chloroflexi comprise a larger proportion of the phylum, predominately in the class Anaerolineae that are are widespread in the environment, including strains recovered from activated sludge and wastewater (Nierychlo et al., 2019) and several metagenome assembled genomes from deep ocean environments (Saw et al., 2020), but the ecology of the class remains poorly understood in hot springs.
Photoautotrophic Chloroflexi fix CO2 using either the 3‐hydroxypropionate (3‐HP) pathway or the reductive pentose phosphate pathway. Three thermophilic phototrophic Chloroflexi – Roseiflexus sp. RS‐1, Roseiflexus castenholzii and Chloroflexus aggregans – can fix CO2 using the 3‐HP pathway (Klatt et al., 2007). Chloroflexus isolates carry out photoheterotrophic or chemoheterotrophic growth under anoxic conditions, in addition to photoautotrophic growth in media with bicarbonate and sulfide under anoxic conditions (Peirson and Castenholz, 1974, Ward et al., 2018). Roseiflexus isolates, which encode the 3‐HP pathway, have not been cultured in the absence of acetate. These isolates grow photoheterotrophically in light under anoxic conditions and chemoheterotrophically in the dark when oxygen is present (Hanada et al., 2002). Oscillochloris trichoides strain DG‐6, a photosynthetic Chloroflexi isolated from a meosphilic, hydrogen sulfide‐rich hot spring in Russia, uses the reductive pentose phosphate pathway to fix carbon (Ivanovsky et al., 1999), which suggests the 3‐HP pathway could be a unique characteristic of thermophilic autotrophic Chloroflexi. The recovery of transcripts of 3‐HP pathway enzymes in a hot spring mat are consistent with carbon fixation by Roseiflexus and Chloroflexus across the diel cycle (Klatt et al., 2013b) where Chloroflexus transcripts were more abundant at 65°C while Roseiflexus transcripts were more abundant at 60°C.
Cyanoabacteria and Chloroflexi often co‐occur in lakes, rivers, and soils in addition to hot springs (Miller et al., 2009; Burow et al., 2013; Klatt et al., 2013b; Cuecas et al., 2014). Photoautotrophic Cyanobacteria are thought to be major primary producers in alkaline hot springs between 60°C and 72°C, while the versatile carbon assimilation strategies in Chloroflexi and relationship between these two phyla remain unresolved in hot springs. Given that some Chloroflexi are photoheterotrophic, previous work has suggested a cross‐feeding relationship between heterotrophic Roseiflexus and photoautotrophic Cyanobacteria in situ (Burow et al., 2013). However, the recovery of Roseiflexus and Chloroflexus 3‐HP transcripts at temperatures up to 65°C in Mushroom Spring (Klatt et al., 2013b) and observations of Chloroflexus spp. in alkaline hot springs devoid of Cyanobacteria (Giovannoni et al., 1987) suggest phototrophic Chloroflexi contribute to carbon fixation in alkaline terrestrial hot springs.
Given (i) the metabolic diversity of Chloroflexi, (ii) the potential for different carbon assimilation strategies in phototrophic Chloroflexi, (iii) evidence for additional phototrophic taxa within this phylum, and (iv) temperature constraints on phototrophic cyanobacterial taxa, we expected temperature would select for specific taxa of phototrophic Chlorofexi and control their contribution to carbon fixation. To test our assumption, we examined photoassimilation and community composition across a temperature gradient of 45–72°C in two alkaline hot springs in YNP where phototrophs mats and filaments are abundant. Rabbit Creek (identified as MRCHSG032 in the YNP Thermal Inventory) is a geothermal stream that stretches over 1.2 km, resulting in a long temperature gradient from the near boiling source to ambient temperature where the stream joins with Firehole River. Rosette Geyser (identified as LSMG013 in the YNP Thermal Inventory, henceforth referred to as ‘Bison Pool’) is a discrete hot spring with a 20–30 m runoff channel. Our results suggest that unlike oxygenic photosynthesis, anoxygenic photosynthesis is not limited at higher temperatures and high temperature environments offer a niche for specific putative phototrophic Chloroflexi.
Results and discussion
Sampling, sequencing and in situ conditions in Rabbit Creek and Bison Pool
We sampled seven sites along 200 m of Rabbit Creek starting approximately 4 m from the source (RC1). Near the source, the creek is host to thin yellow and orange phototrophic mats of Chloroflexi and Cyanobacteria (Fig. 1) at the upper temperature limit of photosynthesis (72°C; Brock, 1978). In contrast, green and orange phototrophs are more common downstream in the cooler water where they form long filamentous strands ranging in diameter from millimetre to centimetre. In addition to temperature changes, oxygen increases with distance from the source and the width and depth of the stream bed change leading to variable flow. We also sampled three sites along the Rosette Geyser (‘Bison Pool’) outflow from 4 m from the source to 10 m from the source. The outflow channel at Bison Pool is host to a yellow‐green mat near the source transitioning to an orange‐green thicker mat downstream. We sampled the yellow‐green mat, a transition zone, and an orange‐green mat. In 10 sites, temperatures ranged from 45°C to 72°C (Supporting Information Table S1). The sample with highest temperature was BP1 while the lowest temperature was observed in RC7. Site pH remained relatively consistent throughout Rabbit Creek (mininumum pH 8.9, maximum pH 9.3) and tracks with fluctuations in dissolved inorganic carbon (Supporting Information Table S1). Sulfide in all Rabbit Creek samples were below the limit of detection (3.2 μM) (Supporting Information Table S1). In Bison Pool, water samples for geochemical analysis were only collected for BP1 where sulfide was relatively low (4.8 μM). Sulfide decreased by 33.8 μM from the source (BP0) to BP1 (2 m) (Supporting Information Table S1), suggesting sulfide downstream in BP2 and BP3 is near or below the limit of detection.
Fig 1.

Chloroflexi and Cyanobacteria are the two most abundant phototrophic phyla – their abundance varies with temperature. The natural log of the relative abundance of Cyanobacteria and Chloroflexi for each site is plotted at the phylum level. Each panel represents one phylum.
Biomass was collected from seven Rabbit Creek (RC) sites and three Bison Pool (BP) sites in June 2018. Samples (n = 3 for each site) were collected using flame‐sterilized spatulas or forceps, placed in sterile 2.0‐ml vials and immediately frozen on dry ice and stored at −80°C until nucleic acid extraction. Total DNA was extracted from ∼250‐mg samples using a DNeasy PowerSoil kit (Qiagen, Carlsbad, CA, USA) according to the manufacture's instructions. Amplicons were sequenced using MiSeq Illumina 2 × 300‐bp chemistry at the University of Minnesota Genomics Center (UMGC). We targeted the V4 hypervariable region of bacterial and archaeal 16S small subunit rRNA gene using the modified primers 515F and 806R (Gohl et al., 2016). Postsequence processing was performed using mothur version 1.37.6 (Schloss et al. 2009) following the MiSeq SOP with the following modifications: sequences were classified at a 99% cutoff using the Silva database (v132) and remove. rare was used to remove sequences with less than three reads. Sequence data was analysed using R version 3.6.1 (R Core Team, 2018) and the ggplot2 and tidyverse package (Wickham, 2014, 2016).
Phototrophic Chloroflexi have unique distributions with temperature
To assess the variation in phototrophic taxa in sites with varying temperature, we sequenced 16S rRNA amplicons in biomass from each of the sites (Fig. 1 and Supporting Information Fig. S1). The number of reads recovered varied from 202 797 in BP1 to 67 041 reads in RC4. In total, 32 834 OTUs were classified from 10 sites (Supporting Information Table S2). As expected based on previous studies of alkaline hot springs, more than 50% of the OTUs were classified as either Chloroflexi or Cyanobacteria (Fig. 1) (Brock, 1978; Bateson and Ward, 1988; Nübel et al., 2002; Bhaya et al., 2007; Miller et al., 2009; Rozanov et al., 2017; Alcamán‐Arias et al., 2018, reviewed in Thiel et al., 2018; Hamilton et al., 2019).
Chloroflexi richness (OTUs per sample) did not show a linear trend with temperature (Fig. 2B and Supporting Information Fig. S2B,C). Roseiflexus OTUs were the most abundant genus of Chloroflexi in all sites, followed by Chloroflexus OTUs (Fig. 2A). We did not recover any 16S rRNA reads that classified as other potential phototrophic Chloroflexi (e.g. to WPS‐2 clade, Ward et al., 2019a,b). To assess the richness of phototrophic Chloroflexi, we divided the Chloroflexi OTUs (defined at 99% sequence identity) into two groups: phototrophic Chloroflexi (Roseiflexus and Chloroflexus) and non‐phototrophic Chloroflexi (all other taxa within the phylum Chloroflexi) with the caveat that Chloroflexi taxonomy is confounded by lack of sequenced and characterized isolates. We recovered a similar number of OTUs for each group (540 phototrophic; 545 non‐phototrophic). The highest richness values of phototrophic Chloroflexi occur at the highest and lowest temperatures sampled (72°C and 45°C) (Fig. 2B). In the non‐phototrophic group, the highest richness was observed at the lowest temperature sampled (45°C). Previous work has shown that microbial diversity decreases with increasing temperature in hot spring outflows (Miller et al., 2009; Cole et al., 2013), even in the most extreme cases [e.g. the steep thermal gradient (50°C–90°C) observed in the Tengchong Geothermal Field; Li et al., 2015]. Yet, in our data set, phototrophic Chloroflexi richness is highest at both high and low temperature sites, suggesting diverse phototrophic Chloroflexi populations can persist at or near the upper temperature limit of photosynthesis.
Fig 2.

Distribution of taxa and diversity of phototrophic and non‐phototrophic Chloroflexi. A. Relative abundance of the top 10 OTUs arranged by decreasing temperature. The OTUs are split into three plots: Rosieflexus and Chloroflexus in the first two plots and all of the non‐phototrophic Chloroflexi are shown together in the third plot. OTUs are differentiated by colour. The highest taxonomic classification for each OTU (from the Silva v132 database) is stated in the legend. B. Richness of phototrophic and non‐phototrophic groups of Chloroflexi for each site (shared x‐axis). 'Distinct‐phototrophs' is the total Roseiflexus and Chloroflexus OTUs and 'Distinct non‐phototrophs' is the remaining Chloroflexi OTUs.
To assess the distribution of specific OTUs, we plotted the top 10 Chloroflexi (most abundant) OTUs (Fig. 2A) for each site. The top 10 Chloroflexi OTUs included five OTUs assigned to the phototrophic group and five to the non‐phototrophic group. Taxonomic classification was verified by BLASTN (Altschul et al., 1990). OTUs affiliated with Chloroflexus do not follow a distinct trend with temperature, whereas distinct Roseiflexus OTUs oscillate with temperature: OTU6 comprises 7%–10% of the taxa in sites above 63.3°C, but less than 3% in sites below 58.3°C. Alternatively, Roseiflexus OTU2 comprised <5% of the taxa above 63.3°C but accounted for more than 14% in the 58.3°C and 56.2°C sites. Both OTU2 and OTU6 were most closely related to Roseiflexus sp. RS‐1, the Roseiflexus isolated from the higher temperature (60°C) (Hanada et al., 2002; Madigan et al., 2005), which suggests the niche space for this species is up to 72°C. In general, the non‐phototrophic OTUs are less abundant at temperatures above 62.5°C and below 52.1°C indicating taxa of both phototrophic and non‐phototrophic Chloroflexi are adapted to different temperature ranges.
Temperature partitions Chloroflexus and Roseiflexus in microbial mats in Mushroom Spring: Chloroflexus were more abundant at 65°C while Roseiflexus were more abundant at 60°C (Klatt et al., 2013b). Here, Roseiflexus outnumber Chloroflexus OTUs in all sites sampled (Figs. 2A and 4). Roseiflexus abundance peaks between 71.8°C and 58.3°C while Chloroflexus abundance is comparatively low in that temperature range (average relative abundances 29% and 6% respectively) (Figs. 2A and 4). RBG‐13‐54‐9 and SBR1031 (Fig. 2A), two non‐phototrophic groups within the class Anaerolineae, are the most abundant non‐phototrophic groups that were recovered. Taxa from these groups have not been isolated from hot springs and sequences affiliated with these groups are typically observed in mesophilic, halogenated environments (Yamada et al., 2006). Our results, from both BP and RC, suggest Roseiflexus is more abundant at higher temperatures in contrast to observations from Mushroom Spring. This observation could suggest other biotic and abiotic factors, like morphology or structure, in addition to temperature, impact the distribution of phototrophic Chloroflexi. At the time of sampling, we observed thin mats (~5 mm) at temperatures >60°C. This finding is similar to observed morphologies in both ferruginous hot springs in Japan sampled from 60 to 63°C (Ward et al., 2017, 2019a) and Mushroom Spring mats from 60°C (Thiel et al., 2016); yet there are distinct differences in phototrophic communities as described above. At cooler sites in the Ward et al. (2019a) study, they observed thick mats of Leptolyngbya and Chloroflexus‐like genotypes at 30–40°C. Similarly, in our lowest temperature site (RC7, 45°C) we observed thick mats and filamentous strands, abundant Gloeomargarita, Leptolyngbya and Chloroflexus OTUs, and low Rosieflexus and Leptococcus abundance. Both similar morphologies and phototrophic communities suggest that at lower temperature, dense mats could result in more diverse phototrophic communities.
Fig 4.

Photoassimilation of 13C Bicarbonate varies with temperature and top phototrophic genera. A. Rates of oxygenic and anoxygenic photosynthesis plotted by temperature. Rates of anoxygenic photosynthesis (squares) were calculated by subtracting the Dark assimilation values from Light + DCMU group. Rates of oxygenic photosynthesis were calculated by subtracting the Dark and Light + DCMU values from the Light values (triangles). Adjusted rates shown here were log plus one transformed to meet normality requirements for statistical tests. Error bars are present for assimilation rates but are often within the data point symbol. B. Box and whisker plots of the relative abundance of OTUs of Chloroflexus and Roseiflexus (phototrophic Chloroflexi) and Leptococcus (phototrophic Cyanobacteria) plotted by temperature and are shaded by highest taxonomic assignment in mothur. Dots represent outliers.
Microcosm set up and statistical analysis in 4A:
To assess the activity of anoxygenic photoautotrophs and oxygenic photoautotrophs, we performed inorganic 13C assimilation microcosms in Light, Light + inhibitor and Dark treatments in seven Rabbit Creek sites and one Bison Pool site in June 2018. Only one Bison Pool site was included in this experiment because of sampling limitations but is included here to test productivity at the upper limit of photosynthesis (72°C). To parse the photoassimilation of anoxygenic versus oxygenic photosynthesis, we amended a subset of microcosms with DCMU (3‐(3,4‐dichlorophenyl)‐1,1‐dimethylurea), an inhibitor of oxygenic photosynthesis. A Dark control group was set up and wrapped in foil to halt photoassimilation of inorganic carbon. Microcosm experiments were conducted in triplicate, incubated at in situ spring temperature for 2 h and placed on dry ice following the incubation period. Carbon stable isotope signals of biomass were determined via a Costech Instruments elemental analyser (EA) periphery connected to a Thermo Scientific Delta V Advantage IR‐MS at the UC Davis Stable Isotope Facility. Microcosm samples were thawed, and biomass was rinsed with 1 M HCl to remove any extra 13C‐labelled DIC, triple rinsed with 18.2 MΩ cm−1 deionized water, and then dried (60°C for 3 days). Natural abundance samples were not treated with acid. Samples were ground/homogenized with a cleaned mortar and pestle (ground with ethanol silica slurry, triple rinsed with 18.2 MΩ cm−1 deionized water, and dried), weighed, and placed into tin boats, sealed, and submitted to the UC Davis Stable Isotope Facility for analyses. Rates of 13C‐labelled DIC uptake (carbon assimilation rates) reflect the difference in uptake between the biomass in the assays that received NaH13CO3 and the natural abundance biomass samples. Using the organic carbon content, the uptake rate was calculated from the total micrograms of C taken up divided by the grams of organic C per gram of sediment, and that was divided by the number of hours of incubation (typically ∼2 h). Raw rates are provided in the Supporting Information Table S3.
To test the hypothesis that rates within sites are not significantly different, an analysis of variance was conducted followed by the post hoc Tukey's Honest Significant Difference test under the null hypothesis that light and DCMU + light 13C assimilation rates were not significantly different within sites. Similarly, to test the hypothesis that photosynthetic rates differ from site to site down the temperature gradient, an analysis of variance was conducted followed by the post hoc Tukey's Honest Significant Difference test under the null hypothesis that light and dark rates are not significantly different between sites (see Supporting Information Tables S3 and S4 for a list of pairwise comparisons and respective P‐values). None of the anoxygenic photosynthesis rates were significantly different between sites; however, three of the pairwise comparisons of oxygenic photosynthesis rates between sites were significantly different and are shown via black bars bars (* indicates a P < 0.05).
Cyanobacteria richness and abundance were indirectly proportional to temperature. The highest proportion of total Cyanobacteria was observed in RC6 and RC7, the lowest temperature sites (Fig. 1), where richness of phototrophic taxa was highest (total OTUs, Fig. 3B). A Spearman correlation suggests phototrophic Cyanobacteria richness decreases with increasing temperature (Supporting Information Fig. S2A). OTUs affiliated with non‐phototrophic Cyanobacteria were rare (<0.01%) in our samples. At temperatures greater than 63°C, OTUs affiliated with Leptococcus (previously Synechococcus, renamed in Walter et al., 2017) were abundant, specifically OTU5 and OTU8 (Supporting Information Fig. 3A). BLASTN results identified OTU5 and OTU8 were most closely related to Leptococcus yellowstonii (formerly Leptococcus JA‐3‐3ab, Walter et al., 2017). At temperatures below 60°C, Gloemargarita, Leptolyngbya, Geitlerinema and Leptococcus OTUs were recovered. It is not uncommon to recover Leptococcus spp. from YNP hot springs, as these organisms are highly adapted to these environments: Leptococcus yellowstonii and Leptococcus springii were isolated from mats in Octopus Spring in YNP at temperatures that range from 51°C to 61°C, pH 8.5 and relatively low sulfide content (Bhaya et al., 2007; Thiel et al., 2016). Here, there is a clear shift in cyanobacterial taxa along the temperature gradient, suggesting specific Leptococcus OTUs are able to outcompete other Cyanobacteria or that other taxa are not able to adapt to temperatures above 63°C.
Fig 3.
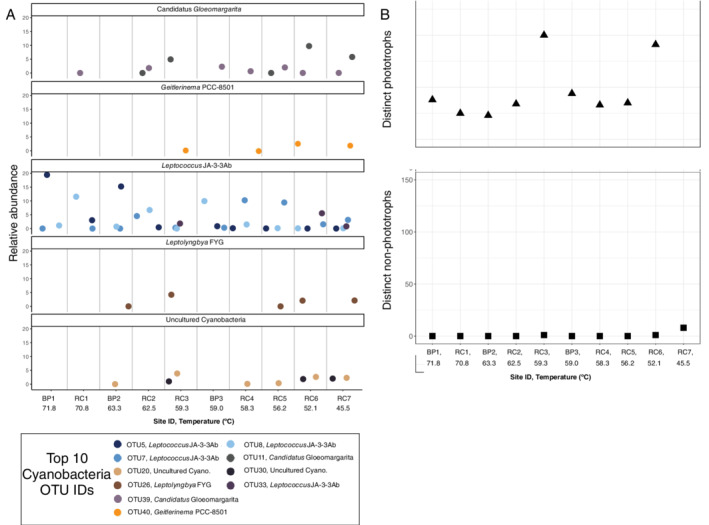
Distribution of taxa and diversity of phototrophic and non‐phototrophic Cyanobacteria. A. Relative abundance of the top 10 phototrophic cyanobacterial OTU faceted by genus for each site, plotted by decreasing temperature. Different OTUs are differentiated by colour and the highest taxonomic classification for each OTU (from the Silva v132 database) is stated in the legend. B. Richness of phototrophic and non‐phototrophic cyanobacterial for each site (shared x‐axis), where 'Distinct‐phototrophs' refers to the total Oxyphotobacteria OTUs and 'Distinct non‐phototrophs' is the remaining Cyanobacteria OTUs. Similar to Fig. 3, OTUs assigned to phylum Cyanobacteria were divided into two groups: phototrophic Cyanobacteria in class Oxyphotobacteria and non‐phototrophic Cyanobacteria in the remaining genera. All of the top 10 Cyanobacteria OTUs were in class Oxyphotobacteria. Leptococcus JA‐3‐3ab in the Silva database is Leptococcus yellowstonii (renamed in Walter et al., 2017).
Photoassimilation rates and 13C fractionation increase with decreasing temperature
We performed bulk microcosms with samples of phototrophic mats and filaments using inorganic carbon to assess the rates of photoassimilation at different temperatures (Fig. 4). Here, we report the photoassimilation of bicarbonate in light treatments minus 3‐(3,4‐dichlorophenyl)‐1,1‐dimethylurea (DCMU, an inhibitor of oxygenic photosynthesis) treatments as rates of oxygenic photosynthesis. The rates of anoxygenic photosynthesis were determined by subtracting rates of microcosms performed in the dark from the rates in DCMU treatments. Rates of oxygenic photosynthesis are lowest at temperatures above 70°C. Above 62°C, rates of oxygenic photosynthesis were not significantly different (P < 0.05), suggesting oxygenic photosynthesis is limited at high temperatures. Rates of anoxygenic photosynthesis from site to site across the temperature gradient were not significantly different (P < 0.05), suggesting anoxygenic photosynthesis does not decrease with incremental decreases in temperature. The lowest rate of photoassimilation in both treatments was at the highest temperature (BP1) where the largest proportion of Leptococcus was observed (Fig. 4). Roseiflexus outnumber Chloroflexus in all sites and rates of anoxygenic photosynthesis are not significantly different from site to site, suggesting Chloroflexus spp. could be contributing less to primary productivity or Roseiflexus are playing a larger role in primary productivity.
Researchers have been studying carbon fixation of primary producers in thermophilic communities for decades (Castenholz, 1969; Brock, 1978; Estep and Macko, 1984; Madigan et al., 1989; van der Meer et al., 2000a; Jahnke et al., 2001; Hugler et al., 2007; Boyd et al., 2009) and previous work has shown that carbon isotopes are fractionated depending upon the pathway used (Estep and Macko, 1984; van der Meer et al., 2000a, b). In a previous study at Bison Pool, carbon fractionation values (Δ13C) were less negative at high temperatures (65–105°C) and Chloroflexi and Cyanobacteria were absent or present at only low abundance in these samples (even those below ~72°C) (Havig et al., 2011). We have reported similar fractionation values (Δ13C) in our data, where Δ13C values increased (became less negative) with increasing temperature (Fig. 5). However, in our study, specific Chloroflexus and Rosieflexus OTUs comprised a large proportion of the community and increased at high temperature (Figs. 2 and 4). In pure cultures, thermophilic microorganisms using the 3‐HP pathway fractionate at heavier isotope values (−2.6 to −13.7‰) in 55–85°C incubation temperatures (House et al., 2003). Chloroflexus aurantiacus fractionates on the lighter side of this range (more negative values) with values from −13.0 to −13.7‰ (van de Meer et al., 2000a; House et al., 2003). Carbon fractionation in autotrophic Roseiflexus has not been reported. In our data, fractionation values similar to those of in C. aurantiacus were observed in cooler sites (<59.3°C) where we recovered Chloroflexus OTUs, while lighter values and fewer Chloroflexus OTUs were observed above 59.3°C (Fig. 4). The thermophilic photoautotrophic cyanobacterium, Thermosynechococcus elongatus, (formerly Synechococcus lividis) fractionates carbon at −16.8‰ in pure culture (van der Meer et al., 2000a) which is consistent with the lighter fractionation values we observe at temperatures >70°C and where we recovered a larger proportion of Leptococcus OTUs. The shift in fractionation with decreasing temperature and increasing abundance of Chloroflexus OTUs suggest the 3‐HP pathway could be contributing more to primary productivity at temperatures below 59.3°C and photoautorophy in Chloroflexi may be limited at higher temperatures in the presence of Cyanobacteria.
Fig 5.
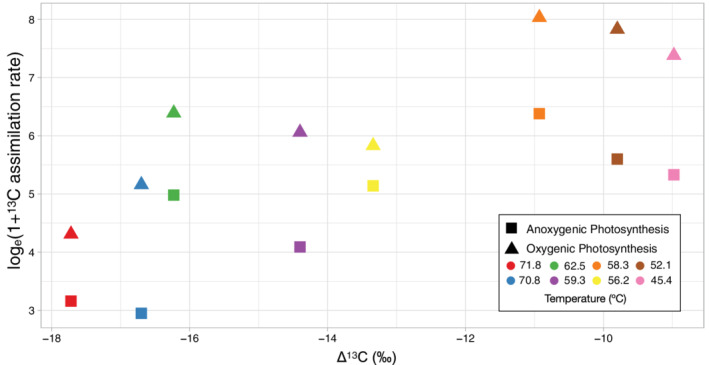
In situ depletions in 13C biomass versus microcosm‐derived photosynthetic rates. Carbon stable isotope signals of biomass were determined as described above (Fig. 4). All isotopic data are reported as isotope ratios, relative to standards of known value, using the equation [(isotope ratio of sample)/(isotope ratio of standard) − 1] × 1000, expressed in delta notation (δ) and reported as per mil (‰). Carbon isotopic values are reported as isotopic ratios of 13C to 12C from the equation [(13C/12C of sample)/(13C/12C of standard) − 1] × 1000 and expressed in delta notation (δ13C). δ13C values are reported using the Vienna Pee Dee Belemnite (VPDB) standard. The difference between DIC δ13C values (Table S1) and biomass δ13C values (Supporting Information Table S1, Fig. S3) is expressed as Δ13C and represents the fractionation of 13C from the source inorganic carbon (DIC δ13C) and biomass δ13C values. Here, we have plotted the change in 13C fractionation (Δ13C) versus photosynthetic rates from microcosm experiments (triangles for oxygenic photosynthesis, squares for anoxygenic photosynthesis). Symbols are shaded by in situ temperature.
We have shown that oxygenic photosynthesis is limited at high temperature and Cyanobacteria richness increases with decreasing temperature. Rates of anoxygenic photosynthesis are consistent across a large temperature range (45–72°C) and, while Chloroflexi richness does not have a liner relationship with temperature, Roseiflexus OTUs persisted across the temperature range, even at the upper temperature limit of photosynthesis. Together these results indicate temperature plays a role in defining the niche space of specific phototrophic Chloroflexi (as has been observed for Cyanobacteria), but other factors such as morphology, geochemistry, or metabolic diversity, in addition to temperature, could determine the niche space of this highly versatile group. Furthermore, these results suggest that temperature has a significant effect on taxa involved in primary productivity in alkaline hot springs by decreasing diversity at high temperatures, limiting the niche space to specific taxa.
Author contributions
A. C. B. and T. L. H. designed the study, collected samples, performed the field work, and completed the laboratory analyses. A. C. B. analysed the data. A. C. B., S. K. M. and T. L. H. interpreted the data and wrote the manuscript.
Data availiability
The sequence data have been deposited with links to BioProject accession number PRJNA622983 in the NCBI BioProject database (https://www.ncbi.nlm.nih.gov/bioproject/).
Supporting information
Fig. S1 Natural log relative abundance of OTUs < 0.1%. OTUs with counts <1% of the total count for each site were removed to prevent over plotting in Fig. 1. The log abundance of those OTUs are shown here for each site.
Fig. S2 Pearson correlation between Chloroflexi and Cyanobacteria richness and temperature. To test whether richness within the two dominant groups in our samples is linearly related to temperature, we conducted a Pearson correlation between number of distinct taxa and temperature using the package ggpubr in R. Black lines are the regression lines with corresponding R values and shaded grey regions indicate the 95% confidence interval. We conducted correlation analyses between richness in phototrophic Cyanobacteria (A), non‐phototrophic Chloroflexi (B) and phototrophic Chloroflexi (C) with temperature. There were not enough observations in the non‐phototrophic Chloroflexi group to conduct the analysis (11 observed taxa). Both Chloroflexi groups were not significantly correlated with temperature, while phototrophic Cyanobacteria richness was negatively correlated with temperature (A, p = 0.01).
Fig. S3 Biomass δ 13 C values versus in situ temperature. Carbon isotopic signatures were determined as previously described (Fig. 5). For each site, we have plotted the δ13C biomass signature versus site temperature.
Table S1. Site geochemistry. Samples for δ13C (n = 1 for each site) were collected using flame‐sterilized spatulas or forceps. Samples were placed in sterile 2.0‐ml vials and immediately frozen on dry ice and stored at −80°C until processing for C and δ13C analysis. Sulfide, Fe2+, and dissolved silica were measured onsite using a DR1900 portable spectrophotometer (Hach Company, Loveland, CO). Water samples were filtered through 0.2‐μm polyethersulfone syringe filters (VWR International, Radnor, PA, USA) and analysed for dissolved inorganic carbon (DIC) concentration and δ13C value as described previously (Havig et al. 2011). Field blanks comprised of filtered 18.2 MΩ/cm deionized water, transported to the field in 1‐l Nalgene bottles (acid washed as described above), were collected onsite using the equipment and techniques described above. All isotopic data are reported as isotope ratios, relative to standards of known value, using the equation [(isotope ratio of sample)/(isotope ratio of standard) − 1] × 1,000, expressed in delta notation (δ) and reported as per mil (‰). Carbon isotopic values are reported as isotopic ratios of 13C to 12C from the equation [(13C/12C of sample)/(13C/12C of standard) − 1] × 1,000 and expressed in delta notation (δ13C). δ13C values are reported using the Vienna Pee Dee Belemnite (VPDB) standard. The difference between DIC δ13C values and biomass δ13C values is expressed as Δ13C and represents the fractionation of 13C from the source inorganic carbon (DIC δ13C) and biomass δ13C values. BDL = below the limit of detection of the field spectrophotometer. Sample metadata has been submitted to NCBI with corresponding accession numbers (column 1).
Table S2. Sequences and OTUs recovered for each site. Total sequence reads for each site (column 1) are listed in column 2. 24186 OTUs were classified (at 99% sequence identity) in our analysis. To remove noise in the dataset, we omitted OTUs with counts <3, resulting in 2767 OTUs that were considered in this analysis. Total OTUs per site are listed in column 3.
Table S3. Raw rates of photosynthesis and pairwise comparison of means between light and DCMU treatments within sites. Uptake rates (g/h) are listed for each treatment (n = 3) in each site (n = 8). An analysis of variance was conducted followed by the post‐hoc Tukey's Honest Significant Difference test under the null hypothesis that light and light + DCMU 13C assimilation rates were not significantly different within sites (*p < 0.05).
Table S4. Pairwise comparison of light treatment rates from site to site and DCMU treatment rates from site to site. To test the hypothesis that photosynthetic rates differ from site to site down the temperature gradient, an analysis of variance was conducted followed by the post‐hoc Tukey's Honest Significant Difference test under the null hypothesis that light and dark rates are not significantly different between sites (see Table S3 and S4 for a list of pairwise comparisons and respective p‐values).
Acknowledgements
T. L. H. conducts research in Yellowstone National Park under research permit YELL‐2018‐SCI‐7020 issued by the Yellowstone Research Permit Office (to T. L. H. and Jeff Havig) and reviewed annually. The authors acknowledge the Minnesota Supercomputing Institute (MSI) at the University of Minnesota for providing resources that contributed to the research results reported within this paper. We are grateful to the entire staff of the Yellowstone Research Permit Office for facilitating the permitting process to perform research in YNP. Special thanks to Annie Carlson and Erik Oberg in the Yellowstone Research Permit Office. We thank J. Havig, L. Brengman, C. Grettenberger, L. Seyler, and J. Kuether for technical assistance in the field and A. Borowski and K. Quinn for assistance processing samples in the lab.
References
- Alcamán‐arias, M.E. , Pedrós‐alió, C. , Tamames, J. , Fernández, C. , Pérez‐pantoja, D. , and Vásquez, M. (2018) Diurnal changes in active carbon and nitrogen pathways along the temperature gradient in Porcelana hot spring microbial mat. Front Micrbiol 9: 1–17. [DOI] [PMC free article] [PubMed] [Google Scholar]
- Altschul, S.F. , Gish, W. , Miller, W. , Myers, E.W. , and Lipman, D.J. (1990) Basic local alignment search tool. J Mol Biol 215: 403–410. [DOI] [PubMed] [Google Scholar]
- Bateson, M. , and Ward, D.M. (1988) Photoexcretion and fate of Glycolate in a hot spring Cyanobacterial mat. Appl Env Microbiol 54: 1738–1743. [DOI] [PMC free article] [PubMed] [Google Scholar]
- Bauld, J. , and Brock, T.D. (1973) Ecological studies of Chloroflexis, a gliding photosynthetic bacterium. Arch Mikrobiol 92: 267–284. [Google Scholar]
- Becraft, E.D. , Cohan, F.M. , Kuehl, M. , Jensen, S.I. , and Ward, D.M. (2011) Fine‐scale distribution patterns of Synechococcus ecological diversity in the microbial mat of Mushroom Spring, Yellowstone National Park. Appl. Env. Microbiol 77: 7689–7697. [DOI] [PMC free article] [PubMed] [Google Scholar]
- Becraft, E.D. , Wood, J.M. , Rusch, D.B. , Kühl, M. , Jensen, S. , and Bryant, D.A. (2015) The molecular dimension of microbial species: 1. Ecological distinctions among, and homogeneity within, putative ecotypes of Synechococcus inhabiting the cyanobacterial mat of Mushroom Spring, Yellowstone National Park. Front Microbiol. 6: 590. [DOI] [PMC free article] [PubMed] [Google Scholar]
- Bhaya, D. , Grossman, A.R. , Steunou, A.S. , Khuri, N. , Cohan, F.M. , and Hamamura, N. (2007) Population level functional diversity in a microbial community revealed by comparative genomic and metagenomic analyses. ISME J 1: 703–713. [DOI] [PubMed] [Google Scholar]
- Boyd, E.S. , Leavitt, W.D. , and Geesey, G.G. (2009) CO2 uptake and fixation by a thermoacidophilic microbial community attached to precipitated sulfur in a geothermal spring. Appl Environ Microbiol 75: 4289–4296. [DOI] [PMC free article] [PubMed] [Google Scholar]
- Brock, T.D. (1978) Thermophilic Microorganisms and Life at High Temperatures. Berlin: Springer; 10.1002/esp.3760050112. [DOI] [Google Scholar]
- Burow, L.C. , Woebken, D. , Marshall, I.P.G. , Lindquist, E.A. , Bebout, B.M. , and Prufert‐Bebout, L. (2013) Anoxic carbon flux in photosynthetic microbial mats as revealed by metatranscriptomics. ISME J 7: 817–829. [DOI] [PMC free article] [PubMed] [Google Scholar]
- Castenholz, R.W. (1969) Thermophilic blue‐green algae and the thermal environment. Bacteriol Rev 33: 476–504. [DOI] [PMC free article] [PubMed] [Google Scholar]
- Cole, J.K. , Peacock, J.P. , Dodsworth, J.A. , Williams, A.J. , Thompson, D.B. , and Dong, H. (2013) Sediment microbial communities in great boiling spring are controlled by temperature and distinct from water communities. ISME J 7: 718–729. [DOI] [PMC free article] [PubMed] [Google Scholar]
- Cuecas, A. , Portillo, M.C. , Kanoksilapatham, W. , and Gonzalez, J.M. (2014) Bacterial distribution along a 50°C temperature gradient reveals a parceled out hot spring environment. Microb Ecol 68: 729–739. [DOI] [PubMed] [Google Scholar]
- Estep, M.L.F. , and Macko, S.A. (1984) Nitrogen isotope biogeochemistry of thermal springs. Org Geochem 6: 779–785. [Google Scholar]
- Giovannoni, S.J. , Revsbech, N.P. , Ward, D.M. , and Castenholz, R.W. (1987) Obligately phototrophic Chloroflexus: primary production in anaerobic hot spring microbial mats. Arch Microbiol 147: 80–87. [Google Scholar]
- Gohl, D.M. , Vangay, P. , Garbe, J. , MacLean, A. , Hauge, A. , and Becker, A. (2016) Systematic improvement of amplicon marker gene methods for increased accuracy in microbiome studies. Nature Biotech 34: 942–949. [DOI] [PubMed] [Google Scholar]
- Hamilton, T.L. , Bennett, A.C. , Murugapiran, S.K. , and Havig, J.R. (2019) Anoxygenic Phototrophs span geochemical gradients and diverse morphologies in terrestrial geothermal springs. mSystems 4: e00498–e00419. [DOI] [PMC free article] [PubMed] [Google Scholar]
- Hanada, S. , Hiraishi, A. , Shimada, K. , and Matsuura, K. (1995) Chloroflexus aggregans sp. nov., a filamentous phototrophic bacterium which forms dense cell aggregates by active gliding movement. Int J Syst Bacteriol 45: 676–681. [DOI] [PubMed] [Google Scholar]
- Hanada, S. , Takaichi, S. , Matsuura, K. , and Nakamura, K. (2002) Roseiflexus castenholzii gen. nov., sp. nov., a thermophilic, filamentous, photosynthetic bacterium that lacks chlorosomes. Int J Syst Evol Microbiol 52: 187–193. [DOI] [PubMed] [Google Scholar]
- Havig, J.R. , Raymond, J. , Meyer‐Dombard, D.R. , Zolotova, N. , and Shock, E.L. (2011) Merging isotopes and community genomics in a siliceous sinter‐depositing hot spring. J Geophys Res Biogeo 116: 1–15. [Google Scholar]
- House, C.H. , Schopf, J.W. , and Stetter, K.W. (2003) Carbon isotopic fractionation by Archaeans and oth‐ er hyperthermophilic prokaryotes. Org Geochem 34: 345–356. [Google Scholar]
- Hugler, M. , Huber, H. , Molyneaux, S.J. , Vetriani, C. , and Sievert, S.M. (2007) Autotrophic CO2 fixation via the reductive tricarboxylic acid cycle in different lineages within the phylum Aquificae: evidence for two ways to citrate cleavage. Environ Microbiol 9: 81–92. [DOI] [PubMed] [Google Scholar]
- Ivanovsky, R.N. , Fal, Y.I. , Berg, I.A. , Ugolkova, N.V. , Krasilnikova, E.N. , Keppen, O.I. , Zakharchuc, L.M. , and Zyakun, A.M. (1999). Evidence for the presence of the reductive pentose phosphate cycle in a filamentous anoxygenic photosynthetic bacterium, Oscillochloris trichoides strain DG‐6. Microbiology, 145: 1743–1748. [DOI] [PubMed] [Google Scholar]
- Jahnke, L.L. , Eder, W. , Huber, R. , Hope, J.M. , Hinrichs, K. , Hayes, J.M. , et al (2001) Signature lipids and stable carbon isotope analysis of octopus spring hyperthermophilic communities compared with those of Aquificales representatives. Appl Envi ron Microbiol 67: 5179–5189. [DOI] [PMC free article] [PubMed] [Google Scholar]
- Klatt, C.G. , Inskeep, W.P. , Herrgard, M.J. , Jay, Z.J. , Rusch, D.B. , Tringer, S.G. , et al (2013a) Community structure and function in high‐temperature chlorophototrophic microbial mats inhabiting diverse geothermal environments. Front Microbiol 4: 106. [DOI] [PMC free article] [PubMed] [Google Scholar]
- Klatt, C.G. , Liu, Z. , Ludwig, M. , Ku, M. , Jensen, S.I. , and Bryant, D.A. (2013b) Temporal metatranscriptomic patterning in phototrophic Chloroflexi inhabiting a microbial mat in a geothermal spring. ISME J 7: 1775–1789. [DOI] [PMC free article] [PubMed] [Google Scholar]
- Klatt, C.G. , Bryant, D.A. , and Ward, D.M. (2007) Comparative genomics provides evidence for the 3‐hydroxypropionate autotrophic pathway in filamentous anoxygenic phototrophic bacteria and in hot spring microbial mats. Environ Microbiol 9: 2067–2078. [DOI] [PubMed] [Google Scholar]
- Li, H. , Yang, Q. , Li, J. , Gao, H. , Li, P. , and Zhou, H. (2015) The impact of temperature on microbial diversity and AOA activity in the Tengchong geothermal field China. Sci Rep 5: 1–12. [DOI] [PMC free article] [PubMed] [Google Scholar]
- Madigan, M.T. , and Brock, T.D. (1977) Adaptation by hot spring phototrophs to reduced light intensities. Arch Microbiol 113: 111–120. [DOI] [PubMed] [Google Scholar]
- Madigan, M.T. , Jung, D.O. , Karr, E.A. , Sattley, M. , Achenbach, L.A. , and van der Meer, M.T.J. (2005). Diversity of anoxygenic phototrophs in contrasting extreme environments In Inskeep W.P. & McDermott T.R. (eds), Geothermal Biology and Geochemistry in Yellowstone National Park, (203–219). Montana State University, Bozeman, MT: Thermal Biology Institute. [Google Scholar]
- Madigan, M.T. , Takigiku, R. , Lee, R.G. , Gest, H. , and Hayes, J.M. (1989) Carbon isotope fractionation by thermophilic phototrophic sulfur bacteria: evidence for autotrophic growth in natural populations. Appl Environ Microbiol 55: 639–644. [DOI] [PMC free article] [PubMed] [Google Scholar]
- Matheus Carnevali, P.B. , Schulz, F. , Castelle, C.J. , Kantor, R.S. , Shih, P.M. , and Sharon, I. (2019) Hydrogen‐based metabolism as an ancestral trait in lineages sibling to the cyanobacteria. Nat Commun 10: 1–15. [DOI] [PMC free article] [PubMed] [Google Scholar]
- Miller, S.R. , Strong, A.L. , Jones, K.L. , and Ungerer, M.C. (2009) Bar‐coded pyrosequencing reveals shared bacterial community properties along the temperature gradients of two alkaline hot springs in Yellowstone National Park. Appl Environ Microbiol 75: 4565–4572. [DOI] [PMC free article] [PubMed] [Google Scholar]
- Monchamp, M.E. , Spaak, P. , and Pomati, F. (2019) High dispersal levels and lake warming are emergent drivers of cyanobacterial community assembly in peri‐alpine lakes. Sci Rep 9: 1–8. [DOI] [PMC free article] [PubMed] [Google Scholar]
- Nierychlo, M. , Miłobȩdzka, A. , Petriglieri, F. , McIlroy, B. , Nielsen, P.H. , and McIlroy, S.J. (2019) The morphology and metabolic potential of the Chloroflexi in full‐scale activated sludge wastewater treatment plants. FEMS Microbiol Ecol 95: 1–11. [DOI] [PubMed] [Google Scholar]
- Nübel, U. , Bateson, M.M. , Vandieken, V. , Wieland, A. , Ku, M. , and Ward, D.M. (2002) Microscopic examination of distribution and phenotypic properties of Phylogenetically diverse. Appl Environ Microbiol 68: 4593–4603. [DOI] [PMC free article] [PubMed] [Google Scholar]
- Pierson, B.K. , and Castenholz, R.W. (1974) A phototrophic gliding filamentous bacterium of hot springs, Chloroflexus aurantiacus, gen. And sp. nov. Arch Microbiol 100: 5–24. [DOI] [PubMed] [Google Scholar]
- R Core Team (2018) R: a language and environment for statistical computing. R Foundation for Statistical Computing. URL https://www.r-project.org/
- Rozanov, A.S. , Bryanskaya, A.V. , Ivanisenko, T.V. , Malup, T.K. , Peltek, S.E. (2017) Biodiversity of the microbial mat of the Garga hot spring. BMC Evol Biol 17, S2, 254. [DOI] [PMC free article] [PubMed] [Google Scholar]
- Saw, J.H.W. , Nunoura, T. , Hirai, M. , Takaki, Y. , Parsons, R. , and Michelsen, M. (2020) Pangenomics analysis reveals diversification of enzyme families and niche specialization in globally abundant SAR202 bacteria. MBio 11: 1–18. [DOI] [PMC free article] [PubMed] [Google Scholar]
- Schloss, P.D. , Westcott, S.L. , Ryabin, T. , Hall, J.R. , Hartmann, M. , Hollister, E.B. , et al (2009) Introducing mothur: open‐source, platform‐independent, community‐supported software for describing and comparing microbial communities. Appl Environ Microbiol 75: 7537–7541. [DOI] [PMC free article] [PubMed] [Google Scholar]
- Soo, R.M. , Skennerton, C.T. , Sekiguchi, Y. , Imelfort, M. , Paech, S.J. , and Dennis, P.G. (2014) An expanded genomic representation of the phylum yanobacteria. Genome Biol Evol 6: 1031–1045. [DOI] [PMC free article] [PubMed] [Google Scholar]
- Tank, M. , Thiel, V. , Ward, D.M. , and Bryant, D.A. (2017) A panoply of phototrophs: an overview of the thermophilic chlorophototrophs of the microbial mats of alkaline siliceous hot springs in Yellowstone National Park, WY, USA Marcus In Hallenbeck P. (eds), Modern Topics in the Phototrophic Prokaryotes: Environmental and Applied Aspects, pp. 87–137. Springer, Cham. [Google Scholar]
- Thiel, V. , Tank, M. , and Bryant, D.A. (2018) Diversity of chlorophototrophic bacteria revealed in the omics era. Annu Rev Plant Biol 69: 21–49. [DOI] [PubMed] [Google Scholar]
- Thiel, V. , Wood, J.M. , Olsen, M.T. , Tank, M. , Klatt, C.G. , and Ward, D.M. (2016) The dark side of the mushroom spring microbial mat: life in the shadow of chlorophototrophs. I. Microbial diversity based on 16S rRNA gene amplicons and metagenomic sequencing. Front Microbiol 7: 1–25. [DOI] [PMC free article] [PubMed] [Google Scholar]
- van der Meer, M.T.J. , Schouten, S. , de Leeuw, J.W. , and Ward, D.W. (2000a) Autotrophy of green nonsulfur bacteria in hot spring microbial mats: biological explanations for isotopically heavy organic carbon in the geological record. Environ Microbiol 2: 428–435. [DOI] [PubMed] [Google Scholar]
- van der Meer, M.T.J. , Schouten, S. , Rijpstra, W.I.C. , Fuchs, G. , Damste, J.S.S. (2000b), Stable carbon isotope fractionations of the hyperthermophilic crenarchaeon Metallosphaera sedula . FEMS Microbiol Lett., 196, 67–70. [DOI] [PubMed] [Google Scholar]
- Walter, J.M. , Coutinho, F.H. , Dutilh, B.E. , Swings, J. , Thompson, F.L. , and Thompson, C.C. (2017). Ecogenomics and taxonomy of Cyanobacteria phylum. Front Microbiol, 2132. [DOI] [PMC free article] [PubMed] [Google Scholar]
- Ward, D.M. , Bateson, M.M. , Ferris, M.J. , Wieland, A. , Koeppel, A. , and Cohan, F.M. (2006). Cyanobacterial ecotypes in the microbial mat community of Mushroom Spring (Yellowstone National Park, Wyoming) as species‐like units linking microbial community composition, structure and function. Phil. Trans. R. Soc. B, 361: 1997–2008. [DOI] [PMC free article] [PubMed] [Google Scholar]
- Ward, D.M. , Castenholz, R.W. , and Miller, S.R. (2012) Cyanobacteria in geothermal habitats In Ecology of Cyanobacteria II. Whitton B. (ed). Dordrecht: Springer. [Google Scholar]
- Ward, D.M. , Ferris, M.J. , and Bateson, M.M. (1998). A natural view of microbial biodiversity within hot spring cyanobacterial mat communities. Microbiology and Molecular Biology Reviews 62: 1353–1370. [DOI] [PMC free article] [PubMed] [Google Scholar]
- Ward, L.M. , Hemp, J. , Shih, P.M. , McGlynn, S.E. , and Fischer, W.W. (2018) Evolution of phototrophy in the Chloroflexi phylum driven by horizontal gene transfer. Front Microbiol 9: 1–16. [DOI] [PMC free article] [PubMed] [Google Scholar]
- Ward, L.M. , Idei, A. , Terajima, S. , Kakegawa, T. , Fischer, W.W. , and McGlynn, S.E. (2017) Microbial diversity and iron oxidation at Okuoku‐hachikurou Onsen, a Japanese hot spring analog of Precambrian iron formations. Geobiology 15: 817–835. [DOI] [PubMed] [Google Scholar]
- Ward, L.M. , Idei, A. , Nakagawa, M. , Ueno, Y. , Fischer, W.W. , and McGlynn, S.E. (2019a) Geochemical and metagenomic characterization of Jinata onsen, a proterozoic‐ analog hot spring, reveals novel microbial diversity including iron‐tolerant phototrophs and thermophilic lithotrophs. Microbes Environ. 34: 278–292. [DOI] [PMC free article] [PubMed] [Google Scholar]
- Ward, L.M. , Cardona, T. , and Holland‐moritz, H. (2019b) Evolutionary implications of anoxygenic phototrophy in the bacterial phylum Candidatus Eremiobacterota (WPS‐2). Front Micrbiol. 10: 1–12. [DOI] [PMC free article] [PubMed] [Google Scholar]
- Wickham, H. (2014). Tidy Data. Journal of Statistical Software, 59: 1–24. 10.18637/jss.v059.i10.26917999 [DOI] [Google Scholar]
- Wickham, H. (2016) ggplot2: Elegant Graphics for Data Analysis. New York: Springer‐Verlag. ISBN 978–3–319‐24277‐4. [Google Scholar]
- Yamada, T. , Sekiguchi, Y. , Hanada, S. , Imachi, H. , Ohashi, A. , and Harada, H. (2006) Anaerolinea thermolimosa sp. nov., Levilinea saccharolytica gen. nov., sp. nov. and Leptolinea tardivitalis gen. nov., sp. nov., novel filamentous anaerobes, and description of the new classes Anaerolineae classis nov. and Caldilineae classis nov. in the bacterial phylum Chloroflexi. Int J Syst Evol Microbiol 56: 1331–1340. [DOI] [PubMed] [Google Scholar]
Associated Data
This section collects any data citations, data availability statements, or supplementary materials included in this article.
Supplementary Materials
Fig. S1 Natural log relative abundance of OTUs < 0.1%. OTUs with counts <1% of the total count for each site were removed to prevent over plotting in Fig. 1. The log abundance of those OTUs are shown here for each site.
Fig. S2 Pearson correlation between Chloroflexi and Cyanobacteria richness and temperature. To test whether richness within the two dominant groups in our samples is linearly related to temperature, we conducted a Pearson correlation between number of distinct taxa and temperature using the package ggpubr in R. Black lines are the regression lines with corresponding R values and shaded grey regions indicate the 95% confidence interval. We conducted correlation analyses between richness in phototrophic Cyanobacteria (A), non‐phototrophic Chloroflexi (B) and phototrophic Chloroflexi (C) with temperature. There were not enough observations in the non‐phototrophic Chloroflexi group to conduct the analysis (11 observed taxa). Both Chloroflexi groups were not significantly correlated with temperature, while phototrophic Cyanobacteria richness was negatively correlated with temperature (A, p = 0.01).
Fig. S3 Biomass δ 13 C values versus in situ temperature. Carbon isotopic signatures were determined as previously described (Fig. 5). For each site, we have plotted the δ13C biomass signature versus site temperature.
Table S1. Site geochemistry. Samples for δ13C (n = 1 for each site) were collected using flame‐sterilized spatulas or forceps. Samples were placed in sterile 2.0‐ml vials and immediately frozen on dry ice and stored at −80°C until processing for C and δ13C analysis. Sulfide, Fe2+, and dissolved silica were measured onsite using a DR1900 portable spectrophotometer (Hach Company, Loveland, CO). Water samples were filtered through 0.2‐μm polyethersulfone syringe filters (VWR International, Radnor, PA, USA) and analysed for dissolved inorganic carbon (DIC) concentration and δ13C value as described previously (Havig et al. 2011). Field blanks comprised of filtered 18.2 MΩ/cm deionized water, transported to the field in 1‐l Nalgene bottles (acid washed as described above), were collected onsite using the equipment and techniques described above. All isotopic data are reported as isotope ratios, relative to standards of known value, using the equation [(isotope ratio of sample)/(isotope ratio of standard) − 1] × 1,000, expressed in delta notation (δ) and reported as per mil (‰). Carbon isotopic values are reported as isotopic ratios of 13C to 12C from the equation [(13C/12C of sample)/(13C/12C of standard) − 1] × 1,000 and expressed in delta notation (δ13C). δ13C values are reported using the Vienna Pee Dee Belemnite (VPDB) standard. The difference between DIC δ13C values and biomass δ13C values is expressed as Δ13C and represents the fractionation of 13C from the source inorganic carbon (DIC δ13C) and biomass δ13C values. BDL = below the limit of detection of the field spectrophotometer. Sample metadata has been submitted to NCBI with corresponding accession numbers (column 1).
Table S2. Sequences and OTUs recovered for each site. Total sequence reads for each site (column 1) are listed in column 2. 24186 OTUs were classified (at 99% sequence identity) in our analysis. To remove noise in the dataset, we omitted OTUs with counts <3, resulting in 2767 OTUs that were considered in this analysis. Total OTUs per site are listed in column 3.
Table S3. Raw rates of photosynthesis and pairwise comparison of means between light and DCMU treatments within sites. Uptake rates (g/h) are listed for each treatment (n = 3) in each site (n = 8). An analysis of variance was conducted followed by the post‐hoc Tukey's Honest Significant Difference test under the null hypothesis that light and light + DCMU 13C assimilation rates were not significantly different within sites (*p < 0.05).
Table S4. Pairwise comparison of light treatment rates from site to site and DCMU treatment rates from site to site. To test the hypothesis that photosynthetic rates differ from site to site down the temperature gradient, an analysis of variance was conducted followed by the post‐hoc Tukey's Honest Significant Difference test under the null hypothesis that light and dark rates are not significantly different between sites (see Table S3 and S4 for a list of pairwise comparisons and respective p‐values).