

Abstract
Introduction
Peripartum hysterectomy is a surgical procedure performed for severe obstetric complications such as major obstetric hemorrhage. The prevalence of peripartum hysterectomy in high‐resource settings is relatively low. Hence, international comparisons and studying indications and associations with mode of birth rely on the use of national obstetric survey data. Objectives were to calculate the prevalence and indications of peripartum hysterectomy and its association with national cesarean section rates and mode of birth in nine European countries.
Material and methods
We performed a descriptive, multinational, population‐based study among women who underwent peripartum hysterectomy. Data were collected from national or multiregional databases from nine countries participating in the International Network of Obstetric Survey Systems. We included hysterectomies performed from 22 gestational weeks up to 48 hours postpartum for obstetric hemorrhage, as this was the most restrictive, overlapping case definition between all countries. Main outcomes were prevalence and indications of peripartum hysterectomy. Additionally, we compared prevalence of peripartum hysterectomy between women giving birth vaginally and by cesarean section, and between women giving birth with and without previous cesarean section. Finally, we calculated correlation between prevalence of peripartum hysterectomy and national cesarean section rates, as well as national rates of women giving birth after a previous cesarean section.
Results
A total of 1302 peripartum hysterectomies were performed in 2 498 013 births, leading to a prevalence of 5.2 per 10 000 births ranging from 2.6 in Denmark to 10.7 in Italy. Main indications were uterine atony (35.3%) and abnormally invasive placenta (34.8%). Relative risk of hysterectomy after cesarean section compared with vaginal birth was 9.1 (95% CI 8.0‐10.4). Relative risk for hysterectomy for birth after previous cesarean section compared with birth without previous cesarean section was 10.6 (95% CI 9.4‐12.1). A strong correlation was observed between national cesarean section rate and prevalence of peripartum hysterectomy (ρ = 0.67, P < .05).
Conclusions
Prevalence of peripartum hysterectomy may vary considerably between high‐income countries. Uterine atony and abnormally invasive placenta are the commonest indications for hysterectomy. Birth by cesarean section and birth after previous cesarean section are associated with nine‐fold increased risk of peripartum hysterectomy.
Keywords: cesarean section, maternal morbidity, mode of birth, obstetric hemorrhage, peripartum hysterectomy
Abbreviations
- INOSS
International Network of Obsteric Survey Systems
Key message.
Peripartum hysterectomy rates vary considerably between high‐income countries and are associated with national cesarean section rates.
1. INTRODUCTION
Peripartum hysterectomy refers to surgical removal of the uterus during pregnancy or postpartum. 1 It is usually performed for severe obstetric complications such as major obstetric hemorrhage, abnormally invasive placenta, uterine rupture, or sepsis. Peripartum hysterectomy is defined by the World Health Organization as a maternal near‐miss criterion and used as a proxy for severe postpartum hemorrhage and therefore frequently used as an outcome of interest in obstetric surveillance. 2
The association between peripartum hysterectomy and cesarean section has previously been described, with relative risk for women giving birth by cesarean section ranging from 8.5 to 18.3. 3 , 4 , 5 , 6 , 7 , 8 In addition, pregnancy in a woman who gave birth by cesarean section previously is a risk factor for abnormally invasive placentation, which may in turn lead to hysterectomy. This risk is known to increase for every additional previous cesarean section. 9 Such associations are of particular interest in light of the rising cesarean section rates worldwide because these could potentially lead to increasing rates of peripartum hysterectomies as well.
Prevalence of peripartum hysterectomy in high‐resource settings is relatively low. 10 Hence, indications and outcomes are often studied retrospectively, or through national obstetric survey systems. 11 , 12 , 13 , 14 , 15 Multinational comparisons of prevalence and outcomes to optimize management strategies may be facilitated by international collaborations combining national data. 1 , 16
The main aim of this study was to compare the prevalence of peripartum hysterectomy between high‐income countries, as part of the International Network of Obstetric Survey Systems (INOSS). Secondary aims were to describe the indications for hysterectomy, and perform analyses of prevalence of peripartum hysterectomy stratified by mode of birth and previous cesarean section. In addition, we examined the correlation between national rates of peripartum hysterectomy and national cesarean section rates, and the rate of women giving birth after previous cesarean section.
2. MATERIAL AND METHODS
This was a descriptive, multinational, population‐based study. We used data from nine countries participating in INOSS that had previously conducted studies on peripartum hysterectomy. Most of these countries, except France and Slovakia, have previously published outcomes of peripartum hysterectomy surveillance. 11 , 12 , 13 , 14 , 15 , 17 , 18 , 19 , 20 INOSS is an international collaboration of national obstetric survey systems, aiming to increase knowledge of management of uncommon obstetric complications. 16 Participating in this study were: Slovak Obstetric Survey System (SOSS) in Slovakia, Italian Obstetric Surveillance System (ItOSS) in Italy, Belgian Obstetric Surveillance System (B.OSS) in Belgium, Épidémiologie de la Morbidité Maternelle Sévère (EPIMOMS) in France, Nordic Obstetric Surveillance System (NOSS) with data from Denmark, Finland and Sweden, Landelijke studie naar Etnische determinanten van Maternale Morbiditeit (LEMMoN) in the Netherlands, and United Kingdom Obstetric Surveillance System (UKOSS) in the UK. All were nationwide studies except for EPIMOMS in France, which included six regions (Alsace, Auvergne, Basse‐Normandie, Île‐de‐France, Lorraine, and Rhône‐Alpes) covering 20% of national births and ItOSS, which encompassed six regions (Piedmont, Emilia‐Romagna, Tuscany, Lazio, Campania, and Sicily) representing 49% of births in Italy.
Methods of data collection were described previously. 20 , 21 , 22 , 23 , 24 , 25 In brief, all countries performed national or multiregional survey studies in which women who underwent peripartum hysterectomy were identified. Identification of cases was performed in most countries by monthly communication (electronic database, mailing or paper) to appointed clinicians in each maternity unit. When a case was reported, further details were requested through a data collection form. To ensure completeness of data, regular reminders were sent and a ‘nothing to report’ response was requested. All data were collected prospectively, except for the data from Slovakia, which were collected retrospectively. Studies were performed during different periods, from August 2004 to August 2016. Validation and identification of additional cases were performed after cross‐checking health registers and hospital databases for the Nordic countries (Hospital Discharge Register, Medical Birth Register and delivery logbooks). Each country managed and cleaned their own database after which all anonymized databases were merged in Leiden, The Netherlands (see Supplementary material, Table S1).
In order to overcome differences in case selection between studies we applied a uniform case definition. Definitions used in the different survey studies were specified for inclusion criteria such as minimum gestational age, postpartum follow up, inclusion of non‐obstetric indications (such as malignancy), or other specific inclusion or exclusion criteria if present (such as including only cases of obstetric hemorrhage in Italy). To arrive at a uniform definition, the most restrictive definition was chosen to account for differences. We opted not to exclude hysterectomies in case of missing information regarding indication or gestational age, as it was postulated that the very few women who would have had an indication other than obstetric hemorrhage or a peripartum hysterectomy before 22 weeks of gestation would be greatly outnumbered by those with hemorrhage or hysterectomy ≥22 weeks. The most restrictive definition was defined as hysterectomies performed from the 22nd week of gestation up to 48 hours postpartum performed for obstetric hemorrhage (see Supplementary material, Table S2).
All countries provided background data on number of births during the study period. Background data differed between countries on the lower limit of gestational age, ranging from ≥22 weeks to 25+6 weeks (see Supplementary material, Table S1). For countries registering births ≥24 weeks, calculation of births ≥22 weeks was not possible. In a previous INOSS study, correction of background data resulted in minimal non‐significant differences because the proportion of births at those gestational ages was very low in all countries, so we decided not to perform such a correction. 26 Additionally, all countries provided aggregate data on national cesarean section rates, and numbers of cesarean sections and vaginal births. When actual numbers of cesarean section and vaginal births were unknown, these were estimated by multiplying the total number of births by the cesarean section rate. Numbers of women giving birth with and without previous cesarean section were calculated accordingly.
There were differences between studies in coding indications of hysterectomy. Some countries reported only one indication per hysterectomy whereas others coded all indications that arose during the process leading to hysterectomy. Therefore, we included the most important indication of those registered by applying a hierarchical system. From the indications listed, the one highest in rank was used. The hierarchy of indications, which was determined after reaching consensus among researchers of participating countries, in order of importance, was as follows: abnormally invasive placenta, placenta previa, uterine rupture, placental abruption, uterine atony, infection, cervical laceration, fibroids, unspecified hemorrhage, diffuse intravascular coagulation, and other.
Main outcomes were overall prevalence and indications of peripartum hysterectomy. Secondary outcomes were prevalence of peripartum hysterectomy for women giving birth vaginally and women who underwent cesarean section, and for women giving birth with and without previous cesarean section, with calculations of relative risk. Additionally, correlations between prevalence of peripartum hysterectomy and national cesarean section rates and national proportion of women giving birth after previous cesarean section were recorded.
2.1. Statistical analyses
Prevalence was calculated per 10 000 births with 95% CI or per 10 000 cesarean sections or vaginal births where appropriate. For calculation of relative risk, individual data were used from women with hysterectomy, but only aggregate data were available for women without hysterectomy. To adjust for weighting and clustering, calculation of total proportions and relative risks was done using a fixed‐effects model. Descriptive data are presented with mean (95% CI) or median (interquartile range) whenever appropriate. Proportions were calculated after subtracting the missing data from the totals, as they cannot be classified in either category of binary variables. Correlation between prevalence of peripartum hysterectomy and mode of birth and previous cesarean section rates per country were calculated using nonparametric Spearman rank order correlations (ρ). Results were considered statistically significant when P < .05. All analyses were performed using IBM SPSS Statistics version 18.0 (IBM Corp.), R version 6.3.6 (cran.r‐project.org) and Office excel 2019 (Microsoft Corp.).
2.2. ETHICAL APPROVAL
Due to the nature of this study, ethical approval was not required. Each study, from which data were used, was approved by their national or local ethics committee.
3. RESULTS
A total of 1393 peripartum hysterectomies were reported in the nine participating countries. During the study period, 2 498 013 births were registered. A total of 91 hysterectomies were excluded: 17 because the hysterectomy was performed at gestational age <22 weeks, 72 because of postpartum interval >48 hours, two hysterectomies because of indication other than obstetric hemorrhage (one gynecological malignancy and one necrotic uterus after uterine artery embolization). Using the uniform definition for all data sets, 1302 hysterectomies were included leading to a prevalence of 5.2 (95% CI 4.9‐5.5) per 10 000 births. Prevalence was highest in Italy with 10.7 (95% CI 9.8‐11.6) hysterectomies per 10 000 births and lowest in Denmark with 2.6 (CI 2.0‐3.5) hysterectomies per 10 000 births (Table 1, Figure 1). As the result of differences in the time period in which studies where performed, we compared countries that included cases before 2012 (The Netherlands, Denmark, the UK, Finland, Sweden) with countries that included cases starting in 2012 (Italy, France, Belgium, Slovakia). The prevalence was 3.7 (3.4‐4.0) vs 7.3 (6.8‐7.9) per 10 000 births, respectively.
TABLE 1.
Prevalence of peripartum hysterectomy using national definitions and after use of uniform definition
| Countries (study) | PRH (n) | Births (n) | Prevalence per 10 000 births (95% CI) | PRH uniform definition (n) | Prevalence ‐uniform definition per 10 000 births (95% CI) |
|---|---|---|---|---|---|
|
Denmark (NOSS) Apr 2009‐Dec 2011 |
50 | 168 170 | 3.0 (2.3‐3.9) | 44 | 2.6 (2.0‐3.5) |
| Netherlands (LEMMon) | 110 | 358 874 | 3.1 (2.5‐3.7) | 95 | 2.7 (2.2‐3.2) |
|
Belgium (B.OSS) Jan 2012‐Dec 2013 |
84 | 252 272 | 3.3 (2.7‐4.1) | 73 | 2.9 (2.3‐3.6) |
|
Sweden (NOSS) Sep 2009‐Aug 2011 |
52 | 175 575 | 3.0 (2.3‐3.9) | 52 | 3.0 (2.3‐3.9) |
|
UK (UKOSS) Feb 2005‐Feb 2006 |
315 | 609 300 | 5.2 (4.6‐5.8) | 276 | 4.5 (4.0‐5.0) |
|
Finland (NOSS) Apr 2009‐Aug 2011 |
74 | 145 546 | 5.1 (4.1‐6.4) | 72 | 5.0 (3.9‐6.2) |
|
France (EPIMOMS) May 2012‐Nov 2013 |
104 | 182 309 | 5.7 (4.7‐6.9) | 98 | 5.4 (4.4‐6.6) |
|
Slovakia (SOSS) Jan 2012‐Dec 2014 |
104 | 146 972 | 7.1 (5.8‐8.6) | 103 | 7.0 (5.8‐8.5) |
| Italy (ITOSS) Sep 2014‐Aug 2016 | 500 | 458 995 | 10.9 (10.0‐11.9) | 489 | 10.7 (9.8‐11.6) |
| Total | 1 393 | 2 498 013 | 1 302 | 5.2 (4.9‐5.5) |
Abbreviations: CI, confidence interval; PRH, peripartum hysterectomy.
FIGURE 1.

Prevalence of peripartum hysterectomy
Overall, background characteristics such as maternal age, parity, and body mass index were comparable between countries (Table 2). A total of 996/1292 (77.1%) women gave birth by cesarean section and 452/770 (58.7%) were planned. Moreover, 586/1177 (49.8%) women had given birth by cesarean section in a previous pregnancy.
TABLE 2.
Maternal and pregnancy characteristics at time of peripartum hysterectomy
| Women's characteristics | Belgium (n = 73) | Denmark (n = 44) | Finland (n = 72) | France (n = 98) | UK (n = 276) | Italy (n = 489) | Netherlands (n = 95) | Slovakia (n = 103) | Sweden (n = 52) | TOTAL (n = 1302) |
|---|---|---|---|---|---|---|---|---|---|---|
| Maternal age, years | 34.6 ± 4.4 | 33.7 ± 5.2 | 34.2 ± 5.1 | 34.4 ± 6.0 | 34.0 ± 5.4 | 35.6 ± 5.7 | 34.3 ± 4.3 | 31.7 ± 5.5 | 34.2 ± 4.9 | 34.5 ± 5.5 |
| Missing, n (%) | 0 (0.0) | 0 (0.0) | 0 (0.0) | 0 (0.0) | 0 (0.0) | 5 (1.0) | 0 (0.0) | 3 (2.9) | 0 (0.0) | 8 (0.6) |
| BMI, kg/m2 | 24.6 ± 4.5 | 26.1 ± 5.5 | 24.9 ± 5.5 | 24.9 ± 5.4 | 26.7 ± 5.7 | 24.9 ± 4.5 | 24.9 ± 6.1 | 27.1 ± 3.8 | 28.0 ± 5.9 | 25.6 ± 5.2 |
| Missing, n (%) | 14 (19.2) | 2 (4.5) | 2 (2.8) | 8 (8.2) | 36 (13.0) | 71 (14.7) | 31 (32.6) | 8 (7.8) | 7 (13.5) | 180 (13.8) |
| Parity, n (%) | ||||||||||
| Primiparous | 10 (13.7) | 12 (27.3) | 19 (26.4) | 25 (26.0) | 33 (12.0) | 145 (31.5) | 16 (16.8) | 18 (18.0) | 10 (19.2) | 288/1269 (22.7) |
| Multiparous | 63 (86.3) | 32 (72.7) | 53 (73.6) | 71 (74.0) | 243 (88.0) | 316 (68.5) | 79 (83.2) | 82 (82.0) | 42 (80.8) | 981/1269 (77.3) |
| Missing, n (%) | 0 (0.0) | 0 (0.0) | 0 (0.0) | 2 (2.0) | 0 (0.0) | 28 (5.7) | 0 (0.0) | 3 (2.9) | 0 (0.0) | 33 (2.5) |
| Mode of birth, n (%) | ||||||||||
| Cesarean section | 49 (68.1) | 36 (81.8) | 52 (72.2) | 67 (68.4) | 226 (81.9) | 410 (84.5) | 59 (62.1) | 51 (52.0) | 46 (88.5) | 996/1202 (77.1) |
| Vaginal birth | 23 (31.9) | 8 (18.2) | 20 (27.8) | 31 (31.6) | 50 (18.1) | 75 (15.5) | 36 (37.9) | 47 (48) | 6 (11.5) | 296/1202 (22.9) |
| Missing | 1 (1.4) | 0 (0.0) | 0 (0.0) | 0 (0.0) | 0 (0.0) | 4 (0.8) | 0 (0.0) | 5 (4.9) | 0 (0.0) | 10 (0.8) |
| Planned cesarean section, n (%) a | 13(26.5) | 15 (41.7) | 28 (53.8) | 43 (64.2) | N/A | 285 (69.5) | 11 (18.6) | 26 (51.0) | 31 (67.4) | 452/907 (58.7) |
| Missing, n (%) | 1 (1.4) | 0 (0.0) | 0 (0.0) | 0 (0.0) | N/A | 88 (18.0) | 0 (0.0) | 0 (0.0) | 0 (0.0) | 89 (6.8) |
| Gestational age, weeks, n (%) | ||||||||||
| 22+0‐23+6 | 1 (1.4) | 0 (0.0) | 0 (0) | 1 (1.0) | 0 (0.0) | 2 (0.4) | 1 (1.1) | 0 (0.0) | 0 (0.0) | 5/992 (0.4) |
| 24+0‐31+6 | 9 (12.3) | 2 (4.5) | 4 (5.6) | 6 (6.1) | 24 (8.9) | 31 (6.8) | 5 (5.3) | 11 (11.1) | 3 (5.8) | 95/992 (7.5) |
| 32+0‐36+6 | 23 (31.5) | 13 (29.5) | 20 (27.8) | 22 (22.4) | 80 (29.5) | 166 (36.2) | 16 (16.8) | 26 (25.7) | 21 (40.4) | 387/992 (30.7) |
| ≥37+0 | 40 (54.8) | 29 (65.9) | 48 (66.7) | 69 (70.4) | 167 (61.6) | 259 (56.6) | 73 (76.8) | 62 (61.4) | 28 (53.8) | 775/992 (61.4) |
| Missing, n (%) | 0 (0.0) | 0 (0.0) | 0 (0.0) | 0 (0.0) | 5 (1.8) | 31 (6.3) | 0 (0.0) | 4 (3.9) | 0 (0.0) | 40 (3.1) |
| Previous cesarean section, n (%) | 36 (50.0) | 25 (56.8) | 24 (33.3) | 36 (37.9) | 149 (54.0) | 228 (51.0) | 40 (42.1) | 20 (83.3) | 28 (53.8) | 586/1177 (49.8) |
| Missing, n (%) | 1 (1.4) | 0 (0.0) | 0 (0.0) | 3 (3.1) | 0 (0.0) | 42 (8.6) | 0 (0.0) | 79 (76.7) | 0 (0.0) | 125 (9.6) |
All data are presented as n (%) or mean ± standard deviation unless otherwise specified. Percentages are calculated after subtracting missing data.
Presented as percentage of number of cesarean sections.
In 670 women multiple indications were coded before use of the hierarchical system. Commonest indication was uterine atony for 459 women (35.3%) followed by abnormally invasive placenta for 453 women (34.8%), and uterine rupture in 98 women (7.5%). Observed frequencies for abnormally invasive placenta indication varied from 14/73 (19.2%) in Belgium up to 26/52 (50%) in Sweden. Hysterectomy in case of placenta previa only was not performed at all in Belgium and Denmark whereas this was the indication in 41/276 (14.9%) of women in the UK. Hemorrhage due to cervical lacerations was notably higher in Denmark (6/44) compared with other countries (Table 3).
TABLE 3.
Most important indication for peripartum hysterectomy presented as n (%)
| Indications of hysterectomy | Belgium (n = 73) | Denmark (n = 44) | Finland (n = 72) | France (n = 98) | UK (n = 276) | Italy (n = 489) | Netherlands (n = 95) | Slovakia (n = 103) | Sweden (n = 52) | Total (n = 1302) |
|---|---|---|---|---|---|---|---|---|---|---|
| Uterine atony | 29 (39.7%) | 12 (27.3%) | 17(23.6%) | 42 (42.9%) | 98 (35.5%) | 199 (40.7%) | 34 (35.8%) | 18 (17.5%) | 10 (19.2%) | 459 (35.3%) |
| Abnormally invasive placenta | 14 (19.2%) | 17(38.6%) | 16 (22.2%) | 23 (23.5%) | 103 (37.3%) | 188 (38.4%) | 36 (37.9%) | 30 (29.1%) | 26 (50%) | 453 (34.8%) |
| Uterine rupture | 10 (13.7%) | 2 (4.5%) | 17 (23.6%) | 9 (9.2%) | 17 (6.2%) | 14 (2.9%) | 10 (10.5%) | 16 (15.5%) | 3 (5.8%) | 98 (7.5%) |
| Unspecified hemorrhage | 5 (6.8%) | 0 | 11 (15.3%) | 2 (2%) | 0 | 44 (9%) | 8 (8.4%) | 16 (15.5%) | 7 (13.5%) | 93 (7.1%) |
| Placenta previa | 0 | 0 | 9(12.5%) | 2 (2%) | 41 (14.9%) | 15 (3.1%) | 4 (4.2%) | 11 (10.7%) | 2 (3.8%) | 84 (6.5%) |
| Placental abruption | 0 | 2 (4.5%) | 0 | 6 (6.1%) | 2 (0.7%) | 20 (4.1%) | 0 | 2 (1.9%) | 2 (3.9%) | 34 (2.6%) |
| Cervical laceration | 0 | 6 (13.6%) | 2 (2.8%) | 0 | 2 (0.7%) | 4 (0.8%) | 1 (1.1%) | 0 | 0 | 15 (1.2%) |
| Fibroids | 0 | 2 (4.5%) | 0 | 0 | 1 (0.4%) | 2 (0.4%) | 1 (1.1%) | 0 | 2 (3.8%) | 8 (0.6%) |
| DIC | 0 | 0 | 0 | 6 (6.1%) | 1 (0.4%) | 1 (0.2%) | 0 | 0 | 0 | 8 (0.6%) |
| Infection | 0 | 0 | 0 | 1 (1%) | 0 | 0 | 1 (1.1%) | 0 | 0 | 2 (0.2%) |
| Other | 2 (2.7%) | 3 (6.8%) | 0 | 7 (7.1%) | 8 (2.9%) | 2 (0.4%) | 0 | 3 (2.9%) | 0 | 25 (1.9%) |
| Missing | 13 (17.8%) | 0 | 0 | 0 | 3 (1.1%) | 0 | 0 | 7 (6.8%) | 0 | 23 (1.8%) |
Abbreviations: DIC, disseminated intravascular coagulopathy.
Prevalence of peripartum hysterectomy after cesarean section was highest in Italy with 23.2 per 10 000 cesarean sections (95% CI 21.1‐25.6) and lowest in Belgium with 9.0 per 10 000 cesarean sections (95% CI 6.8‐11.9). Following vaginal birth, prevalence was highest in Slovakia with 4.6 per 10 000 births (95% CI 3.5‐6.1) and lowest in Sweden with 0.4 per 10 000 births (95% CI 0.2‐0.9). Overall relative risk for hysterectomy after cesarean section compared with vaginal birth was 9.1 (95% CI 8.0‐10.4) (Table 4). Relative risk ranged from 2.5 (95% CI 1.7‐3.7) in Slovakia to 38.2 (95% 16.3‐89.5) in Sweden, in the latter country this being due to a very low incidence after vaginal birth. Because of the unknown number of planned cesarean hysterectomies in case of suspected abnormally invasive placenta, calculations were repeated after excluding women with hysterectomy for abnormally invasive placenta. Relative risk of peripartum hysterectomy in women who gave birth by cesarean section vs those who gave birth vaginally was 6.8 (95% CI 5.9‐8.0) per 10 000 births (see Supplementary material, Table S3). There was a strong, positive correlation between national cesarean section rate and prevalence of peripartum hysterectomy (ρ = 0.67, n = 9, P < .05) (Figure 2).
TABLE 4.
Relative risk of peripartum hysterectomy for cesarean section compared with vaginal birth
| Country | Cesarean section rate (%) | Cesarean section | Vaginal birth | Relative risk | ||||
|---|---|---|---|---|---|---|---|---|
| Number of PRH | Number of CS | Prevalence a (95% CI) | Number of PRH | Number of vaginal births | Prevalence a (95% CI) | |||
| Belgium | 21.5 | 49 | 54 369 | 9.0 (6.8‐11.9) | 23 | 197 903 | 1.2 (0.7‐1.7) | 7.8 (4.7‐12.7) |
| Denmark | 21.3 | 36 | 35 821 | 10.1 (7.3‐13.9) | 8 | 132 349 | 0.6 (0.3‐1.2) | 16.6 (7.7‐35.8) |
| Finland | 16.2 | 52 | 23 542 | 22.1 (16.9‐29.0) | 20 | 122 004 | 1.6 (1.1‐2.6) | 13.5 (8.0‐22.6) |
| France | 21.5 | 67 | 39 194 | 17.1 (13.5‐21.7) | 31 | 143 115 | 2.2 (1.5‐3.1) | 7.9 (5.2‐12.1) |
| Italy | 38.5 | 410 | 176 713 | 23.2 (21.1‐25.6) | 75 | 282 282 | 2.6 (2.1‐3.3) | 8.8 (6.8‐11.2) |
| The Netherlands | 15.0 | 59 | 53 762 | 11.0 (8.5‐14.2) | 36 | 305 112 | 1.2 (0.9‐1.6) | 9.3 (6.1‐14.1) |
| Slovakia | 30.5 | 51 | 44 826 | 11.4 (8.7‐15.0) | 47 | 102 146 | 4.6 (3.5‐6.1) | 2.5 (1.7‐3.7) |
| Sweden | 16.7 | 46 | 29 327 | 15.7 (11.8‐20.9) | 6 | 146 248 | 0.4 (0.2‐0.9) | 38.2 (16.3‐89.5) |
| United Kingdom | 23.5 | 226 | 143 185 | 15.8 (13.9‐18.0) | 50 | 466 115 | 1.1 (0.8‐1.4) | 14.7 (10.8‐20.0) |
| Total | 24.0 | 996 | 600 739 | 296 | 1 897 274 | 9.1 (8.0‐10.4) | ||
Abbreviations: CI, confidence Interval; CS, cesarean sections; PRH, peripartum hysterectomy.
Prevalence per 10 000 births or cesarean sections.
FIGURE 2.

Correlation of prevalence of peripartum hysterectomy with national cesarean section rates. *PRH, peripartum hysterectomy
Prevalence of peripartum hysterectomy in women with previous cesarean section varied from 10.7 per 10 000 births (95% CI 7.9‐14.6) in the Netherlands to 36.7 (95% CI 31.3‐43.1) in the UK. In women without previous cesarean section, prevalence varied considerably less, ranging from 1.3 per 10 000 births (95% CI 0.8‐2.0) in Denmark to 3.7 per 10 000 births in Finland and France. Overall relative risk for peripartum hysterectomy in women who had given birth by cesarean section in a previous pregnancy compared with women without a previous cesarean section this was 10.6 (95% CI 9.4‐12.1) (Table 5). After excluding women with hysterectomy for abnormally invasive placenta this relative risk was still 6.4 (95% CI 5.5‐7.6) per 10 000 births (see Supplementary material, Table S4). A statistically non‐significant weak correlation was observed between national proportions of women giving birth with a previous cesarean section and national prevalence of pregnancy‐related hysterectomy (ρ = 0.26, n = 8, P = .5) (Figure 3).
TABLE 5.
Relative risk of peripartum hysterectomy for women with vs without previous cesarean section
| Country | % of women with previous CS | With previous cesarean section | Without previous cesarean section | Relative risk | ||||
|---|---|---|---|---|---|---|---|---|
| PRH (n) | Births (n) | Prevalence (95% CI) a | PRH (n) | Births (n) | Prevalence (95% CI) a | |||
| Belgium | 10.7 | 36 | 27 007 | 13.3 (9.6‐18.5) | 36 | 225 265 | 1.6 (1.2‐2.2) | 8.3 (5.3‐13.2) |
| Denmark | 11.6 | 25 | 19 626 | 12.7 (8.6‐18.8) | 19 | 148 544 | 1.3 (0.8‐2.0) | 10.0 (5.5‐18.1) |
| Finland | 9.7 | 24 | 14 167 | 16.9 (11.4‐25.2) | 48 | 131 379 | 3.7 (2.8‐4.8) | 4.6 (2.8‐7.6) |
| France | 12.3 | 36 | 22 424 | 16.1 (11.6‐22.2) | 59 | 159 885 | 3.7 (2.9‐4.8) | 4.4 (2.9‐6.6) |
| Italy | 16.8 | 228 | 77 111 | 29.6(25.9‐33.7) | 74 | 381 884 | 1.9(1.5‐2.4) | 13.9 (10.7‐18.1) |
| Netherlands | 10.4 | 40 | 37 343 | 10.7 (7.9‐14.6) | 55 | 321 531 | 1.7 (1.3‐2.2) | 6.3 (4.2‐9.4) |
| Slovakia | Data not available | |||||||
| Sweden | 8.9 | 28 | 15 698 | 17.8 (12.3‐25.8) | 24 | 159 877 | 1.5 (1.0‐2.2) | 11.9 (6.9‐20.5) |
| United Kingdom | 6.6 | 149 | 40 600 | 36.7 (31.3‐43.1) | 127 | 568 700 | 2.2 (1.9‐2.7) | 16.4 (13.0‐20.8) |
| Total | 10.9 | 566 | 253 976 | 442 | 2 097 065 | 10.6 (9.4‐12.1) | ||
Abbreviations: CI, confidence interval; CS, cesarean section; PRH, peripartum hysterectomy.
Prevalence per 10 000 births or cesarean sections.
FIGURE 3.
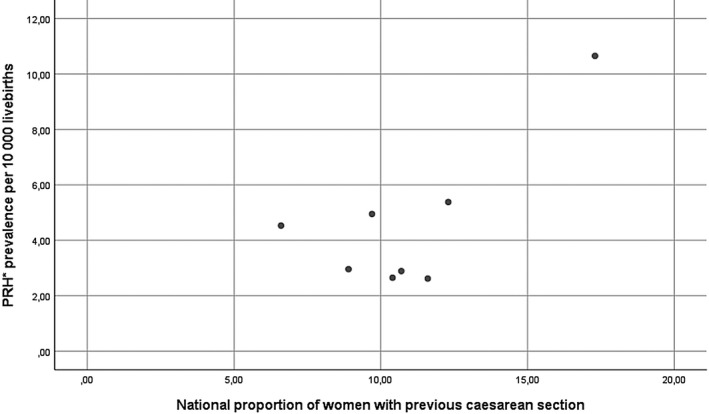
Correlation of prevalence of peripartum hysterectomy with national rates of women with previous cesarean section. *PRH, peripartum hysterectomy
4. DISCUSSION
The prevalence of peripartum hysterectomy varied significantly in nine European countries. Prevalence was considerably higher in women giving birth by cesarean section and in women who had given birth by cesarean section in a previous pregnancy. Additionally, indications for hysterectomy also varied notably between countries and considerable variance was observed for all reported indications. Such differences may result from differences in women’s characteristics, national cesarean section rates, and national rates of pregnant women with scarred uteri. Such differences may also reflect differences in clinical management of major obstetric hemorrhage between participating countries.
Compared with a systematic review and meta‐analysis where weighted prevalence for upper‐ and high‐income countries was calculated at 7 per 10 000 births, our study demonstrated lower prevalence for all countries except Italy. 10 Another study on emergency peripartum hysterectomy in high‐income countries, reported prevalence for most European countries <10 per 10 000 births, in line with our results. 8
We found a nine‐fold higher risk of hysterectomy after cesarean section. However, 77% of women undergoing hysterectomy were delivered by cesarean section and more than half of these were planned. Reason for this may be antenatal diagnosis of placenta previa with or without abnormally invasive placenta, in which case vaginal birth is not an option and risk of hysterectomy is very high. 27 The number of planned cesarean hysterectomies was not known. Therefore, we repeated calculations after excluding women who had hysterectomy for abnormally invasive placenta, which was the second most frequent indication among all hysterectomies. In these women, it is the indication for the cesarean section that places them at increased risk of hysterectomy rather than the indication itself. Some of these hysterectomies might in fact have been planned before birth. However, even following exclusion of women with abnormally invasive placenta, the prevalence of hysterectomy after cesarean section and in birth following a previous cesarean section both remained significantly higher. Our results are in line with literature, where cesarean section is a strong risk factor for emergency peripartum hysterectomy. 8 Increased risk of hysterectomy after previous cesarean section has been shown before and was demonstrated to be independent of the intended mode of birth. 8 , 28 As such, the variance of prevalence between countries might, to a considerable extent, be explained by the difference in national cesarean section rates.
The strength of this study is its unique multinational character including data from nine nationwide or multiregional studies. Collaboration between national and multiregional obstetric survey systems previously led to insights into prevalence and management of uterine rupture. 26 The INOSS collaboration enables the collection of considerably robust data regarding rare obstetric diseases.
Main limitations arise from the fact that included studies were performed in different time intervals, over 2 or 3 consecutive years with little or no overlap. Obstetric practice and risk factors such as cesarean section rates might have changed over time. 8 , 13 , 29 Data stratified by year would reflect differences between studies rather than being indicative of changes in practice over time. However, pooling data from recent and older studies showed a marked difference in prevalence of hysterectomy which, in light of other evidence, may be the result of rising cesarean section rates. Furthermore, there were 40 registered hysterectomies with missing information on gestational age. Given the fact that only 1% of all hysterectomies in the database were excluded because of a gestational age <22 weeks, we opted that excluding these cases would lead to exclusion of actually valid cases, which would lead to underestimation of prevalence. Also, a previous cesarean section is strongly associated with birth by cesarean in the index pregnancy. In the calculation of the correlation between prevalence of hysterectomy and mode of birth, previous cesarean section should be taken into consideration. As such, calculation of adjusted relative risks for each exposure would have led to better estimation of the independent role of each of them. However, for the background data we only had aggregate numbers for mode of birth and for previous cesarean section and could not perform such analysis. Accordingly, in the correlation of prevalence of peripartum hysterectomy with previous cesarean section, taking parity into account would lead to more valid results. Also, the number of previous cesarean sections adds up to the risk of hysterectomy and other serious morbidity with every additional operation, as previously described. 9 Unfortunately, in our database we only had access to binary information on presence of a previous cesarean section. Therefore, the effect of number of previous cesareans was not measured. Another limitation is the fact that case identification and study objectives differed between countries. Seven of nine studies were designed specifically to report peripartum hysterectomy whereas the studies from the Netherlands and France included women with severe maternal morbidity. In Slovakia, data were collected retrospectively, which may have led to some underreporting. Nonetheless, their numbers still gave them the second highest prevalence; actual prevalence may have been even higher.
For enhanced comparability of national survey studies, collectively designed surveillance studies using uniform criteria are required and INOSS may provide an important platform to perform such studies. In addition, use of a uniform definition for upcoming studies is important. Therefore, INOSS proposed a definition of ‘pregnancy‐related hysterectomy’ using a Delphi process: 1 “Surgical removal of the uterus during pregnancy or up to 42 days postpartum”. This definition is wide enough to include all indications and pregnancy intervals. As our specific study includes only a subset of women who had a hysterectomy around the time of birth, we decided to apply the common terminology “peripartum hysterectomy” in this paper. Streamlining multiple national surveys is necessary to overcome problems related to different study intervals.
5. CONCLUSION
Prevalence of peripartum hysterectomy varied widely between countries and was higher in countries with higher cesarean section rates. Commonest indications were uterine atony and abnormally invasive placenta. Rate of peripartum hysterectomy was considerably higher in women who gave birth by cesarean section as well as in women with a previous cesarean section. Further investigation is necessary to fully understand the underlying factors that contribute to these differences. Further work is needed to determine optimal management strategies and comparison of those strategies between countries.
CONFLICT OF INTEREST
None.
Supporting information
Table S1
Table S2
Table S3
Table S4
ACKNOWLEDGMENTS
We thank Ms Bente Elgersma for her contribution to building the database. The Netherlands: NethOSS board Kitty Bloemenkamp (also INOSS chair), Jos van Roosmalen, Timme Schaap, Thomas van den Akker, Joost Zwart. We would like to acknowledge all clinicians reporting data to the LEMMoN study between 2004 and 2006. Italy: We would like to acknowledge all clinicians reporting data to the ItOSS study. Finland: Kati Ojala (Oulu University Hospital); Maija‐Riitta Ordén (Kuopio University Hospital), Nanneli Pallasmaa (Turku University Hospital) and Outi Palomäki (Tampere University Hospital), Anna‐Maija Tapper (HUCH Hyvinkää Hospital), Outi Äyräs (Helsinki University Hospital). Sweden: Karin Källén, Karin Gottvall and all clinicians reporting to the NOSS study between 2009 and 2011. France: Epimoms study, all clinicians and research staff who contributed to case identification and data collection. We also want to thank all clinicians who contributed to case identification and data collection in the UK, Denmark, Slovakia and Belgium. Permission has been obtained from all named persons.
Kallianidis AF, Maraschini A, Danis J, et al; on behalf of INOSS (the International Network of Obstetric Survey Systems) . Epidemiological analysis of peripartum hysterectomy across nine European countries. Acta Obstet Gynecol Scand. 2020;99:1364–1373. 10.1111/aogs.13892
REFERENCES
- 1. Schaap T, Bloemenkamp K, Deneux‐Tharaux C, et al. Defining definitions: a Delphi study to develop a core outcome set for conditions of severe maternal morbidity. BJOG. 2019;126:394‐401. [DOI] [PubMed] [Google Scholar]
- 2. Evaluating the quality of care for severe pregnancy complications: the WHO near‐miss approach for maternal health. http://apps.who.int/iris/bitstream/10665/44692/1/9789241502221_eng.pdf; 2011.
- 3. Flood KM, Said S, Geary M, Robson M, Fitzpatrick C, Malone FD. Changing trends in peripartum hysterectomy over the last 4 decades. Am J Obstet Gynecol. 2009;200(632):e1–6. [DOI] [PubMed] [Google Scholar]
- 4. Huque S, Roberts I, Fawole B, Chaudhri R, Arulkumaran S, Shakur‐Still H. Risk factors for peripartum hysterectomy among women with postpartum haemorrhage: analysis of data from the WOMAN trial. BMC Pregnancy Childbirth. 2018;18:186. [DOI] [PMC free article] [PubMed] [Google Scholar]
- 5. Whiteman MK, Kuklina E, Hillis SD, et al. Incidence and determinants of peripartum hysterectomy. Obstet Gynecol. 2006;108:1486‐1492. [DOI] [PubMed] [Google Scholar]
- 6. Kwee A, Bots ML, Visser GH, Bruinse HW. Emergency peripartum hysterectomy: a prospective study in The Netherlands. Eur J Obstet Gynecol Reprod Biol. 2006;124:187‐192. [DOI] [PubMed] [Google Scholar]
- 7. Sakse A, Weber T, Nickelsen C, Secher NJ. Peripartum hysterectomy in Denmark 1995–2004. Acta Obstet Gynecol Scand. 2007;86:1472‐1475. [DOI] [PubMed] [Google Scholar]
- 8. de la Cruz CZ, Thompson EL, O'Rourke K, Nembhard WN. Cesarean section and the risk of emergency peripartum hysterectomy in high‐income countries: a systematic review. Arch Gynecol Obstet. 2015;292:1201‐1215. [DOI] [PubMed] [Google Scholar]
- 9. Silver RM, Landon MB, Rouse DJ, et al. Maternal morbidity associated with multiple repeat cesarean deliveries. Obstet Gynecol. 2006;107:1226‐1232. [DOI] [PubMed] [Google Scholar]
- 10. van den Akker T, Brobbel C, Dekkers OM, Bloemenkamp KW. Prevalence, indications, risk indicators, and outcomes of emergency peripartum hysterectomy worldwide: a systematic review and meta‐analysis. Obstet Gynecol. 2016;128:1281‐1294. [DOI] [PubMed] [Google Scholar]
- 11. Jakobsson M, Tapper A‐M, Colmorn LB, et al. Emergency peripartum hysterectomy: results from the prospective Nordic Obstetric Surveillance Study (NOSS). Acta Obstet Gynecol Scand. 2015;94:745‐754. [DOI] [PubMed] [Google Scholar]
- 12. Knight M. Ukoss. Peripartum hysterectomy in the UK: management and outcomes of the associated haemorrhage. BJOG. 2007;114:1380‐1387. [DOI] [PubMed] [Google Scholar]
- 13. Vandenberghe G, Guisset M, Janssens I, et al. A nationwide population‐based cohort study of peripartum hysterectomy and arterial embolisation in Belgium: results from the Belgian Obstetric Surveillance System. BMJ Open. 2017;7:e016208. [DOI] [PMC free article] [PubMed] [Google Scholar]
- 14. Zwart JJ, Dijk PD, van Roosmalen J. Peripartum hysterectomy and arterial embolization for major obstetric hemorrhage: a 2‐year nationwide cohort study in the Netherlands. Am J Obstet Gynecol. 2010;202(150):e1‐7. [DOI] [PubMed] [Google Scholar]
- 15. Kristufkova A, Krobel M, Borovosky M, Danis J, Dugatova M. Analysis of severe acute maternal morbidity in Slovak Republic in year 2012. Gynekol prax. 2015;13:185‐191. [Google Scholar]
- 16. Knight M, INOSS . The International Network of Obstetric Survey Systems (INOSS): benefits of multi‐country studies of severe and uncommon maternal morbidities. Acta Obstet Gynecol Scand. 2014;93:127‐131. [DOI] [PubMed] [Google Scholar]
- 17. Kristufkova A, Krobel M, Danis J, Dugatova M, Nemethova B, Borovosky M. Analysis of severe acute maternal morbidity in Slovak Republic in year 2013. Gynekol prax. 2016;14:92‐98. [Google Scholar]
- 18. Kristufkova A, Krobel M, Danis J, Dugatova M, Nemethova B, Borovosky M. Analysis of severe acute maternal morbidity in Slovak Republic in year 2014. Gynekol prax. 2017;15:25‐32. [Google Scholar]
- 19. Maraschini A, Lega I, D'Aloja P, et al. Women undergoing peripartum hysterectomy due to obstetric hemorrhage: a prospective population‐based study. Acta Obstet Gynecol Scand. 2020;99:274‐282. [DOI] [PubMed] [Google Scholar]
- 20. Colmorn LB, Petersen KB, Jakobsson M, et al. The Nordic Obstetric Surveillance Study: a study of complete uterine rupture, abnormally invasive placenta, peripartum hysterectomy, and severe blood loss at delivery. Acta Obstet Gynecol Scand. 2015;94:734‐744. [DOI] [PubMed] [Google Scholar]
- 21. Blondel B, Coulm B, Bonnet C, Goffinet F, Le Ray C , National Coordination Group of the National Perinatal Surveys . Trends in perinatal health in metropolitan France from 1995 to 2016: results from the French National Perinatal Surveys. J Gynecol Obstet Hum Reprod. 2017;46:701‐713. [DOI] [PubMed] [Google Scholar]
- 22. Zwart JJ, Richters JM, Ory F, de Vries JI, Bloemenkamp KW, van Roosmalen J. Severe maternal morbidity during pregnancy, delivery and puerperium in the Netherlands: a nationwide population‐based study of 371,000 pregnancies. BJOG. 2008;115:842‐850. [DOI] [PubMed] [Google Scholar]
- 23. Vandenberghe G, Roelens K, Van Leeuw V, Englert Y, Hanssens M, Verstraelen H. The Belgian Obstetric Surveillance System to monitor severe maternal morbidity. Facts Views Vis Obgyn. 2017;9:181‐188. [PMC free article] [PubMed] [Google Scholar]
- 24. Knight M, Kurinczuk JJ, Tuffnell D, Brocklehurst P. The UK obstetric surveillance system for rare disorders of pregnancy. BJOG. 2005;112:263‐265. [DOI] [PubMed] [Google Scholar]
- 25. Madar H, Goffinet F, Seco A, Rozenberg P, Dupont C, Deneux‐Tharaux C. Severe acute maternal morbidity in twin compared with singleton pregnancies. Obstet Gynecol. 2019;133:1141‐1150. [DOI] [PubMed] [Google Scholar]
- 26. Vandenberghe G, Bloemenkamp K, Berlage S, et al. The International Network of Obstetric Survey Systems study of uterine rupture: a descriptive multi‐country population‐based study. BJOG. 2019;126:370‐381. [DOI] [PubMed] [Google Scholar]
- 27. Jauniaux E, Bunce C, Gronbeck L, Langhoff‐Roos J. Prevalence and main outcomes of placenta accreta spectrum: a systematic review and metaanalysis. Am J Obstet Gynecol. 2019;221:208‐218. [DOI] [PubMed] [Google Scholar]
- 28. Colmorn LB, Krebs L, Klungsøyr K, et al. Mode of first delivery and severe maternal complications in the subsequent pregnancy. Acta Obstet Gynecol Scand. 2017;96:1053‐1062. [DOI] [PubMed] [Google Scholar]
- 29. Boerma T, Ronsmans C, Melesse DY, et al. Global epidemiology of use of and disparities in cesarean sections. Lancet. 2018;392:1341‐1348. [DOI] [PubMed] [Google Scholar]
Associated Data
This section collects any data citations, data availability statements, or supplementary materials included in this article.
Supplementary Materials
Table S1
Table S2
Table S3
Table S4