

Abstract
Objective
This study examined the prevalence and risk of overweight/obesity among expanded ethnicity categories within boys and girls in England and the differential influence of socioeconomic position using the 2015/2016 and the 2016/2017 cycles of the National Child Measurement Programme.
Methods
This cross‐sectional and descriptive study examined surveillance data of weight status among primary school children in England. Data were pooled across data collection years, representing 1.25 million children in Reception (aged 4‐5 years) and 1.1 million children in Year 6 (aged 10‐11 years). Ethnicity was classified according to National Health Service definitions, and child residence was used to calculate quintiles of Income Deprivation Affecting Children Index. Measured weight status was classified using the International Obesity Task Force’s definition. Logistic regression models were run for each sex and year group.
Results
Within each sex, ethnicity‐ and socioeconomic‐specific differentials in overweight/obesity prevalence were evident. For example, among the five most populous ethnic groups in the most deprived quintile, 26.8% of White British girls in Reception had overweight/obesity compared with 20.7% of girls with Pakistani, 31.2% with Black African, 17.1% with Indian, and 22.2% with any Any Other White (e.g., White European) background.
Conclusions
Ethnicity had an independent influence on overweight/obesity risk after adjustment for socioeconomic position.
Study Importance.
What is already known?
-
►
Inequalities in childhood obesity risk relating to ethnicity and socioeconomic position have previously been observed, with the most disadvantaged socioeconomic and/or minority population typically with the highest rates of overweight/obesity.
What does this study add?
-
►
In this nationally representative sample of children living in England, those in the most disadvantaged socioeconomic quintile typically had the highest risk for overweight and obesity, although exceptions to this rule were evident. For example, for Black African children, the socioeconomic disparity in overweight/obesity risk was largely removed, highlighting that other environmental and/or cultural factors are driving risk.
-
►
The highest prevalence among the most deprived children in Reception was White Irish girls (32.8%) and boys (24.9%) and among Year 6 children was Black Caribbean girls (45.5%) and Bangladeshi and Any Other Asian boys (38.0%).
How might these results change the focus of clinical practice?
-
►
Widening inequalities highlight the need to implement culturally appropriate interventions. Interventions need to be culturally sensitive and led by researchers, practitioners, and community members from within these communities.
Introduction
The current burgeoning obesity epidemic is projected to have long‐term adverse consequences on health expenditure and prevalence of noncommunicable disease (particularly type 2 diabetes, cardiovascular disease, and specific cancers) globally (1). Prevention throughout childhood is of critical public health importance (2) not only to reduce the acute and chronic conditions associated during childhood (3) but also to avert adult obesity because of the high degree of persistence into adulthood (4). In England, the 2016/2017 National Child Measurement Programme (NCMP) found that 22.6% of children in Reception (first year of formal primary school education; aged 4‐5 years) and 34.3% of children in Year 6 (aged 10‐11 years) had overweight or obesity (5).
Inequalities in childhood obesity risk relating to ethnic background (6, 7) and socioeconomic position (SEP) (8, 9) have been observed in many developed economies. In these countries, the children in the most socioeconomically disadvantaged strata or from minority ethnic groups typically have higher rates of overweight and obesity. Although conjecture exists (10) as to whether or not childhood obesity rates have in fact plateaued in several developed countries (11), what is clear is that the inequalities in prevalence are widening. In England, for example, the disparity between the least and most deprived children widened between the 2006/2007 NCMP wave (4.5% difference in obesity prevalence) and the 2016/2017 NCMP wave (6.0% difference in obesity prevalence) (5). However, it is important to highlight that socioeconomic position can have both protective and negative outcomes regarding adiposity because of the fact that it is a multifaceted construct (commonly incorporating educational attainment, income, occupation, etc.) (6). Similarly, ethnicity (commonly defined as “a large group of people who have the same national, racial, or cultural origins, or the state of belonging to such a group” (12)) has both protective and negative influences, with one multinational study (>67 countries) finding that national culture alone explained 53.5% to 62.4% of the variance in BMI among adults (13). A recent framework exploring pathways for racial/ethnic and migrant inequalities in obesity by Kumanyika (14) highlights the intersection of pathways that produce obesity alongside pathways that produce inequalities. In this model, national‐level contexts (e.g., social, economic, health system, food system, environmental, national culture, and historical contexts) intersect with race/ethnicity, SEP, and/or migrant status with intermediate health determinants (e.g., stress and trauma, poverty, oppression, discrimination, genetic and behavioral drivers, cultural practices and values, and inadequate health and social care) to influence obesity risk (14). This highlights the complex interplay of social, economic, historical, and cultural forces across different ethnic groups, which requires further investigation to prevent inequalities from widening.
Examinations of the interplay between SEP among specific ethnic groups have revealed contrasting findings (6, 7), which suggests that risks posed are not linear for all population groups. For example, the nationally representative Early Childhood Longitudinal Study, Kindergarten Class of 1998‐1999 in the United States found that the least deprived (highest SEP children) had lower initial BMI z scores among non‐Hispanic White children (males and females) but higher BMI z scores for non‐Hispanic Black males, but not females, in kindergarten (aged 5.6 ± 0.35 years) (6). In addition, detailed examination of the nationally representative US National Health and Nutrition Examination Survey 2001‐2010 waves found that after adjustment for neighborhood SEP, the disparities in childhood overweight and obesity prevalence compared with non‐Hispanic White children largely dissipated (7). These studies highlight that those who were among the most deprived were more likely to be from ethnic minority groups, and that it was levels of deprivation driving obesity risk rather than ethnicity drivers.
In the UK, examinations of the combined influence of SEP and ethnicity are limited, and these constructs are often examined in isolation. A systematic review of ethnic differences in obesity among UK children found just under half of the included studies (14/29) indicated differences in BMI by ethnic group; however, no common agreement regarding which ethnic groups had the greatest risk was observed (15). Several studies have described a higher risk for Asian children (16, 17, 18, 19, 20, 21, 22, 23, 24) or Black ethnic groups (18, 19, 20, 24, 25, 26), and others have described lower risk for Asian (26, 27) and Black ethnic groups (23). Previous analyses of the 2015/2016 NCMP data found that, compared with White British children, Asian children in Reception and Year 6 had significantly lower BMI z scores after adjustment for SEP and rurality (28), whereas children from Black ethnic groups had significantly higher BMI z scores compared with White British children (28). Within the available literature, there is a need to further examine the combined influence of sex, SEP, and ethnicity on childhood obesity risk, particularly with expanded categories of ethnicity to curtail the compression of diverse cultural and ethnic groups into broader structures. Therefore, in this study, we aimed to examine the prevalence and risk of overweight and obesity using the recent (2015/2016 and 2016/2017) nationally representative cycles of the high‐participation‐rate (≥95%) (5, 29) NCMP within England. It was hypothesized that the relationship between SEP and obesity risk would be nonlinear among specific ethnic groups, with evidence of sex‐specific relationships.
Methods
Study design, population, and setting
The NCMP is a nationally mandated surveillance program in England that collects direct measurement of children’s height and weight among Reception (aged 4‐5 years) and Year 6 (aged 10‐11 years) students, using this to monitor overall prevalence levels of obesity, trends, and changes in population weight status (30). The program, which began in the 2006‐2007 school year, uses an opt‐out (passive) consent approach to invite all Reception and Year 6 children in state primary schools to participate annually and regularly achieves student participation rates ≥92% (past 5 years) (5). Although the program is mandated for state‐maintained schools, independent schools and special schools (school for pupils with special education needs and pupil referral units) are encouraged to collect this information, but these data are excluded from the national results to maintain consistency (30). Nationally, the measurement program is coordinated by Public Health England with local authorities typically commissioning school nursing services or other provider teams to collect the information (30). Participating students have their height and weight measured by trained staff within schools. Measurements are submitted annually to an online system that carries out quality checks to identify possible measurement and inputting errors.
Data
We pooled data from the 2015/2016 and the 2016/2017 NCMP data collection years to allow for analyses of expanded ethnic subgroups. Across these 2 years, 1.25 million children in Reception and 1.1 million children in Year 6 participated in the NCMP, with 49% of participants being girls, representing an analysis sample of 2.35 million children. The participation rates for children in Reception in 2015/2016 and 2016/2017 were 95.6% and 95.8%, respectively, and 94.0% and 94.2%, respectively, for Year 6 students (5, 28).
Sample weights were not used because the NCMP aims to achieve complete coverage and because very high rates of participation are realized in the target population.
Dependent variable
Height and weight were collected using standard data collection protocols, with students wearing light clothing and shoes removed (30). Measurements of height and weight were recorded to the nearest 0.1 (centimeter or kilogram), respectively. Two measurements of height and one measurement of weight are recommended to be taken, and the mean of all measurements is used (30). Age‐ and sex‐specific BMI (weight [kg]/height2 [cm]) growth references were used to examine weight status. The International Obesity Task Force's (IOTF) growth reference was used to classify overweight (IOTF z score = +1 SD) and obesity (IOTF z score = ≥ +2 SD) (31). Examination data using the British 1990 (UK90) (32) age‐ and sex‐specific BMI growth reference are available in Supporting Information Table S1 (overweight = z score ≥ +1.33 SD and obesity = z score ≥ +2 SD). The Stata plugin zanthro was used to append IOTF weight categories to the NCMP data (33). The NCMP IT system automatically appended clinical UK90 weight categories. Overweight and obesity prevalence was summed to produce a single dependent variable for consideration in the statistical models (i.e., combined overweight/obesity).
Independent variables
Sex, school year, ethnicity, and Lower‐layer Super Output Area (LSOA) of the child residence were recoded for each participant based on information contained within school records as reported by the parent/caretaker. LSOAs are small geographical units with an average of 672 households per LSOA as used in the UK census (34). Ethnicity was classified according to standard National Health Service (NHS) definitions (35). Quintiles of the Income Deprivation affecting Children Index (IDACI) were appended to the data using the LSOA of child residence (36). IDACI classifies LSOAs according to the proportion of all children aged 0 to 15 living in income‐deprived families (36). The IDACI is the official measure of relative deprivation for LSOAs in England, was developed by the UK government, and has 37 indicators across seven domains of deprivation including income, employment, education, skills and training, health and disability, crime, barriers to housing and services, and living environment (36).
Age and month of measurement were also included as independent variables in the models in order to capture any systematic pattern in overweight/obesity prevalence with age or within the school year.
Statistical analyses
Two logistic regression models were run for each sex and year group. These examine in turn each of the two binary dependent variables: overweight/obesity prevalence by IOTF or UK90 growth reference (0 = underweight + healthy weight; 1 = overweight + obesity]. The independent variables were the same in all models. The independent variables of age and month of measurement were modeled as main effects, whereas the IDACI quintile and ethnicity were modeled as both main effects and with an interaction term.
All models were stratified by sex and school year (Reception or Year 6) and were fitted using logistic regression in R. The R emmeans package (version 1.1) was used to obtain the marginal predicted probability of overweight/obesity by deprivation and ethnicity from each of the fitted models, averaging over the other model variables. The difference in overweight/obesity between the most and least deprived SEP quintiles was calculated as the contrast between the predicted probability of overweight/obesity in the most deprived quintile compared with the least deprived quintile within each ethnic group. To reflect multiple significance testing, an adjustment was made to the width of the contrast confidence intervals (CI) using an approximation to the Dunnett method (R emmeans package).
In Supporting Information Table S2, additional logistic regression models were run for each sex and year group using overweight/obesity prevalence (IOTF) as the dependent variable and independent variables (age, month of measurement, IDACI quintile, and ethnicity) as main effects. These results can elucidate the independent influence of age, month of measurement, IDACI, and ethnicity on combined overweight/obesity risk.
Results
Population characteristics
Table 1 presents the demographic characteristics of participants in Reception and Year 6 by sex. White British children were the most populous ethnic group for both the Reception and Year 6 participants (58% of the population), with Pakistani (4%), Black African (3%), Indian (2%‐3%), and Any Other White background (5%‐6%) (e.g., White European) among the five most commonly reported ethnic groups. SEP was not equally distributed in the analysis sample, with more than 48% of Reception participants and 47% of Year 6 participants belonging to the two most deprived quintiles. More girls had overweight/obesity than boys in Reception (girls: 21.8% vs. boys: 15.3%) and Year 6 (girls: 28.4% vs. boys: 25.7%) using the IOTF growth reference.
Table 1.
Demographic characteristics of boys and girls in Reception and Year 6 in 2015/2016 and 2016/2017 combined NCMP data sets
| Reception | Year 6 | |||||||||||
|---|---|---|---|---|---|---|---|---|---|---|---|---|
| Girls | Boys | Girls | Boys | |||||||||
| N | x̅ or % | SD | N | x̅ or % | SD | N | x̅ or % | SD | N | x̅ or % | SD | |
| Age (mo) | 59.5 | 4.05 | 59.5 | 4.05 | 130.3 | 4.36 | 130.3 | 4.36 | ||||
| Ethnicity | ||||||||||||
| White British | 352,119 | 57.5 | 369,551 | 57.8 | 309,881 | 57.6 | 324,147 | 57.8 | ||||
| White Irish | 1,461 | 0.2 | 1,484 | 0.2 | 1,286 | 0.2 | 1,442 | 0.3 | ||||
| Any Other White background | 39,098 | 6.4 | 40,735 | 6.4 | 27,986 | 5.2 | 29,402 | 5.2 | ||||
| White and Black Caribbean | 7,091 | 1.2 | 7,354 | 1.2 | 6,218 | 1.2 | 6,261 | 1.1 | ||||
| White and Black African | 3,958 | 0.6 | 4,308 | 0.7 | 3,023 | 0.6 | 3,066 | 0.5 | ||||
| White and Asian | 6,801 | 1.1 | 6,959 | 1.1 | 4,954 | 0.9 | 5,288 | 0.9 | ||||
| Any other mixed background | 11,826 | 1.9 | 12,411 | 1.9 | 8,983 | 1.7 | 9,206 | 1.6 | ||||
| Indian | 15,239 | 2.5 | 15,900 | 2.5 | 12,203 | 2.3 | 12,815 | 2.3 | ||||
| Pakistani | 22,589 | 3.7 | 22,995 | 3.6 | 20,636 | 3.8 | 21,197 | 3.8 | ||||
| Bangladeshi | 8,092 | 1.3 | 8,220 | 1.3 | 8,183 | 1.5 | 8,380 | 1.5 | ||||
| Any Other Asian background | 9,620 | 1.6 | 10,076 | 1.6 | 8,406 | 1.6 | 8,992 | 1.6 | ||||
| Black Caribbean | 4,809 | 0.8 | 4,822 | 0.8 | 5,552 | 1 | 5,810 | 1 | ||||
| Black African | 15,922 | 2.6 | 16,230 | 2.5 | 15,017 | 2.8 | 15,160 | 2.7 | ||||
| Any Other Black background | 5,767 | 0.9 | 5,846 | 0.9 | 5,966 | 1.1 | 6,121 | 1.1 | ||||
| Chinese | 2,507 | 0.4 | 2,745 | 0.4 | 1,705 | 0.3 | 1,744 | 0.3 | ||||
| Any other ethnic group | 11,148 | 1.8 | 12,071 | 1.9 | 9,919 | 1.8 | 10,685 | 1.9 | ||||
| Not stated or unknown | 94,371 | 15.4 | 97,607 | 15.3 | 87,990 | 16.4 | 90,922 | 16.2 | ||||
| IDACI quintile | ||||||||||||
| 1 (most deprived) | 159,284 | 26 | 165,969 | 26 | 138,019 | 25.7 | 141,143 | 25.2 | ||||
| 2 | 136,766 | 22.3 | 142,162 | 22.2 | 114,690 | 21.3 | 119,614 | 21.3 | ||||
| 3 | 117,028 | 19.1 | 122,186 | 19.1 | 99,872 | 18.6 | 104,721 | 18.7 | ||||
| 4 | 102,940 | 16.8 | 107,760 | 16.9 | 93,378 | 17.4 | 98,355 | 17.5 | ||||
| 5 (least deprived) | 96,400 | 15.7 | 101,237 | 15.8 | 91,949 | 17.1 | 96,805 | 17.3 | ||||
| Month measurement (quarter) | ||||||||||||
| Sept‐Nov | 127,392 | 20.8 | 132,698 | 20.8 | 228,047 | 42.4 | 235,954 | 42.1 | ||||
| Dec‐Feb | 221,719 | 36.2 | 231,819 | 36.3 | 150,505 | 28 | 157,815 | 28.1 | ||||
| Mar‐May | 213,261 | 34.8 | 222,035 | 34.7 | 130,108 | 24.2 | 135,818 | 24.2 | ||||
| June‐Aug | 50,046 | 8.2 | 52,762 | 8.3 | 29,248 | 5.4 | 31,051 | 5.5 | ||||
| Height (cm) | 108.9 | 5.13 | 109.9 | 5.12 | 145.5 | 7.6 | 144.8 | 7.05 | ||||
| Weight (kg) | 19.3 | 3.09 | 19.6 | 2.98 | 40.89 | 10.2 | 39.8 | 9.66 | ||||
| IOTF BMI z score | 0.50 | 1 | 0.39 | 1.01 | 0.59 | 1.08 | 0.56 | 1.09 | ||||
| UK90 BMI z score | 0.35 | 1 | 0.34 | 1.08 | 0.45 | 1.22 | 0.59 | 1.22 | ||||
| IOTF overweight/obesity (%) | 133,680 | 21.8 | 97,498 | 15.3 | 152,541 | 28.4 | 144,032 | 25.7 | ||||
IDACI, Income Deprivation affecting Children Index; IOTF, International Obesity Task Force; NCMP, National Child Measurement Programme; UK90, British 1990.
Overweight and obesity prevalence by ethnicity, sex, year level, and SEP (independent)
Table 2 presents the prevalence of combined overweight/obesity by ethnicity and SEP through the IDACI quintiles for Reception and Year 6 children using the IOTF growth reference (UK90 in Supporting Information Table S1). Strong SEP and ethnic differences in overweight/obesity prevalence were evident. For example, among Year 6 girls, the prevalence of overweight/obesity among the most deprived quintile ranged between 24.1% (Chinese girls) and 45.5% (Black Caribbean girls). For most ethnic groups, children in the most deprived SEP quintile had the highest prevalence of overweight/obesity compared with the least deprived SEP quintile. Exceptions included Reception students from Black Caribbean (girls), Black African (boys and girls), and Chinese (girls and boys) backgrounds; and Year 6 students from Bangladeshi (boys and girls), Black Caribbean (boys), and Black African (boys and girls) backgrounds. The population groups with the highest proportion of overweight/obesity in Reception and Year 6 were White Irish girls (32.8%) and Black Caribbean girls (45.5%), respectively, both of whom were in the most deprived quintile. Conversely, the population groups with the lowest proportion of children with overweight/obesity in Reception were White and Asian boys (7.1%) and in Year 6 Chinese girls (11.7%), both of whom were in the least deprived quintile.
Table 2.
Overweight and obesity prevalence (IOTF) by ethnicity and IDACI quintile characteristics of boys and girls in Reception and Year 6 in 2015/2016 and 2016/2017 combined NCMP data sets
| IDACI quintile a | Reception girls | Reception boys | Year 6 girls | Year 6 boys | ||||||||
|---|---|---|---|---|---|---|---|---|---|---|---|---|
| N | Mean BMI z score | Prev (%) | N | Mean BMI z score | Prev (%) | N | Mean BMI z score | Prev (%) | N | Mean BMI z score | Prev (%) | |
| White British | ||||||||||||
| 1 | 73,033 | 0.67 | 26.8% | 76,870 | 0.55 | 19.0% | 61,316 | 0.73 | 33.4% | 62,597 | 0.66 | 29.0% |
| 2 | 69,487 | 0.60 | 24.0% | 72,193 | 0.48 | 16.5% | 57,106 | 0.65 | 30.3% | 59,671 | 0.58 | 26.0% |
| 3 | 71,328 | 0.54 | 21.7% | 75,064 | 0.42 | 14.4% | 61,038 | 0.56 | 26.5% | 64,191 | 0.51 | 23.0% |
| 4 | 70,715 | 0.50 | 19.9% | 74,306 | 0.38 | 12.9% | 64,972 | 0.48 | 23.2% | 68,361 | 0.44 | 20.0% |
| 5 | 67,556 | 0.45 | 18.1% | 71,118 | 0.33 | 11.5% | 65,449 | 0.39 | 19.6% | 69,327 | 0.36 | 17.0% |
| White Irish | ||||||||||||
| 1 | 345 | 0.73 | 32.8% | 330 | 0.73 | 24.9% | 306 | 0.75 | 33.3% | 313 | 0.84 | 35.0% |
| 2 | 280 | 0.69 | 26.8% | 289 | 0.55 | 17.7% | 245 | 0.70 | 30.6% | 296 | 0.72 | 32.0% |
| 3 | 314 | 0.61 | 26.8% | 293 | 0.54 | 18.1% | 280 | 0.61 | 25.0% | 297 | 0.52 | 22.0% |
| 4 | 254 | 0.44 | 18.1% | 277 | 0.45 | 11.9% | 214 | 0.42 | 21.0% | 263 | 0.43 | 17.0% |
| 5 | 268 | 0.55 | 19.4% | 295 | 0.37 | 12.9% | 241 | 0.38 | 14.9% | 273 | 0.26 | 14.0% |
| Any Other White background | ||||||||||||
| 1 | 11,455 | 0.51 | 22.2% | 11,905 | 0.45 | 17.3% | 8,673 | 0.74 | 34.0% | 9,065 | 0.82 | 35.0% |
| 2 | 10,122 | 0.45 | 20.1% | 10,589 | 0.38 | 15.0% | 6,781 | 0.65 | 31.2% | 6,928 | 0.73 | 31.0% |
| 3 | 7,649 | 0.41 | 17.8% | 7,886 | 0.36 | 14.1% | 5,105 | 0.54 | 26.4% | 5,491 | 0.66 | 29.0% |
| 4 | 5,387 | 0.38 | 17.3% | 5,699 | 0.30 | 11.8% | 3,778 | 0.47 | 23.5% | 4,071 | 0.51 | 23.0% |
| 5 | 4,485 | 0.37 | 15.9% | 4,656 | 0.29 | 10.6% | 3,649 | 0.37 | 18.9% | 3,847 | 0.36 | 17.0% |
| White and Black Caribbean | ||||||||||||
| 1 | 2,834 | 0.63 | 26.8% | 2,940 | 0.55 | 19.0% | 2,356 | 0.97 | 42.1% | 2,393 | 0.74 | 31.0% |
| 2 | 1,814 | 0.56 | 24.4% | 1,819 | 0.51 | 17.5% | 1,528 | 0.86 | 38.4% | 1,484 | 0.74 | 31.0% |
| 3 | 1,170 | 0.62 | 25.2% | 1,224 | 0.50 | 17.2% | 1,023 | 0.75 | 33.8% | 1,013 | 0.65 | 27.0% |
| 4 | 753 | 0.50 | 22.2% | 776 | 0.48 | 15.5% | 761 | 0.63 | 27.6% | 812 | 0.55 | 24.0% |
| 5 | 520 | 0.53 | 22.5% | 595 | 0.39 | 12.4% | 550 | 0.63 | 30.4% | 559 | 0.47 | 21.0% |
| White and Black African | ||||||||||||
| 1 | 1,446 | 0.74 | 30.2% | 1,553 | 0.60 | 22.3% | 1,128 | 1.02 | 44.0% | 1,081 | 0.76 | 31.0% |
| 2 | 1,006 | 0.67 | 27.5% | 1,108 | 0.58 | 20.8% | 762 | 0.79 | 34.8% | 791 | 0.71 | 30.0% |
| 3 | 686 | 0.61 | 23.8% | 719 | 0.55 | 18.8% | 528 | 0.78 | 35.2% | 539 | 0.63 | 26.0% |
| 4 | 461 | 0.54 | 24.1% | 564 | 0.43 | 16.3% | 347 | 0.67 | 31.7% | 375 | 0.56 | 23.0% |
| 5 | 359 | 0.54 | 22.3% | 364 | 0.45 | 15.4% | 258 | 0.52 | 25.6% | 280 | 0.54 | 20.0% |
| White and Asian | ||||||||||||
| 1 | 1,561 | 0.42 | 20.0% | 1,538 | 0.27 | 14.6% | 1,044 | 0.71 | 32.3% | 1,018 | 0.65 | 31.0% |
| 2 | 1,431 | 0.35 | 17.9% | 1,493 | 0.24 | 14.4% | 1,066 | 0.56 | 28.4% | 1,127 | 0.50 | 28.0% |
| 3 | 1,316 | 0.21 | 13.6% | 1,355 | 0.14 | 11.5% | 983 | 0.35 | 22.3% | 1,043 | 0.50 | 26.0% |
| 4 | 1,237 | 0.17 | 11.6% | 1,211 | 0.10 | 9.3% | 829 | 0.20 | 16.0% | 973 | 0.34 | 20.0% |
| 5 | 1,256 | 0.13 | 10.8% | 1,362 | 0.03 | 7.1% | 1,032 | 0.19 | 15.3% | 1,127 | 0.17 | 14.0% |
| Any other mixed background | ||||||||||||
| 1 | 3,630 | 0.54 | 24.9% | 3,951 | 0.45 | 18.7% | 2,525 | 0.75 | 35.5% | 2,631 | 0.74 | 31.0% |
| 2 | 3,062 | 0.47 | 22.2% | 3,214 | 0.35 | 14.4% | 2,102 | 0.67 | 32.0% | 2,146 | 0.65 | 29.0% |
| 3 | 2,095 | 0.45 | 20.6% | 2,075 | 0.35 | 14.9% | 1,670 | 0.57 | 27.4% | 1,724 | 0.56 | 26.0% |
| 4 | 1,621 | 0.40 | 18.3% | 1,672 | 0.29 | 12.3% | 1,363 | 0.49 | 24.1% | 1,457 | 0.46 | 21.0% |
| 5 | 1,418 | 0.33 | 15.3% | 1,499 | 0.25 | 11.5% | 1,323 | 0.40 | 20.6% | 1,248 | 0.36 | 20.0% |
| Indian | ||||||||||||
| 1 | 2,839 | 0.08 | 17.1% | 2,852 | ‐0.04 | 13.4% | 2,350 | 0.59 | 32.2% | 2,415 | 0.67 | 36.0% |
| 2 | 4,697 | 0.02 | 16.3% | 5,081 | ‐0.10 | 12.0% | 3,687 | 0.44 | 29.1% | 3,892 | 0.56 | 32.0% |
| 3 | 3,800 | ‐0.05 | 13.0% | 4,022 | ‐0.17 | 10.7% | 3,007 | 0.40 | 26.1% | 3,272 | 0.48 | 29.0% |
| 4 | 2,183 | ‐0.08 | 12.4% | 2,242 | ‐0.17 | 9.9% | 1,759 | 0.38 | 25.8% | 1,855 | 0.45 | 27.0% |
| 5 | 1,720 | ‐0.11 | 10.9% | 1,703 | ‐0.27 | 7.3% | 1,400 | 0.33 | 24.0% | 1,381 | 0.39 | 25.0% |
| Pakistani | ||||||||||||
| 1 | 8,257 | 0.31 | 20.7% | 8,447 | 0.17 | 15.8% | 7,549 | 0.65 | 34.6% | 7,889 | 0.66 | 35.0% |
| 2 | 8,577 | 0.30 | 20.7% | 8,792 | 0.12 | 14.9% | 7,973 | 0.61 | 33.6% | 7,973 | 0.64 | 35.0% |
| 3 | 3,613 | 0.26 | 18.8% | 3,652 | 0.07 | 14.0% | 3,185 | 0.55 | 32.4% | 3,333 | 0.59 | 32.0% |
| 4 | 1,397 | 0.20 | 17.6% | 1,316 | 0.04 | 13.4% | 1,204 | 0.48 | 29.2% | 1,252 | 0.52 | 31.0% |
| 5 | 745 | 0.12 | 15.3% | 788 | ‐0.05 | 11.0% | 725 | 0.38 | 24.4% | 750 | 0.56 | 30.0% |
| Bangladeshi | ||||||||||||
| 1 | 4,612 | 0.29 | 21.0% | 4,718 | 0.21 | 17.4% | 4,771 | 0.65 | 34.5% | 4,814 | 0.76 | 38.0% |
| 2 | 2,183 | 0.24 | 18.8% | 2,259 | 0.16 | 17.0% | 2,149 | 0.63 | 32.9% | 2,273 | 0.82 | 40.0% |
| 3 | 800 | 0.18 | 16.8% | 793 | 0.14 | 16.5% | 796 | 0.66 | 33.0% | 850 | 0.75 | 37.0% |
| 4 | 344 | 0.29 | 20.9% | 302 | 0.01 | 12.9% | 294 | 0.60 | 30.3% | 276 | 0.67 | 36.0% |
| 5 | 153 | 0.25 | 15.7% | 148 | 0.03 | 13.5% | 173 | 0.81 | 39.3% | 167 | 0.67 | 32.0% |
| Any Other Asian background | ||||||||||||
| 1 | 2,882 | 0.36 | 20.6% | 3,042 | 0.30 | 16.7% | 2,276 | 0.60 | 30.8% | 2,479 | 0.79 | 38.0% |
| 2 | 2,838 | 0.29 | 20.0% | 2,983 | 0.18 | 15.2% | 2,538 | 0.57 | 31.4% | 2,774 | 0.70 | 34.0% |
| 3 | 1,958 | 0.23 | 17.7% | 2,088 | 0.13 | 13.4% | 1,871 | 0.54 | 30.6% | 1,994 | 0.61 | 31.0% |
| 4 | 1,104 | 0.18 | 15.9% | 1,104 | 0.10 | 12.9% | 983 | 0.43 | 25.1% | 1,041 | 0.58 | 30.0% |
| 5 | 838 | 0.12 | 12.9% | 859 | 0.03 | 11.2% | 738 | 0.49 | 27.4% | 704 | 0.53 | 28.0% |
| Black Caribbean | ||||||||||||
| 1 | 2,606 | 0.53 | 24.1% | 2,676 | 0.53 | 20.0% | 2,974 | 1.09 | 45.5% | 3,079 | 0.83 | 33.0% |
| 2 | 1,412 | 0.58 | 25.1% | 1,283 | 0.46 | 17.2% | 1,506 | 0.97 | 41.6% | 1,600 | 0.83 | 32.0% |
| 3 | 488 | 0.50 | 20.7% | 528 | 0.45 | 15.5% | 703 | 0.97 | 40.8% | 706 | 0.80 | 35.0% |
| 4 | 210 | 0.50 | 24.3% | 245 | 0.46 | 18.4% | 257 | 0.91 | 37.7% | 294 | 0.64 | 25.0% |
| 5 | 93 | 0.57 | 24.7% | 90 | 0.34 | 15.6% | 112 | 0.81 | 37.5% | 131 | 0.49 | 21.0% |
| Black African | ||||||||||||
| 1 | 9,098 | 0.72 | 31.2% | 9,160 | 0.59 | 23.3% | 8,703 | 0.94 | 41.5% | 8,647 | 0.83 | 35.0% |
| 2 | 4,201 | 0.69 | 29.9% | 4,407 | 0.60 | 23.1% | 3,860 | 0.97 | 42.5% | 4,020 | 0.84 | 34.0% |
| 3 | 1,552 | 0.75 | 31.4% | 1,551 | 0.62 | 24.1% | 1,474 | 0.98 | 41.5% | 1,463 | 0.87 | 36.0% |
| 4 | 704 | 0.67 | 29.4% | 736 | 0.60 | 22.8% | 671 | 0.94 | 41.9% | 692 | 0.75 | 30.0% |
| 5 | 367 | 0.66 | 27.0% | 376 | 0.67 | 23.9% | 309 | 0.86 | 38.8% | 338 | 0.83 | 33.0% |
| Any Other Black background | ||||||||||||
| 1 | 3,154 | 0.64 | 29.8% | 3,144 | 0.52 | 20.6% | 3,367 | 0.92 | 39.8% | 3,410 | 0.78 | 32.0% |
| 2 | 1,471 | 0.56 | 26.0% | 1,529 | 0.52 | 19.8% | 1,427 | 0.88 | 38.3% | 1,581 | 0.76 | 33.0% |
| 3 | 681 | 0.52 | 25.4% | 682 | 0.47 | 16.7% | 720 | 0.80 | 36.2% | 661 | 0.76 | 33.0% |
| 4 | 288 | 0.56 | 26.0% | 283 | 0.59 | 20.1% | 295 | 0.80 | 34.9% | 300 | 0.71 | 29.0% |
| 5 | 173 | 0.60 | 27.8% | 208 | 0.50 | 18.8% | 157 | 0.63 | 27.4% | 169 | 0.57 | 26.0% |
| Chinese | ||||||||||||
| 1 | 781 | 0.25 | 14.5% | 837 | 0.37 | 14.0% | 444 | 0.48 | 24.1% | 441 | 0.71 | 33.0% |
| 2 | 564 | 0.32 | 16.8% | 627 | 0.30 | 13.7% | 384 | 0.41 | 22.7% | 414 | 0.73 | 34.0% |
| 3 | 430 | 0.21 | 12.8% | 459 | 0.33 | 14.2% | 295 | 0.19 | 16.6% | 332 | 0.56 | 29.0% |
| 4 | 369 | 0.17 | 11.1% | 407 | 0.19 | 11.6% | 299 | 0.20 | 17.4% | 287 | 0.54 | 25.0% |
| 5 | 363 | 0.15 | 11.3% | 415 | 0.16 | 9.2% | 283 | 0.04 | 11.7% | 270 | 0.49 | 26.0% |
| Any other ethnic group | ||||||||||||
| 1 | 4,467 | 0.52 | 23.7% | 4,998 | 0.47 | 19.2% | 4,102 | 0.73 | 33.7% | 4,508 | 0.83 | 37.0% |
| 2 | 3,031 | 0.48 | 22.4% | 3,167 | 0.38 | 17.2% | 2,614 | 0.70 | 32.7% | 2,761 | 0.78 | 35.0% |
| 3 | 1,781 | 0.43 | 20.3% | 1,933 | 0.39 | 15.8% | 1,640 | 0.64 | 29.8% | 1,765 | 0.71 | 32.0% |
| 4 | 1.079 | 0.42 | 20.3% | 1,145 | 0.32 | 13.1% | 906 | 0.60 | 28.4% | 993 | 0.64 | 30.0% |
| 5 | 790 | 0.39 | 20.0% | 828 | 0.32 | 13.9% | 657 | 0.49 | 23.4% | 658 | 0.56 | 24.0% |
| Not stated or unknown | ||||||||||||
| 1 | 26,284 | 0.60 | 26.0% | 27,008 | 0.50 | 19.0% | 24,135 | 0.75 | 34.5% | 24,363 | 0.73 | 32.0% |
| 2 | 20,590 | 0.51 | 22.6% | 21,329 | 0.41 | 16.6% | 18,962 | 0.66 | 31.4% | 19,883 | 0.63 | 29.0% |
| 3 | 17,367 | 0.47 | 20.8% | 17,862 | 0.36 | 14.6% | 15,554 | 0.59 | 28.4% | 16,047 | 0.54 | 26.0% |
| 4 | 14,834 | 0.47 | 19.9% | 15,475 | 0.36 | 13.1% | 14,446 | 0.49 | 23.6% | 15,053 | 0.47 | 22.0% |
| 5 | 15,296 | 0.41 | 17.4% | 15,933 | 0.32 | 11.6% | 14,893 | 0.43 | 20.9% | 15,576 | 0.39 | 19.0% |
| All | 612,418 | 0.50 | 21.8% | 639,314 | 0.39 | 15.3% | 537,908 | 0.59 | 28.4% | 560,638 | 0.56 | 26.0% |
For IDACI quartiles, 1 indicates most deprived and 5 indicates least deprived.
IDACI, Income Deprivation affecting Children Index; IOTF, International Obesity Task Force; NCMP, National Child Measurement Programme.
Supporting Information Tables S2 presents the multivariable logistic regression models of overweight/obesity risk with age, ethnicity, sex, year level, month of measurement, and SEP as independent variables. In these models, each of these variables can be examined for its independent influence on probability of overweight/obesity while adjusting for each independent variable. A strong SEP gradient in overweight/obesity risk was observed for both Reception and Year 6 children. For example, after adjustment for age, month of measurement, and ethnicity, children in the most deprived SEP quintile had a higher probability of having overweight/obesity compared with children in the least deprived quintile (girls: 1.62; 95% CI: 1.60‐1.64 and boys: 1.75; 95% CI: 1.72‐1.77). Additionally, ethnicity strongly influenced probability of overweight/obesity. For example, compared with White British children, Black Caribbean girls in Year 6 (girls: 1.74; 95% CI: 1.68‐1.79) and Bangladeshi boys in Year 6 (boys: 1.69; 95% CI: 1.64‐1.73) had the highest probability of having overweight/obesity after adjustment for age, month of measurement, and SEP.
Overweight and obesity prevalence by ethnicity, sex, year level, and SEP (interaction ethnicity × SEP)
Table 3 presents the results of the multivariable logistic regression models using the IOTF growth reference (UK90 in Supporting Information Table S3). This model has been used to derive the predicted probabilities of overweight/obesity by ethnic group and deprivation quintile, which are depicted graphically as differences in overweight/obesity prevalence between the most and least deprived in Figure 1. Strong sex‐ and ethnic‐specific socioeconomic inequalities in risk were evident after adjustment for age and month of measurement (Figure 1C‐1D). For example, among the five most populous ethnic groups in Year 6, the disparity in overweight/obesity risk between boys in the least deprived and most deprived groups was Δ12% among White British boys compared with Δ5% for Pakistani, Δ2% for Black African, Δ11% for Indian, and Δ18% in Any Other White backgrounds. Additionally, Table 3 highlights that the risk of overweight/obesity had a nonsteady higher gradient between the least and most deprived; for example, a higher gradient in risk among White Irish boys in Year 6 was evident between quintiles 1 and 2 compared with quintiles 3 and 4. The smallest differences in overweight/obesity prevalence between the most and least deprived IDACI quintiles were generally seen in Black African children, except for girls in Reception and in Year 6 where the smallest differences were found in Black Caribbean and Bangladeshi girls, respectively.
Table 3.
Odds ratios (OR) for the multivariable regression models of overweight and obesity (IOTF), by sex and year group
| Reception girls | Reception boys | Year 6 girls | Year 6 boys | |
|---|---|---|---|---|
| OR (95% CI) | OR (95% CI) | OR (95% CI) | OR (95% CI) | |
| Age (mo) | 1.00 (1.00‐1.00) | 1.00 (1.00‐1.00) | 1.00 (0.99‐1.00) | 1.00 (1.00‐1.00) |
| Quarter of measurement | ||||
| Sept‐Nov | ref | ref | ref | ref |
| Dec‐Feb | 0.91 (0.89‐0.93) | 0.88 (0.86‐0.90) | 1.00 (0.99‐1.02) | 1.02 (1.00‐1.03) |
| Mar‐May | 0.91 (0.89‐0.93) | 0.87 (0.85‐0.89) | 1.01 (0.99‐1.02) | 1.04 (1.02‐1.06) |
| June‐Aug | 0.85 (0.83‐0.88) | 0.80 (0.77‐0.83) | 1.02 (0.99‐1.05) | 1.04 (1.01‐1.07) |
| IDACI | ||||
| 1 (most deprived) | 1.65 (1.63‐1.68) | 1.79 (1.76‐1.82) | 2.06 (2.03‐2.08) | 2.01 (1.99‐2.04) |
| 2 | 1.42 (1.40‐1.45) | 1.52 (1.48‐1.55) | 1.78 (1.75‐1.81) | 1.72 (1.69‐1.75) |
| 3 | 1.25 (1.22‐1.27) | 1.29 (1.26‐1.32) | 1.48 (1.45‐1.50) | 1.46 (1.43‐1.49) |
| 4 | 1.12 (1.10‐1.15) | 1.14 (1.11‐1.17) | 1.24 (1.21‐1.26) | 1.24 (1.21‐1.26) |
| 5 (least deprived) | ref | ref | ref | ref |
| Ethnicity | ||||
| White British | ref | ref | ref | ref |
| White Irish | 1.09 (0.79‐1.40) | 1.15 (0.81‐1.49) | 0.72 (0.36‐1.07) | 0.81 (0.47‐1.15) |
| Any Other White background | 0.86 (0.77‐0.94) | 0.91 (0.81‐1.00) | 0.95 (0.87‐1.04) | 1.00 (0.91‐1.09) |
| White and Black Caribbean | 1.32 (1.11‐1.53) | 1.10 (0.85‐1.34) | 1.79 (1.61‐1.97) | 1.30 (1.10‐1.51) |
| White and Black African | 1.30 (1.05‐1.55) | 1.41 (1.12‐1.69) | 1.41 (1.13‐1.69) | 1.22 (0.92‐1.51) |
| White and Asian | 0.55 (0.37‐0.73) | 0.59 (0.38‐0.80) | 0.74 (0.57‐0.91) | 0.79 (0.62‐0.96) |
| Any other mixed background | 0.81 (0.67‐0.96) | 0.99 (0.83‐1.15) | 1.06 (0.93‐1.20) | 1.22 (1.08‐1.36) |
| Indian | 0.56 (0.41‐0.71) | 0.61 (0.42‐0.79) | 1.29 (1.17‐1.42) | 1.64 (1.52‐1.76) |
| Pakistani | 0.82 (0.62‐1.02) | 0.96 (0.73‐1.18) | 1.32 (1.15‐1.49) | 2.08 (1.93‐2.24) |
| Bangladeshi | 0.84 (0.41‐1.28) | 1.20 (0.73‐1.68) | 2.66 (2.35‐2.96) | 2.32 (2.00‐2.65) |
| Any Other Asian background | 0.67 (0.47‐0.87) | 0.97 (0.76‐1.19) | 1.54 (1.38‐1.71) | 1.87 (1.70‐2.03) |
| Black Caribbean | 1.49 (1.02‐1.96) | 1.43 (0.86‐2.00) | 2.46 (2.07‐2.84) | 1.26 (0.84‐1.69) |
| Black African | 1.68 (1.45‐1.91) | 2.42 (2.18‐2.65) | 2.60 (2.37‐2.83) | 2.35 (2.13‐2.58) |
| Any Other Black background | 1.76 (1.42‐2.09) | 1.80 (1.45‐2.14) | 1.54 (1.19‐1.89) | 1.71 (1.37‐2.05) |
| Chinese | 0.58 (0.25‐0.90) | 0.77 (0.44‐1.11) | 0.54 (0.18‐0.91) | 1.73 (1.46‐2.00) |
| Any other ethnic group | 1.13 (0.96‐1.31) | 1.25 (1.05‐1.44) | 1.25 (1.07‐1.44) | 1.55 (1.37‐1.73) |
| Not stated or unknown | 0.96 (0.91‐1.00) | 1.01 (0.95‐1.06) | 1.09 (1.04‐1.13) | 1.11 (1.06‐1.15) |
| IDACI and ethnicity interaction | ||||
| White Irish, 1 most deprived | 1.22 (0.84‐1.60) | 1.24 (0.82‐1.66) | 1.39 (0.96‐1.82) | 1.64 (1.23‐2.05) |
| 2 | 1.06 (0.66‐1.47) | 0.95 (0.50‐1.41) | 1.41 (0.97‐1.86) | 1.62 (1.20‐2.04) |
| 3 | 1.22 (0.82‐1.61) | 1.15 (0.70‐1.60) | 1.29 (0.84‐1.73) | 1.13 (0.69‐1.57) |
| 4 | 0.82 (0.38‐1.26) | 0.81 (0.31‐1.30) | 1.23 (0.75‐1.71) | 0.98 (0.51‐1.45) |
| 5 least deprived | ref | ref | ref | ref |
| Any Other White background, 1 most deprived | 0.91 (0.82‐1.01) | 0.99 (0.88‐1.10) | 1.08 (0.98‐1.18) | 1.28 (1.18‐1.37) |
| 2 | 0.93 (0.84‐1.03) | 0.99 (0.87‐1.10) | 1.09 (0.99‐1.20) | 1.28 (1.18‐1.38) |
| 3 | 0.92 (0.81‐1.02) | 1.07 (0.96‐1.19) | 1.05 (0.94‐1.15) | 1.36 (1.26‐1.47) |
| 4 | 0.98 (0.87‐1.09) | 0.99 (0.87‐1.12) | 1.07 (0.95‐1.18) | 1.19 (1.07‐1.30) |
| 5 least deprived | ref | ref | ref | ref |
| White and Black Caribbean, 1 most deprived | 0.76 (0.53‐0.98) | 0.91 (0.65‐1.17) | 0.81 (0.61‐1.01) | 0.83 (0.60‐1.05) |
| 2 | 0.78 (0.54‐1.01) | 0.98 (0.71‐1.26) | 0.80 (0.59‐1.01) | 0.97 (0.74‐1.20) |
| 3 | 0.93 (0.68‐1.17) | 1.14 (0.85‐1.43) | 0.79 (0.57‐1.02) | 0.96 (0.71‐1.21) |
| 4 | 0.87 (0.60‐1.14) | 1.13 (0.82‐1.44) | 0.71 (0.47‐0.95) | 0.93 (0.67‐1.19) |
| 5 least deprived | ref | ref | ref | ref |
| White and Black African, 1 most deprived | 0.91 (0.63‐1.18) | 0.87 (0.56‐1.18) | 1.11 (0.81‐1.42) | 0.88 (0.56‐1.20) |
| 2 | 0.92 (0.64‐1.21) | 0.94 (0.62‐1.26) | 0.87 (0.55‐1.19) | 1.01 (0.68‐1.34) |
| 3 | 0.87 (0.56‐1.17) | 0.98 (0.64‐1.32) | 1.07 (0.74‐1.40) | 0.95 (0.60‐1.30) |
| 4 | 0.98 (0.65‐1.31) | 0.94 (0.58‐1.30) | 1.09 (0.73‐1.46) | 0.99 (0.61‐1.37) |
| 5 least deprived | ref | ref | ref | ref |
| White and Asian, 1 most deprived | 1.25 (1.03‐1.47) | 1.23 (0.98‐1.49) | 1.28 (1.07‐1.50) | 1.37 (1.16‐1.59) |
| 2 | 1.26 (1.04‐1.49) | 1.44 (1.19‐1.69) | 1.23 (1.02‐1.45) | 1.39 (1.17‐1.60) |
| 3 | 1.04 (0.80‐1.28) | 1.32 (1.05‐1.58) | 1.07 (0.85‐1.30) | 1.46 (1.24‐1.68) |
| 4 | 0.97 (0.72‐1.22) | 1.17 (0.89‐1.46) | 0.85 (0.60‐1.11) | 1.21 (0.98‐1.45) |
| 5 least deprived | ref | ref | ref | ref |
| Any other mixed background, 1 most deprived | 1.11 (0.94‐1.27) | 0.99 (0.81‐1.17) | 1.04 (0.88‐1.20) | 0.89 (0.73‐1.05) |
| 2 | 1.11 (0.94‐1.28) | 0.86 (0.67‐1.05) | 1.02 (0.86‐1.19) | 0.95 (0.78‐1.12) |
| 3 | 1.15 (0.97‐1.33) | 1.05 (0.85‐1.25) | 0.99 (0.81‐1.16) | 0.98 (0.81‐1.16) |
| 4 | 1.10 (0.91‐1.29) | 0.94 (0.73‐1.16) | 0.99 (0.81‐1.18) | 0.85 (0.66‐1.04) |
| 5 least deprived | ref | ref | ref | ref |
| Indian, 1 most deprived | 1.02 (0.83‐1.20) | 1.10 (0.89‐1.32) | 0.73 (0.58‐0.88) | 0.84 (0.69‐0.99) |
| 2 | 1.11 (0.94‐1.28) | 1.15 (0.94‐1.35) | 0.73 (0.59‐0.88) | 0.82 (0.68‐0.96) |
| 3 | 0.97 (0.79‐1.15) | 1.19 (0.98‐1.40) | 0.76 (0.61‐0.91) | 0.84 (0.69‐0.98) |
| 4 | 1.02 (0.82‐1.22) | 1.22 (0.99‐1.45) | 0.89 (0.73‐1.06) | 0.89 (0.73‐1.05) |
| 5 least deprived | ref | ref | ref | ref |
| Pakistani, 1 most deprived | 0.87 (0.66‐1.08) | 0.84 (0.61‐1.07) | 0.80 (0.62‐0.97) | 0.63 (0.46‐0.79) |
| 2 | 1.01 (0.80‐1.22) | 0.93 (0.69‐1.16) | 0.88 (0.70‐1.06) | 0.73 (0.56‐0.89) |
| 3 | 1.02 (0.81‐1.24) | 1.01 (0.77‐1.26) | 1.01 (0.82‐1.19) | 0.77 (0.60‐0.95) |
| 4 | 1.05 (0.81‐1.30) | 1.09 (0.82‐1.37) | 1.03 (0.82‐1.24) | 0.84 (0.64‐1.03) |
| 5 least deprived | ref | ref | ref | ref |
| Bangladeshi, 1 most deprived | 0.87 (0.43‐1.31) | 0.76 (0.28‐1.24) | 0.39 (0.08‐0.71) | 0.64 (0.31‐0.97) |
| 2 | 0.87 (0.42‐1.32) | 0.87 (0.38‐1.35) | 0.43 (0.11‐0.74) | 0.81 (0.47‐1.15) |
| 3 | 0.86 (0.39‐1.33) | 0.98 (0.47‐1.49) | 0.52 (0.18‐0.86) | 0.86 (0.51‐1.22) |
| 4 | 1.26 (0.75‐1.77) | 0.83 (0.25‐1.41) | 0.54 (0.15‐0.94) | 0.95 (0.55‐1.36) |
| 5 least deprived | ref | ref | ref | ref |
| Any Other Asian background, 1 most deprived | 1.06 (0.84‐1.28) | 0.89 (0.65‐1.12) | 0.57 (0.39‐0.76) | 0.81 (0.62‐0.99) |
| 2 | 1.18 (0.96‐1.41) | 0.93 (0.70‐1.17) | 0.68 (0.50‐0.87) | 0.79 (0.61‐0.98) |
| 3 | 1.16 (0.93‐1.40) | 0.95 (0.70‐1.20) | 0.79 (0.60‐0.98) | 0.80 (0.61‐0.99) |
| 4 | 1.14 (0.88‐1.40) | 1.02 (0.74‐1.30) | 0.72 (0.50‐0.94) | 0.89 (0.67‐1.10) |
| 5 least deprived | ref | ref | ref | ref |
| Black Caribbean, 1 most deprived | 0.58 (0.10‐1.06) | 0.75 (0.17‐1.33) | 0.68 (0.29‐1.07) | 0.95 (0.51‐1.38) |
| 2 | 0.71 (0.23‐1.20) | 0.74 (0.15‐1.33) | 0.67 (0.27‐1.06) | 1.06 (0.63‐1.50) |
| 3 | 0.64 (0.12‐1.16) | 0.77 (0.15‐1.39) | 0.78 (0.37‐1.19) | 1.41 (0.95‐1.86) |
| 4 | 0.87 (0.30‐1.44) | 1.06 (0.41‐1.72) | 0.82 (0.36‐1.28) | 1.05 (0.55‐1.55) |
| 5 least deprived | ref | ref | ref | ref |
| Black African, 1 most deprived | 0.74 (0.50‐0.97) | 0.54 (0.29‐0.78) | 0.54 (0.31‐0.78) | 0.55 (0.32‐0.78) |
| 2 | 0.80 (0.56‐1.04) | 0.63 (0.38‐0.88) | 0.65 (0.42‐0.89) | 0.62 (0.38‐0.86) |
| 3 | 0.98 (0.73‐1.24) | 0.78 (0.51‐1.05) | 0.76 (0.51‐1.01) | 0.80 (0.55‐1.05) |
| 4 | 1.00 (0.71‐1.28) | 0.82 (0.53‐1.12) | 0.92 (0.64‐1.20) | 0.73 (0.45‐1.01) |
| 5 least deprived | ref | ref | ref | ref |
| Any Other Black background, 1 most deprived | 0.66 (0.32‐1.00) | 0.62 (0.26‐0.98) | 0.85 (0.50‐1.21) | 0.68 (0.33‐1.03) |
| 2 | 0.64 (0.28‐0.99) | 0.70 (0.32‐1.07) | 0.93 (0.56‐1.29) | 0.81 (0.45‐1.17) |
| 3 | 0.71 (0.33‐1.08) | 0.67 (0.27‐1.08) | 1.02 (0.64‐1.41) | 0.96 (0.58‐1.34) |
| 4 | 0.81 (0.38‐1.23) | 0.95 (0.49‐1.40) | 1.15 (0.73‐1.58) | 0.96 (0.53‐1.38) |
| 5 least deprived | ref | ref | ref | ref |
| Chinese, 1 most deprived | 0.80 (0.42‐1.18) | 0.90 (0.51‐1.28) | 1.17 (0.75‐1.59) | 0.69 (0.36‐1.03) |
| 2 | 1.12 (0.72‐1.51) | 1.04 (0.63‐1.44) | 1.25 (0.81‐1.68) | 0.83 (0.49‐1.17) |
| 3 | 0.92 (0.49‐1.35) | 1.27 (0.85‐1.70) | 1.02 (0.55‐1.50) | 0.77 (0.41‐1.13) |
| 4 | 0.87 (0.41‐1.33) | 1.14 (0.69‐1.59) | 1.29 (0.82‐1.76) | 0.75 (0.37‐1.13) |
| 5 least deprived | ref | ref | ref | ref |
| Any other ethnic group, 1 most deprived | 0.75 (0.56‐0.94) | 0.82 (0.61‐1.03) | 0.81 (0.61‐1.00) | 0.91 (0.72‐1.10) |
| 2 | 0.81 (0.61‐1.01) | 0.85 (0.63‐1.07) | 0.89 (0.69‐1.09) | 0.98 (0.79‐1.18) |
| 3 | 0.81 (0.60‐1.02) | 0.91 (0.67‐1.14) | 0.94 (0.73‐1.15) | 1.00 (0.80‐1.21) |
| 4 | 0.90 (0.67‐1.14) | 0.82 (0.56‐1.08) | 1.05 (0.81‐1.28) | 1.06 (0.83‐1.29) |
| 5 least deprived | ref | ref | ref | ref |
| Not stated or unknown, 1 most deprived | 1.01 (0.96‐1.07) | 1.01 (0.94‐1.07) | 0.97 (0.91‐1.02) | 1.03 (0.98‐1.09) |
| 2 | 0.98 (0.92‐1.04) | 1.01 (0.94‐1.08) | 0.97 (0.91‐1.03) | 1.05 (0.99‐1.10) |
| 3 | 1.00 (0.94‐1.06) | 1.02 (0.95‐1.09) | 1.01 (0.95‐1.07) | 1.04 (0.98‐1.10) |
| 4 | 1.05 (0.98‐1.11) | 1.01 (0.94‐1.09) | 0.95 (0.89‐1.01) | 1.01 (0.95‐1.07) |
| 5 | ref | ref | ref | ref |
Figure 1.
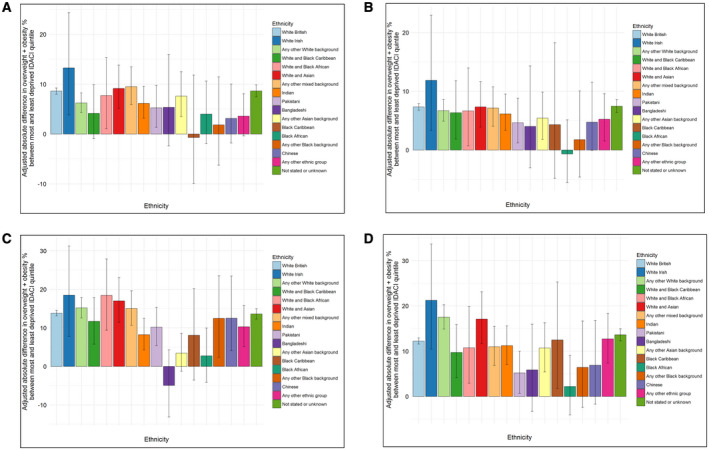
Predicted adjusted difference in combined overweight and obesity prevalence between most deprived IDACI quintile and least deprived quintile within ethnic group among (A) Reception girls, (B) Reception boys, (C) Year 6 girls, and (D) Year 6 boys. IDACI, Income Deprivation affecting Children Index based on the Lower‐layer Super Output Area of the child residence. [Color figure can be viewed at wileyonlinelibrary.com]
Discussion
This study sought to examine the prevalence and risk of overweight/obesity among expanded categories of ethnicity within boys and girls in Reception and Year 6 school years in England and the differential influence of SEP. Strong ethnic differences between SEP groups were evident. Importantly, the differences in overweight/obesity prevalence between ethnic groups persisted after adjustment for SEP, age at measurement, and month of measurement in a multivariable model. In other words, ethnicity had an independent effect on overweight/obesity prevalence among boys and girls in Reception and Year 6. Furthermore, the inequitable distribution of overweight/obesity between the most and least advantaged widened for most ethnic groups between Reception and Year 6, highlighting the need for culturally appropriate intervention throughout this critical life stage that consists of all the years of primary school. These findings are important for clinicians, public health researchers, community members, and policy makers alike in England and in other developed multicultural societies to address widening inequalities, develop culturally appropriate interventions, and investigate the multifaceted (14) drivers of increased risk.
Our study confirms previous findings based in England that ethnic variations in overweight and obesity persist after adjustment for SEP (28). This study furthers this research by examining expanded categories of ethnicity and also detailing the risk of overweight/obesity by sex, year‐level, and SEP‐specific ethnic groups. Interestingly, our study shows that ethnicity does have a differential influence among specific sex and SEP groups, which is similar to the Early Childhood Longitudinal Study, Kindergarten Class of 1998–1999 in the United States (6). For example, in the adjusted model for the interaction between ethnicity and SEP, Black African children in Year 6 had very small differentials in overweight/obesity risk between the least and most deprived. This means that the disparity in overweight/obesity risk among Black African children compared with White British children was largely consistent across SEP quintiles, suggesting other environmental and/or cultural factors are driving increased risk. In our study, Black African children were most likely to belong to quintiles 1 to 3 for SEP, and they may face disadvantage on both the individual level and area level, termed deprivation amplification (38). It has previously been observed that persons living in deprived areas experience reduced access to health‐promoting environments (e.g., fresh and affordable food, less concentration of fast food outlets, park/recreation facilities, walkability) (39), although evidence to the contrary does exist (40). Further research is needed to confirm these proposed drivers of risk to create evidence‐based solutions, as children from a Black African background had higher rates of overweight/obesity compared with those from a White British background across all sexes, both school years studied, and SEP quintiles.
Study strengths include the nationally representative sample of children that was obtained under an opt‐out (passive consent) procedure, achieving ≥95% participation rates among Reception and Year 6 students in state‐run primary schools. The application of an opt‐out (passive) consent procedure reduces the influence of nonparticipation bias on estimates of overweight and obesity, which has been estimated to be as high as −5.4 percentage points under opt‐in (active) consent procedures in school‐based research (41). The combination of 2 years of the NCMP allowed for examination of 17 distinct ethnicity categories for year‐level, sex, and socioeconomic variations in overweight/obesity risk. This is in contrast to previous analyses of the NCMP in which truncated categories of ethnicity were typically used (28). Additionally, the authors believe this is the first known study in England using ethnic groups at granular (as against aggregated) levels to examine the interaction between SEP and ethnicity, highlighting sex‐, ethnicity‐, and SEP‐specific differences in risk. Finally, in the UK, in contrast with other developed countries such as Australia and the United States, the reported residence of children is converted to a very refined measure of area‐level deprivation through IDACI as LSOAs reflect small geographic units of around 672 households (34). Although this does not account for individual economic situations, it is far superior to international equivalents, such as the Socioeconomic Index for Areas in Australia, which represents a mean of 8,744 individuals (42). However, the authors acknowledge the approximation of individual income deprivation from area‐level information as a study limitation.
Our study has several limitations. First, classification of ethnicity was based on information contained within school records and according to NHS definitions (35). This classification does not allow for level of acculturation of the individual or the family to be calculated. In Australia, it was found that children who maintained their traditional (African) culture as opposed to adopting the new Australian culture (assimilation) had lower BMI scores (43). Investigating the levels of acculturation, sociodemographic mobility or social mobility, and other important environmental, social, and behavioral drivers of childhood obesity (e.g., parent obesity, parent education, neighborhood environment, physical activity, dietary intake) would provide further insights into the reasons behind the strong SEP and ethnicity risks for obesity.
Second, despite combining 2 years of the NCMP, some ethnic minority and SEP subgroups had very low participant numbers, which may have influenced the observed associations. This is particularly relevant for White Irish children and those in the least deprived quintile as more than 50% of participants were in the two most deprived quintiles. We were also unable to analyze specific combinations of ethnicity within the “Any other mixed background” because of low participant numbers and an absence of this information being collected in school records. Furthermore, by combining overweight and obesity, we may have found stronger or weaker associations with ethnicity than would have been the case from consideration of obesity alone. Future research should look at comparing the earliest years of the NCMP (2006/2007 and 2007/2008) with the most recent years (2017/2018 and 2018/2019) to examine whether the inequity gap between the most and least deprived is widening over time, particularly with overweight, obesity, and severe obesity examined separately.
Third, it has been observed that BMI may not be an accurate proxy for excess body fat among Black African (overestimation) and South Asian (underestimation) children in the UK (44). To allow for international comparison, the IOTF age‐ and sex‐specific BMI growth reference was used in this study to classify overweight and obesity and was developed from representative national data sets from six countries (UK, United States, Netherlands, Brazil, Singapore, and Hong Kong) (31). The application of proposed UK ethnic‐specific BMI cut points for Black African and South Asian children (45) would have altered the observed results. However, the authors highlight that there is insufficient evidence to switch to the proposed ethnic‐specific references for surveillance purposes (vs. screening) as they were developed using N = 1,999 children drawn from convenience samples of children in London (student response rates ranging from 52% to 64%) (45) and they are unlikely to be representative of South Asian and Black African children across England. In 2004, the World Health Organization faced a similar conundrum and decided against lowering the standard international adult classification for overweight (BMI = 25 kg/m2) and obesity (BMI = 30) for Asian adults (45) but recommended the use of additional public health cut points for overweight and obesity (BMI = 23 and BMI = 27.5) to reflect increased risk among Asian adults. The authors acknowledge this as a limitation and welcome advancements and consensus in this field.
Conclusion
This study highlights that ethnicity, reflecting cultural drivers, has an independent influence on overweight/obesity risk after adjustment for socioeconomic status, age, and month of measurement. Overweight/obesity risk was significantly higher for several ethnic minority groups compared with White British children. Additionally, inequity in overweight/obesity risk between the most and least disadvantaged was highest for several ethnic minority groups, with this gap widening between Reception and Year 6. This highlights the fact that interventions that focus on wider drivers of risk (e.g., national contexts, intermediate health risks) in addition to socioeconomic drivers need to be developed and implemented.
Funding agencies
This work was supported by Public Health England. Dr. Strugnell was supported by an Australian Government Endeavour Research Fellowship and Deakin University to travel and work with Public Health England throughout September 2016 to January 2017.
Disclosure
The authors declared no conflict of interest.
Supporting information
Table S1‐S3
References
- 1. Wang YC, McPherson K, Marsh T, Gortmaker SL, Brown M. Health and economic burden of the projected obesity trends in the USA and the UK. Lancet 2011;378:815‐825. [DOI] [PubMed] [Google Scholar]
- 2. Gortmaker SL, Swinburn BA, Levy D, et al. Changing the future of obesity: science, policy, and action. Lancet 2011;378:838‐847. [DOI] [PMC free article] [PubMed] [Google Scholar]
- 3. Han JC, Lawlor DA, Kimm S. Childhood obesity. Lancet 2010;375:1737‐1748. [DOI] [PMC free article] [PubMed] [Google Scholar]
- 4. Singh AS, Mulder C, Twisk JWR, van Mechelen W, Chinapaw MJM. Tracking of childhood overweight into adulthood: a systematic review of the literature. Obes Rev 2008;9:474‐488. [DOI] [PubMed] [Google Scholar]
- 5. NHS Digital . National Child Measurement Programme ‐ England, 2016/2017. https://digital.nhs.uk/data-and-information/publications/statistical/national-child-measurement-programme/2016-17-school-year. Published October 19, 2017.
- 6. Banks GG, Berlin KS, Rybak TM, Kamody RC, Cohen R. Disentangling the longitudinal relations of race, sex, and socioeconomic status, for childhood body mass index trajectories. J Pediatr Psychol 2016;41:453‐461. [DOI] [PubMed] [Google Scholar]
- 7. Rossen LM. Neighbourhood economic deprivation explains racial/ethnic disparities in overweight and obesity among children and adolescents in the U.S.A. J Epidemiol Community Health 2014;68:123‐129. [DOI] [PMC free article] [PubMed] [Google Scholar]
- 8. Barriuso L, Miqueleiz E, Albaladejo R, Villanueva R, Santos JM, Regidor E. Socioeconomic position and childhood‐adolescent weight status in rich countries: a systematic review, 1990‐2013. BMC Pediatr 2015;15:129. doi:10.1186/s12887‐015‐0443‐3 [DOI] [PMC free article] [PubMed] [Google Scholar]
- 9. Shrewsbury V, Wardle J. Socioeconomic status and adiposity in childhood: a systematic review of cross‐sectional studies 1990–2005. Obesity (Silver Spring) 2008;16:275‐284. [DOI] [PubMed] [Google Scholar]
- 10. Townsend N, Rutter H, Foster C. Evaluating the evidence that the prevalence of childhood overweight is plateauing. Pediatr Obes 2012;7:343‐346. [DOI] [PubMed] [Google Scholar]
- 11. Olds T, Maher C, Zumin S, et al. Evidence that the prevalence of childhood overweight is plateauing: data from nine countries. Int J Pediatr Obes 2011;6:342‐360. [DOI] [PubMed] [Google Scholar]
- 12. Cambridge Academic Content Dictionary. Cambridge: Cambridge University Press; 2008. [Google Scholar]
- 13. Wallace C, Vandevijvere S, Lee A, Jaacks LM, Schachner M, Swinburn B. Dimensions of national culture associated with different trajectories of male and female mean body mass index in countries over 25 years. Obes Rev 2019;20(suppl 2):20‐29. [DOI] [PubMed] [Google Scholar]
- 14. Kumanyika SK. Unraveling common threads in obesity risk among racial/ethnic minority and migrant populations. Public Health 2019;172:125‐134. [DOI] [PMC free article] [PubMed] [Google Scholar]
- 15. El‐Sayed AM, Scarborough P, Galea S. Ethnic inequalities in obesity among children and adults in the UK: a systematic review of the literature. Obes Rev 2011;12:e516‐e534. [DOI] [PubMed] [Google Scholar]
- 16. Balakrishnan R, Webster P, Sinclair D. Trends in overweight and obesity among 5‐7‐year‐old White and South Asian children born between 1991 and 1999. J Public Health (Oxf) 2008;30:139‐144. [DOI] [PubMed] [Google Scholar]
- 17. Jebb SA, Rennie KL, Cole TJ. Prevalence of overweight and obesity among young people in Great Britain. Public Health Nutr 2004;7:461‐465. [DOI] [PubMed] [Google Scholar]
- 18. Wardle J, Brodersen NH, Cole TJ, Jarvis MJ, Boniface DR. Development of adiposity in adolescence: five year longitudinal study of an ethnically and socioeconomically diverse sample of young people in Britain. BMJ 2006;332:1130‐1135. [DOI] [PMC free article] [PubMed] [Google Scholar]
- 19. Saxena S, Ambler G, Cole TJ, Majeed A. Ethnic group differences in overweight and obese children and young people in England: cross sectional survey. Arch Dis Child 2004;89:30‐36. [PMC free article] [PubMed] [Google Scholar]
- 20. Rutter H. Data briefing. Child obesity worst in deprived areas. HSJ website. https://www.hsj.co.uk/primary‐care/child‐obesity‐worst‐in‐deprived‐areas/1276763.article. Published May 8, 2008. [PubMed] [Google Scholar]
- 21. Duran‐Tauleria E, Rona RJ, Chinn S. Factors associated with weight for height and skinfold thickness in British children. J Epidemiol Community Health 1995;49:466‐473. [DOI] [PMC free article] [PubMed] [Google Scholar]
- 22. Rona RJ, Chinn S. National Study of Health and Growth: social and biological factors associated with weight‐for‐height and triceps skinfold of children from ethnic groups in England. Ann Hum Biol 1987;14:231‐248. [DOI] [PubMed] [Google Scholar]
- 23. Chinn S, Hughes JM, Rona RJ. Trends in growth and obesity in ethnic groups in Britain. Arch Dis Child 1998;78:513‐517. [DOI] [PMC free article] [PubMed] [Google Scholar]
- 24. Shaw NJ, Crabtree NJ, Kibirige MS, Fordham JN. Ethnic and gender differences in body fat in British schoolchildren as measured by DXA. Arch Dis Child 2007;92:872‐875. [DOI] [PMC free article] [PubMed] [Google Scholar]
- 25. Hawkins SS, Cole TJ, Law C, Millennium Cohort Study Child Health G . An ecological systems approach to examining risk factors for early childhood overweight: findings from the UK Millennium Cohort Study. J Epidemiol Community Health 2009;63:147‐155. [DOI] [PMC free article] [PubMed] [Google Scholar]
- 26. Harding S, Maynard MJ, Cruickshank K, Teyhan A. Overweight, obesity and high blood pressure in an ethnically diverse sample of adolescents in Britain: the Medical Research Council DASH study. Int J Obes (Lond) 2008;32:82‐90. [DOI] [PubMed] [Google Scholar]
- 27. Whincup PH, Gilg JA, Papacosta O, et al. Early evidence of ethnic differences in cardiovascular risk: cross sectional comparison of British South Asian and white children. BMJ 2002;324:635. doi:10.1136/bmj.324.7338.635 [DOI] [PMC free article] [PubMed] [Google Scholar]
- 28. Public Health England . National Child Measurement Programme‐ Changes in children's body mass index between 2006/7 and 2015/16. London: PHE; 2017. [Google Scholar]
- 29. NHS Digital . National Child Measurement Programme – England, 2015‐16. https://digital.nhs.uk/data‐and‐information/publications/statistical/national‐child‐measurement‐programme/2015‐16‐school‐year. Published November 3, 2016.
- 30. Public Health England . National Child Measurement Programme Operational Guidance 2017. London: PHE; 2017:46. [Google Scholar]
- 31. Cole TJ, Lobstein T. Extended international (IOTF) body mass index cut‐offs for thinness, overweight and obesity. Pediatr Obes 2012;7:284‐294. [DOI] [PubMed] [Google Scholar]
- 32. Cole TJ, Freeman JV, Preece MA. Body mass index reference curves for the UK, 1990. Arch Dis Child 1995;73:25‐29. [DOI] [PMC free article] [PubMed] [Google Scholar]
- 33. Vidmar SI, Cole TJ, Pan H. Standardizing anthropometric measures in children and adolescents with functions for egen: Update. Stata J 2013;13:366‐378. [Google Scholar]
- 34. Office for National Statistics . 2011 census: population and household estimates for small areas in England and Wales, March 2011. London: Office for National Statistics; 2012. [Google Scholar]
- 35. NHS . Ethnic category code. https://www.datadictionary.nhs.uk/data_dictionary/data_field_notes/e/ep/ethnic_category_de.asp?shownav=1. Accessed June 6, 2018.
- 36. Department for Communities and Local Government . The English Indices of Deprivation 2015 Statistical Release. London: Office for National Statistics; 2015. [Google Scholar]
- 37. Macintyre S. Deprivation amplification revisited; or, is it always true that poorer places have poorer access to resources for healthy diets and physical activity? Int J Behav Nutr Phys Act 2007;4:32. doi:10.1186/1479‐5868‐4‐32 [DOI] [PMC free article] [PubMed] [Google Scholar]
- 38. Sallis JF, Glanz K. Physical activity and food environments: solutions to the obesity epidemic. Milbank Q 2009;87:123‐154. [DOI] [PMC free article] [PubMed] [Google Scholar]
- 39. Smith DM, Cummins S, Taylor M, et al. Neighbourhood food environment and area deprivation: spatial accessibility to grocery stores selling fresh fruit and vegetables in urban and rural settings. Int J Epidemiol 2010;39:277‐284. [DOI] [PubMed] [Google Scholar]
- 40. Strugnell C, Orellana L, Hayward J, Millar L, Swinburn B, Allender S. Active (opt‐in) consent underestimates mean BMI‐z and the prevalence of overweight and obesity compared to passive (opt‐out) consent. Evidence from the Healthy Together Victoria and Childhood Obesity Study. Int J Environ Res Public Health 2018;15:747. [DOI] [PMC free article] [PubMed] [Google Scholar]
- 41. Australian Bureau of Statistics . 2072.0‐Census of Population and Housing: TableBuilder Basic, Australia, 2016 https://www.abs.gov.au/AUSSTATS/abs@.nsf/Lookup/2072.0Main+Features12016?OpenDocument Published April 7, 2017. [Google Scholar]
- 42. Renzaho AM, Swinburn B, Burns C. Maintenance of traditional cultural orientation is associated with lower rates of obesity and sedentary behaviours among African migrant children to Australia. Int J Obes (Lond) 2008;32:594‐600. [DOI] [PubMed] [Google Scholar]
- 43. Nightingale CM, Rudnicka AR, Owen CG, Cook DG, Whincup PH. Patterns of body size and adiposity among UK children of South Asian, black African‐Caribbean and white European origin: Child Heart And health Study in England (CHASE Study). Int J Epidemiol 2011;40:33‐44. [DOI] [PMC free article] [PubMed] [Google Scholar]
- 44. Hudda MT, Nightingale CM, Donin AS, et al. Body mass index adjustments to increase the validity of body fatness assessment in UK black African and South Asian children. Int J Obes (Lond) 2017;41:1048‐1055. [DOI] [PMC free article] [PubMed] [Google Scholar]
- 45. WHO Expert Consultation . Appropriate body‐mass index for Asian populations and its implications for policy and intervention strategies. Lancet 2004;363:157‐163. [DOI] [PubMed] [Google Scholar]
Associated Data
This section collects any data citations, data availability statements, or supplementary materials included in this article.
Supplementary Materials
Table S1‐S3