

Summary
Leaf reflectance spectra have been increasingly used to assess plant diversity. However, we do not yet understand how spectra vary across the tree of life or how the evolution of leaf traits affects the differentiation of spectra among species and lineages.
Here we describe a framework that integrates spectra with phylogenies and apply it to a global dataset of over 16 000 leaf‐level spectra (400–2400 nm) for 544 seed plant species. We test for phylogenetic signal in spectra, evaluate their ability to classify lineages, and characterize their evolutionary dynamics.
We show that phylogenetic signal is present in leaf spectra but that the spectral regions most strongly associated with the phylogeny vary among lineages. Despite among‐lineage heterogeneity, broad plant groups, orders, and families can be identified from reflectance spectra. Evolutionary models also reveal that different spectral regions evolve at different rates and under different constraint levels, mirroring the evolution of their underlying traits.
Leaf spectra capture the phylogenetic history of seed plants and the evolutionary dynamics of leaf chemistry and structure. Consequently, spectra have the potential to provide breakthrough assessments of leaf evolution and plant phylogenetic diversity at global scales.
Keywords: evolution, leaf spectra, phylogenetic signal, remote sensing, seed plants
Introduction
Efficient assessment of plant biodiversity at global scales (Turner, 2014; Jetz et al., 2016) is critical at a time when biodiversity loss is accelerating at alarming rates (Pimm et al., 2014; Ceballos et al., 2015). Plant diversity has profound impacts on the functioning of ecosystems (Tilman et al., 2014; Isbell et al., 2015; Duffy et al., 2017) and on the benefits that humans derive from them (Cardinale et al., 2012; Isbell et al., 2017). These biodiversity effects are due to more than just the number of species; they depend on the gamut of plant morphologies and physiological strategies, and on the amount of genetic and phylogenetic diversity present in an assemblage (Maherali & Klironomos, 2007; Cardinale et al., 2007; Cadotte et al., 2008, 2010; Crutsinger et al., 2009).
Plant reflectance spectra – the profile of light reflected by leaves across different wavelengths – have emerged as an invaluable tool to estimate plant functional (Kokaly et al., 2009; Féret & Asner, 2014; Schneider et al., 2017) and taxonomic diversity (Clark et al., 2005; Asner & Martin, 2011; Cavender‐Bares et al., 2016), assess their consequences for ecosystem processes (Schweiger et al., 2018), and guide conservation (Asner et al., 2017b). Plant leaves synthesize a range of structures and chemical compounds and many of these traits can be detected using spectral reflectance (Kokaly et al., 2009; Ustin et al., 2009; Serbin et al., 2014). For example, pigments such as chlorophyll, carotenoids, and anthocyanins strongly absorb light in the visible range of the spectrum (visible, 400–700 nm) while water, lignin, cellulose, phenolics, and leaf structural features interact with light in the near‐infrared (NIR, 700–1100 nm) and short‐wave infrared (SWIR, 1100–2500 nm) ranges (Kokaly et al., 2009; Ustin et al., 2009; Asner et al., 2014).
Spectra capture the diversity in leaf traits that have accumulated over the course of seed plant evolution (Reich et al., 2003; Kattge et al., 2011; Cornwell et al., 2014) but the relationship between the spectral variation among species and lineages and the evolutionary process that generates this variation remains unknown. Prior evidence has revealed that leaf spectra contain information about evolutionary relationships within (Madritch et al., 2014; Cavender‐Bares et al., 2016) and among species (Asner & Martin, 2011; Cavender‐Bares et al., 2016; McManus et al., 2016), enabling us to estimate taxonomic diversity from spectra. However, broad coverage of spectral data across the plant tree of life has not been previously available for a single analysis to determine which spectral regions encode phylogenetic information or to assess the generality of such relationships across taxa.
The potential for spectral data to revolutionize biodiversity monitoring contrasts with our lack of mechanistic understanding about how spectral diversity arises over evolutionary time. The evolution of spectra likely depends on the dynamics of leaf trait evolution but this dependency has yet to be demonstrated. Moreover, spectra integrate leaf traits in complex ways (Jacquemoud & Baret, 1990; Féret et al., 2017) and multiple traits can affect the same spectral region (Curran, 1989). This complicates identifying which trait underlies the evolutionary signatures found at a given spectral band. A modeling framework that explicitly integrates evolution, leaf traits, and the emerging spectra is required to understand how the evolution of different leaf attributes combine to affect the spectra.
Establishing how evolution affects spectra has important implications not only for explaining how spectral variation arises but also for biodiversity detection. Promising approaches for assessing plant diversity rely on the idea that spectral variation is positively associated with functional and taxonomic diversity (Schweiger et al., 2018; Gholizadeh et al., 2019; Wang & Gamon, 2019; Laliberté et al., 2020). However, evolutionary processes such as convergence, constraints, and differential rates of evolution may complicate the relationship between spectral and taxonomic diversity (Ollinger, 2011). For example, adaptations to arid environments may result in distant relatives converging to have similar leaf traits and reflectance spectra. Likewise, spectral regions that are highly similar among lineages may result from slow rates of evolution, from constrained evolution – when only certain traits underlying spectral properties are evolutionarily viable – or a combination of both. It is now clear that certain trait combinations are favored over evolutionary time while others are not viable (Díaz et al., 2015) and that evolutionary convergence can affect the spectra and the inferences we draw from them (Ollinger, 2011). Despite the impact that different evolutionary processes may have on spectral diversity, we do not yet know if different spectral regions evolve at different rates or have been constrained to stay within a limited range over the course of evolution.
In this article, we attempt to close the gap between evolutionary and spectral biology. Our specific goals are to (1) establish which regions of the leaf reflectance spectrum capture the signal of phylogenetic history and how that varies across the tree of life, (2) test whether the phylogenetic identity of lineages can be predicted from spectral data, (3) describe a framework to model the evolution of leaf spectra, and (4) estimate how different evolutionary processes generate the diversity of leaf spectra we observe. To achieve these goals, we compiled an unparalleled dataset of over 16 000 leaf‐level reflectance spectra (400–2400 nm) for 544 seed plant species spanning temperate and tropical latitudes in the Americas and Europe (Fig. 1b–d). We used the prospect5 leaf radiative transfer model (Féret et al., 2008) to estimate five leaf attributes, number of leaf layers, chlorophyll and carotenoid content, equivalent water thickness, and leaf mass per area (LMA). To explore the evolutionary patterns in leaf spectra, we generated a time‐calibrated molecular phylogeny for the species in our dataset using five chloroplast markers.
Fig. 1.
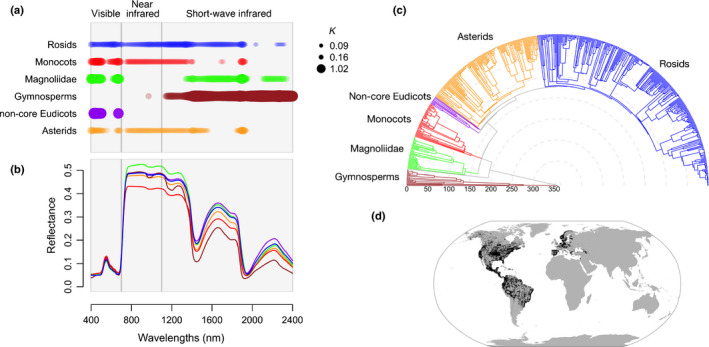
Phylogenetic signal detected in leaf spectra varies across wavelengths and across the major lineages of seed plants. (a) Phylogenetic signal calculated using Blomberg's K (K) estimated for each major lineage of seed plants separately, where regions with significant signal (P‐value < 0.05) are marked by colored circles with diameters proportional to K. (b) Mean spectra for each of the six major groups: gymnosperms (brown), Magnoliidae (green), monocots (red), non‐core eudicots (purple), asterids (orange), and rosids (blue). (c) Time‐calibrated maximum likelihood molecular phylogeny for 544 species of seed plants in the dataset. Divergence times, in millions of years, are shown on the radius axis. (d) Geographic distribution of the species sampled in the compiled dataset.
Materials and Methods
Spectral data acquisition and processing
We compiled a dataset of over 16 000 leaf‐level reflectance spectra (400–2400 nm) for 544 seed plant species spanning temperate and tropical latitudes in the Americas and Europe (Fig. 1d). The dataset only includes spectra of mature, sun‐exposed leaves measured in the spring or summer seasons. Leaf spectra were measured with two full‐range field spectroradiometers – an ASD FieldSpec 3 (Analytical Spectral Devices, Boulder, CO, USA) and an SVC HR‐1024i (Spectra Vista Corp., Poughkeepsie, NY, USA) – using leaf clips and artificial light sources. We processed the reflectance spectra using the R package spectrolab (Meireles et al., 2017) by trimming wavelengths shorter than 400 nm or longer than 2400 nm, splicing the sensor overlap regions of each spectrum, and subsampling the spectra to 10 nm resolution using spline interpolation. The spectral data measured with different spectroradiometers were harmonized using a partial least squares regression (PLSR) model (Supporting Information Fig. S1; Methods S1).
Phylogenetic reconstruction
The taxonomic name of every taxon in the spectral dataset was updated using a Taxonomic Name Resolution System (TNRS) implemented in taxize (Chamberlain & Szöcs, 2013). We obtained DNA sequences from GenBank (https://www.ncbi.nlm.nih.gov/genbank/) for each species for at least one of five chloroplast markers commonly used in plant phylogenetics (rbcL, matK, ndhF, atpB, and trnL) using phylogenerator2 (Pearse & Purvis, 2013). Sequences were aligned with mafft (Katoh & Standley, 2013) using the FFT‐NS‐i iterative refinement algorithm. We reconstructed a maximum likelihood phylogeny with raxml (Stamatakis, 2014) using a GTR + γ model of evolution and a backbone family‐level‐tree taken from the Open Tree of Life project (Hinchliff et al., 2015). We time‐calibrated the phylogeny with treepl (Smith & O'Meara, 2012) using 35 node age constraints derived from the timetree database (Hedges et al., 2015) (http://timetreebeta.igem.temple.edu). We assessed clade support and age estimates using bootstrap replicates and by comparing our tree to a recent comprehensive time‐tree (Li et al., 2019) (Figs S2, S3; Methods S2).
Testing for phylogenetic signal
We measured the degree of phylogenetic signal across the spectrum and among lineages using Blomberg's K statistic (Blomberg et al., 2003) implemented in Phytools (Revell, 2012) while accounting for intraspecific variation that may be environmentally driven (Felsenstein, 2008). Blomberg's K measures the degree to which trait variance lies within clades vs among clades as compared to a Brownian expectation. Statistical significance was assessed using 999 tip‐swap randomizations.
Classifying major seed plant lineages using spectra
We used a partial least squares discriminant analysis (PLS–DA) model (Chevallier et al., 2006) implemented in caret (Kuhn, 2008) to classify spectral samples at different phylogenetic levels, including major seed plant groups (gymnosperms, Magnoliidae, monocots, non‐core eudicots, asterids, and rosids (Chase et al., 2016)), orders, and families. For each level, we created 10 pseudo‐replicated datasets by randomly resampling spectra (with replacement) to ensure that each category was represented by the same number of samples. We selected the optimal number of PLS components using a 10‐fold cross‐validation analysis using 80% of the data to train the model and 20% to test its predictive performance. We assessed classification accuracy by conducting independent PLS‐DA analyses on 10 pseudo‐replicated datasets and computing their classification matrices (or confusion matrices).
Framework for integrating phylogenies and spectra
Our framework for the evolution of leaf spectra consists of two parts: a model of trait evolution and a radiative transfer model. The evolution of a quantitative trait along a phylogeny is often modeled with Eqn 1 (Hansen, 1997; Butler & King, 2004; Cressler et al., 2015),
| (Eqn 1) |
which describes the processes by which a trait X changes over time. The σ2 dB(t) term describes evolution as an unconstrained, random drift process B(t), known as Brownian motion, occurring at a rate σ2 (Hansen & Martins, 1996). The first term describes the trait (X(t)) being pulled towards an optimum value θ with strength α (Hansen, 1997). The expected time for a trait to get halfway to an optimum – the phylogenetic half‐life – is defined as loge(2)/α. A regime where evolution pulls trait values, that is, when α > 0, towards a single optimum θ describes constrained evolution, whereas an evolutionary regime where α = 0 collapses into a simpler, unconstrained Brownian motion model.
We used the prospect5 (Féret et al., 2008) radiative transfer model, as implemented in PEcAnRTM (Shiklomanov et al., 2019), to link the evolved quantitative leaf traits to reflectance spectra. prospect5 represents leaves as light‐absorbing and scattering plates with rough surfaces and uses leaf biochemical content, including chlorophyll a and b (Cab), carotenoid (Car), water (Cw) as well as leaf morphology, including leaf mass per area (Cm) and a leaf structure parameter N to predict the reflectance spectrum (400–2400 nm). The model can be run in both forward and reverse directions, predicting spectra from traits or traits from spectra.
We validated our model by testing if phylogenetic signal in traits translates into detectable phylogenetic signal at the spectrum level. To do so, we simulated spectra from traits that evolved under Brownian motion and estimated Blomberg's K on the spectra (Fig. S4; Methods S3).
Estimating evolutionary rates on spectra
We fitted different models of evolution to each spectral wavelength and leaf trait from prospect5 (Féret et al., 2008) using geiger (Harmon et al., 2008). We compared three models of evolution: (1) white noise, where evolution is statistically independent of the phylogeny, (2) Brownian motion, where spectra and traits evolve by random drift along the phylogeny at rate , and (3) Ornstein–Uhlenbeck, where reflectance and traits evolve by drift but are also pulled towards an optimum θ with strength α, effectively constraining the range of realized values. All models accounted for within‐species variability. For each spectral wavelength or trait, we used the Akaike Information Criterion (AIC) values of each model to compute their Akaike weights (Burnham & Anderson, 2002) and determine model‐averaged estimates for the α and σ2 parameters.
Data availability
The spectral and phylogenetic data that support the findings of this study are openly available in Figshare at https://doi.org/10.6084/m9.figshare.12449153 and https://doi.org/10.6084/m9.figshare.12449147.
Results
Phylogenetic signal and lineage identification
We found significant levels of phylogenetic signal in the spectra of all major clades (Fig. 1a) and most orders of seed plants, with the exception of Myrtales, Dipsacales, and Cornales (Fig. S5). However, the location of the phylogenetic signal within the spectrum varies among lineages (Fig. 1a). For example, phylogenetic history is mostly associated with the visible and NIR regions within the monocots whereas, in gymnosperms, it is strongly associated with SWIR region – which captures leaf structure and water content (Curran, 1989).
Major lineages across the seed plant tree of life can be identified from leaf spectra using a PLS‐DA classification model. The mean and standard deviation (SD) classification accuracy was 81.4% (SD 1.0%) for major clades, 66.4% (SD 1.4%) for orders, and 67.6% (SD 1.2%) for families (Fig. 2). There is considerable variation in classification performance for different lineages within a phylogenetic level. For example, Pinales are correctly identified 95.4% (SD 2.2%) of the time whereas the classification accuracy for Fabales is 9.2% (SD 6%) (Fig. S6).
Fig. 2.
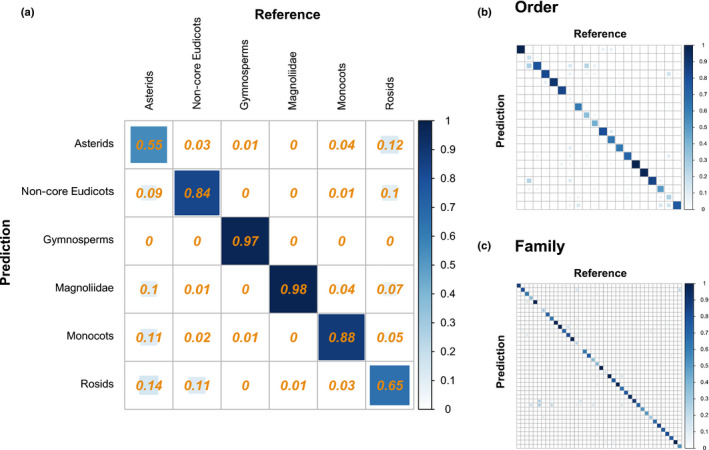
Classification matrices from PLS‐DA models for identifying (a) broad seed plant lineages, (b) orders, and (c) families using leaf spectra. Correctly identified lineages are shown on the diagonal while false positives and false negatives are shown on the off‐diagonals. The color and size of the square in each cell indicate the proportion of samples in the cell. Detailed classification matrices for orders and families are shown in Supporting Information Fig. S6.
Framework for modeling the evolution of spectra
We posit that leaf chemical and structural traits evolve and that the spectra emerging from the interaction of those traits with light carry the signature of evolution. Our framework (Fig. 3) couples models of trait evolution (Butler & King, 2004; O'Meara et al., 2006) with leaf radiative transfer models (RTMs; (Jacquemoud & Baret, 1990; Féret et al., 2008, 2017), which predict spectral profiles from leaf chemical and structural parameters. Traits are allowed to evolve along a phylogeny at varying rates and under different dynamics – for example random drift or directional evolution – and RTMs use these evolved leaf traits to predict spectra. Our simulations show that phylogenetic signal in a trait translates into detectable phylogenetic signal in the spectral regions most influenced by the trait (Fig. S4).
Fig. 3.
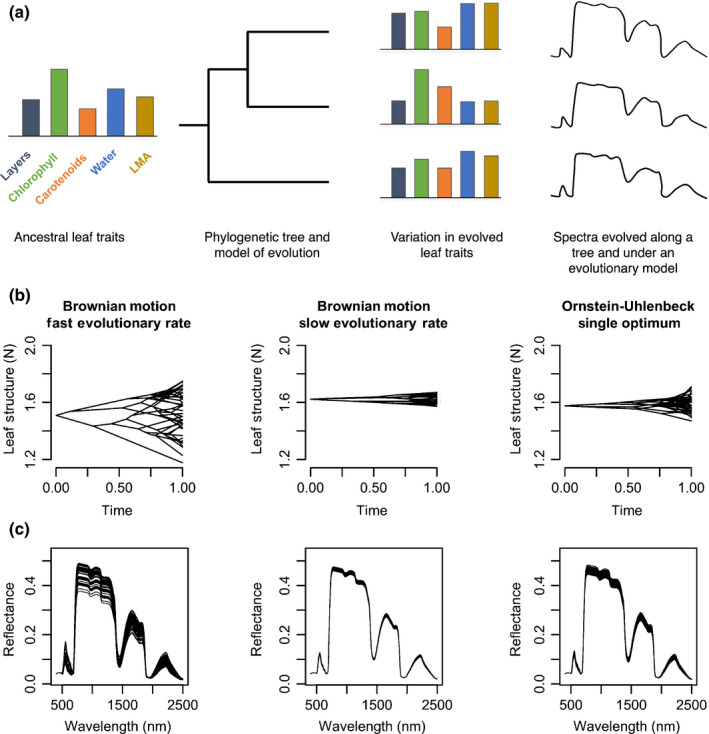
Framework integrating trait evolution and leaf spectral models that enables the estimation of evolutionary parameters from spectra and simulation of leaf spectra along a phylogeny. (a) Ancestral leaf attributes evolve along a phylogenetic tree under a given evolutionary regime, generating the current leaf attributes that underlie spectra. From the evolved leaf attributes, radiative transfer models (RTMs) – such as prospect – estimate spectra that carry the signature of the phylogeny. (b) Evolution of leaf structure according to the unconstrained Brownian motion model, showing that fast rates of evolution result in more trait variation than slow rates. An Ornstein–Uhlenbeck (OU) process models an evolutionary constraint around an optimum trait value and results in less trait variation than an unconstrained Brownian motion model despite having the same rate of evolution. (c) Spectra estimated with the prospect5 model, where all leaf attributes evolved under the same model except for leaf structure, which evolved under the three scenarios outlined earlier.
Understanding the evolution of spectra
For most spectral regions, evolutionary models that account for constraints or directional evolution (Ornstein–Uhlenbeck) are preferred (Akaike weight > 0.5; Fig. 4a) over models that assume unconstrained evolution along a phylogeny (Brownian motion) or where spectra are statistically independent of evolutionary history (white noise). In regions of the spectrum associated with photosynthetic pigments (visible; 400–700 nm) and leaf water content (1450 and 1950 nm), evidence for evolutionary constraints was especially strong (Akaike weight > 0.9). Additionally, the strength of the evolutionary pull – or the shift in spectral reflectance due to directional evolutionary forces – estimated for the visible region was considerably higher than the pull estimated for the NIR and SWIR regions (mean αvis = 0.024, mean αinfrared = 0.0056, z‐score > 1.96, P‐value < 0.05, two‐tailed; Fig. 4b). As a result, species take on average 31 million years (Myr) to evolve halfway towards their optimum reflectance in the visible spectrum but 190 Myr to do so in the infrared (Fig. 4b).
Fig. 4.
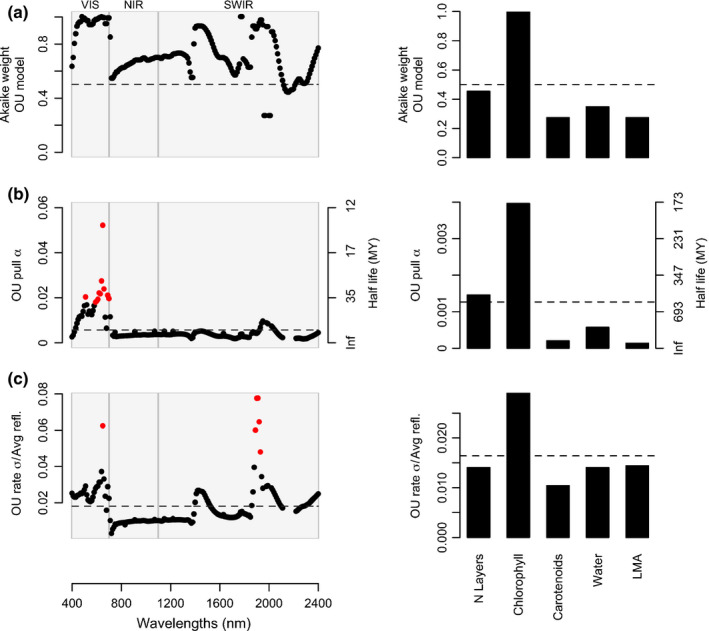
Evolution of leaf spectra and their underlying leaf attributes. (a) Akaike weights for the Ornstein–Uhlenbeck (OU) model of evolution – which incorporates evolutionary constraints – when compared to models that assume either unconstrained evolution along the phylogeny (Brownian motion) or statistical independence between traits and phylogenetic history (white noise; not shown since its Akaike weights were ≈ 0). (b, c) Model‐averaged strength of evolutionary constraints and rates of evolution across the spectrum and leaf traits. Red points denote values significantly different (z‐score > 1.96; P‐value < 0.05; two‐tailed) from the mean, shown as a dashed line. (b) Degree of evolutionary constraint α across the spectrum and for each leaf attribute. (c) Rates of evolution across spectral regions and leaf traits. Rates are square‐root transformed to be in reflectance units and scaled by the mean reflectance of each band. VIS, visible range of the spectrum; NIR, near‐infrared; SWIR, short‐wave infrared; LMA, leaf mass per area; MY, million years.
Discussion
This large‐scale analysis reveals that leaf spectra capture the phylogenetic history of seed plants. However, phylogenetic signal varies substantially across the spectrum and among lineages, suggesting that the leaf traits that underlie spectra are differentially conserved or labile across the tree of life. These results corroborate previous findings that phylogenetic signal varies across the spectra (McManus et al., 2016) and are congruent with evidence that trait distinctiveness varies greatly across traits and across lineages (Cornwell et al., 2014; Flores et al., 2014). The ongoing accumulation of spectral datasets and expansion of taxonomic sampling will enable us to better interpret why specific lineages display contrasting patterns of phylogenetic signal in spectra.
We suggest that the association between spectra and phylogeny provides an explanation for why populations, species, and lineages can be identified based on how leaves interact with and reflect light. Our ability to identify plant lineages from spectra is compatible with results from other studies (Clark et al., 2005; Asner & Martin, 2011; Asner et al., 2014; Cavender‐Bares et al., 2016), although they have typically focused on classifying groups below the family level and at a restricted geographic region. For example, the c. 60% classification accuracy for families of Amazonian trees (Asner & Martin, 2011) closely matches our results. We did not explicitly explore why the classification accuracy for certain lineages was considerably lower than the average accuracy across lineages. However, the fact that our models underperformed when classifying hyperdiverse lineages – such as the orders Asterales and Fabales in which diversification has likely led to a wide range of leaf traits – suggests that groups with high levels of functional diversity will be more challenging to identify spectrally using machine learning approaches. Overall, it is encouraging that we can identify broad phylogenetic groups using a global spectral dataset, especially given the impact that factors such as leaf age, soil type, and elevation can have on leaf chemistry and the resulting spectra (Asner & Martin, 2016; Wu et al., 2017).
No single spectral region concentrates most of the information about evolutionary history across all seed plants and yet, phylogenetic groups can be identified based on their spectral profiles. These findings have two important consequences for planning biodiversity assessments based on remotely sensed spectral data (Jetz et al., 2016) and for using plant spectra directly in studies of biodiversity (Cavender‐Bares et al., 2017). First, efforts to assess and monitor plant diversity will require the acquisition of spectra across the entire solar reflected spectrum (400–2400 nm) instead of focusing on a few predefined spectral bands or on limited spectral regions. Second, spectra can potentially be used to identify phylogenetic lineages when species‐level detection is impractical, for example, in high diversity systems where a large proportion of species are understudied or unknown to science. Critically, the phylogenetic resolution at which diversity is detected can be decided based on the accuracy of the classification models rather than defined a priori.
Our spectral evolution model can be fitted to data or be used in simulations to understand how different evolutionary processes affect the spectra. By applying this framework to our dataset, we found that spectral variation in seed plants has been constrained by evolution to varying degrees, especially in the visible region, which is associated with pigment content. This result indicates that only a narrow range of photosynthetic pigment content is evolutionarily viable, possibly reflecting functional constraints in the photosynthetic machinery (Ollinger, 2011). Finally, our modeling framework can be used to simulate the spectra of plants under different evolutionary dynamics. As a hypothetical example, it could generate predictions about how convergent adaptation to shade would affect spectra and about its effects on our ability to detect understory diversity.
The increasing availability of high‐dimensional spectral data at the leaf, canopy, and landscape‐level holds the promise of effectively detecting and monitoring plant biodiversity on Earth. Moving beyond the level of a leaf will require investigating how canopy structure and the effects of spatial scaling (Asner et al., 2017a; Wang et al., 2018) affect our capacity to recover evolutionary information from imaging spectroscopy. Nevertheless, our ability to describe how evolution shapes leaf spectra and to recover phylogenetic information from spectral profiles raises the enticing possibility of assessing global biodiversity remotely by directly identifying branches of the tree of life.
Author contributions
JEM, JC‐B and BCO conceived the initial concept. JEM, JC‐B, BCO, JAG, PAT, MES, SU, AS, AKS and FS participated in discussions and contributed ideas during NIMBioS meetings. PAT, SU, GPA, REM, MES, JC‐B, AS, AKS and AC contributed spectral data sets. JEM constructed the time tree, developed the spectral evolution model, and analyzed the data. JEM, JC‐B and BCO wrote the initial draft of the article. All authors participated in editing the final manuscript.
Supporting information
Fig. S1 Reconciliation of spectral data acquired using different instruments.
Fig. S2 Majority rule consensus tree of the 544 seed plant species used in this study.
Fig. S3 Relationship between genus ages estimated by Li et al. (2019) and by our analysis.
Fig. S4 Phylogenetic signal of leaf spectra emerging from the evolution of RTM parameters.
Fig. S5 Phylogenetic signal detected in leaf spectra at the order level.
Fig. S6 PLS‐DA classification of orders and families of seed plants.
Methods S1 Harmonization of spectral data measured with different instruments.
Methods S2 Assessment of clade support and divergence times.
Methods S3 Validation of the framework for modeling the evolution of leaf spectra.
Please note: Wiley Blackwell are not responsible for the content or functionality of any Supporting Information supplied by the authors. Any queries (other than missing material) should be directed to the New Phytologist Central Office.
Acknowledgements
The authors thank Angela Moles and two anonymous reviewers for their helpful comments on the manuscript. This study was funded by the National Science Foundation and National Aeronautics and Space Administration through the Dimensions of Biodiversity program (DEB‐1342872 grant to JC‐B, DEB‐1342778 grant to PAT, and DEB‐1342823 grant to JAG) and by the National Institute for Mathematical Biology and Synthesis (‘Remote Sensing of Biodiversity’ working group led by JC‐B, JEM, BCO and PAT). The contribution of MES is supported by the University of Zurich Research Priority Program on ‘Global Change and Biodiversity’. This publication was supported by the USDA National Institute of Food and Agriculture, Hatch project ME0‐22022 through the Maine Agricultural & Forest Experiment Station. Maine Agricultural and Forest Experiment Publication Number 3760.
Contributor Information
José Eduardo Meireles, Email: jose.meireles@maine.edu.
Jeannine Cavender‐Bares, Email: cavender@umn.edu.
References
- Asner GP, Martin RE. 2011. Canopy phylogenetic, chemical and spectral assembly in a lowland Amazonian forest. New Phytologist 189: 999–1012. [DOI] [PubMed] [Google Scholar]
- Asner GP, Martin RE. 2016. Convergent elevation trends in canopy chemical traits of tropical forests. Global Change Biology 22: 2216–2227. [DOI] [PubMed] [Google Scholar]
- Asner GP, Martin RE, Anderson CB, Kryston K, Vaughn N, Knapp DE, Bentley LP, Shenkin A, Salinas N, Sinca F et al 2017a. Scale dependence of canopy trait distributions along a tropical forest elevation gradient. New Phytologist 214: 973–988. [DOI] [PubMed] [Google Scholar]
- Asner GP, Martin RE, Carranza‐Jiménez L, Sinca F, Tupayachi R, Anderson CB, Martinez P. 2014. Functional and biological diversity of foliar spectra in tree canopies throughout the Andes to Amazon region. New Phytologist 204: 127–139. [DOI] [PubMed] [Google Scholar]
- Asner GP, Martin RE, Knapp DE, Tupayachi R, Anderson CB, Sinca F, Vaughn NR, Llactayo W. 2017b. Airborne laser‐guided imaging spectroscopy to map forest trait diversity and guide conservation. Science 355: 385–389. [DOI] [PubMed] [Google Scholar]
- Blomberg SP, Garland T Jr, Ives AR. 2003. Testing for phylogenetic signal in comparative data: behavioral traits are more labile. Evolution 57: 717–745. [DOI] [PubMed] [Google Scholar]
- Burnham KP, Anderson DR. 2002. Model selection and multimodel inference: a practical information‐theoretic approach, 2 nd edn New York, NY, USA: Springer. [Google Scholar]
- Butler MA, King AA. 2004. Phylogenetic comparative analysis: a modeling approach for adaptive evolution. American Naturalist 164: 683–695. [DOI] [PubMed] [Google Scholar]
- Cadotte MW, Cardinale BJ, Oakley TH. 2008. Evolutionary history and the effect of biodiversity on plant productivity. Proceedings of the National Academy of Sciences, USA 105: 17012–17017. [DOI] [PMC free article] [PubMed] [Google Scholar]
- Cadotte MW, Jonathan Davies T, Regetz J, Kembel SW, Cleland E, Oakley TH. 2010. Phylogenetic diversity metrics for ecological communities: integrating species richness, abundance and evolutionary history. Ecology Letters 13: 96–105. [DOI] [PubMed] [Google Scholar]
- Cardinale BJ, Duffy JE, Gonzalez A, Hooper DU, Perrings C, Venail P, Narwani A, Mace GM, Tilman D, Wardle DA et al 2012. Biodiversity loss and its impact on humanity. Nature 486: 59–67. [DOI] [PubMed] [Google Scholar]
- Cardinale BJ, Wright JP, Cadotte MW, Carroll IT, Hector A, Srivastava DS, Loreau M, Weis JJ. 2007. Impacts of plant diversity on biomass production increase through time because of species complementarity. Proceedings of the National Academy of Sciences, USA 104: 18123–18128. [DOI] [PMC free article] [PubMed] [Google Scholar]
- Cavender‐Bares J, Gamon JA, Hobbie SE, Madritch MD, Meireles JE, Schweiger AK, Townsend PA. 2017. Harnessing plant spectra to integrate the biodiversity sciences across biological and spatial scales. American Journal of Botany 104: 966–969. [DOI] [PubMed] [Google Scholar]
- Cavender‐Bares J, Meireles JE, Couture JJ, Kaproth MA, Kingdon CC, Singh A, Serbin SP, Center A, Zuniga E, Pilz G et al 2016. Associations of leaf spectra with genetic and phylogenetic variation in oaks: prospects for remote detection of biodiversity. Remote Sensing 8: 221. [Google Scholar]
- Ceballos G, Ehrlich PR, Barnosky AD, García A, Pringle RM, Palmer TM. 2015. Accelerated modern human–induced species losses: entering the sixth mass extinction. Science Advances 1: e1400253. [DOI] [PMC free article] [PubMed] [Google Scholar]
- Chamberlain SA, Szöcs E. 2013. taxize: taxonomic search and retrieval in R. F1000Research 2: 191. [DOI] [PMC free article] [PubMed] [Google Scholar]
- Chase MW, Christenhusz MJM, Fay MF, Byng JW, Judd WS, Soltis DE, Mabberley DJ, Sennikov AN, Soltis PS, Stevens PF. 2016. An update of the Angiosperm Phylogeny Group classification for the orders and families of flowering plants: APG IV. Botanical Journal of the Linnean Society 181: 1–20. [Google Scholar]
- Chevallier S, Bertrand D, Kohler A, Courcoux P. 2006. Application of PLS‐DA in multivariate image analysis. Journal of Chemometrics 20: 221–229. [Google Scholar]
- Clark ML, Roberts DA, Clark DB. 2005. Hyperspectral discrimination of tropical rain forest tree species at leaf to crown scales. Remote Sensing of Environment 96: 375–398. [Google Scholar]
- Cornwell WK, Westoby M, Falster DS, FitzJohn RG, O'Meara BC, Pennell MW, McGlinn DJ, Eastman JM, Moles AT, Reich PB et al 2014. Functional distinctiveness of major plant lineages. Journal of Ecology 102: 345–356. [Google Scholar]
- Cressler CE, Butler MA, King AA. 2015. Detecting adaptive evolution in phylogenetic comparative analysis using the Ornstein–Uhlenbeck model. Systematic Biology 64: 953–968. [DOI] [PubMed] [Google Scholar]
- Crutsinger GM, Cadotte MW, Sanders NJ. 2009. Plant genetics shapes inquiline community structure across spatial scales. Ecology Letters 12: 285–292. [DOI] [PubMed] [Google Scholar]
- Curran PJ. 1989. Remote sensing of foliar chemistry. Remote Sensing of Environment 30: 271–278. [Google Scholar]
- Díaz S, Kattge J, Cornelissen JHC, Wright IJ, Lavorel S, Dray S, Reu B, Kleyer M, Wirth C, Colin Prentice I et al 2015. The global spectrum of plant form and function. Nature 529: 167–171. [DOI] [PubMed] [Google Scholar]
- Duffy JE, Godwin CM, Cardinale BJ. 2017. Biodiversity effects in the wild are common and as strong as key drivers of productivity. Nature 549: 261–264. [DOI] [PubMed] [Google Scholar]
- Felsenstein J. 2008. Comparative methods with sampling error and within‐species variation: contrasts revisited and revised. American Naturalist 171: 713–725. [DOI] [PubMed] [Google Scholar]
- Féret J‐B, Asner GP. 2014. Mapping tropical forest canopy diversity using high‐fidelity imaging spectroscopy. Ecological Applications 24: 1289–1296. [DOI] [PubMed] [Google Scholar]
- Féret J‐B, François C, Asner GP, Gitelson AA, Martin RE, Bidel LPR, Ustin SL, le Maire G, Jacquemoud S. 2008. PROSPECT‐4 and 5: advances in the leaf optical properties model separating photosynthetic pigments. Remote Sensing of Environment 112: 3030–3043. [Google Scholar]
- Féret JB, Gitelson AA, Noble SD, Jacquemoud S. 2017. PROSPECT‐D: towards modeling leaf optical properties through a complete lifecycle. Remote Sensing of Environment 193: 204–215. [Google Scholar]
- Flores O, Garnier E, Wright IJ, Reich PB, Pierce S, Dìaz S, Pakeman RJ, Rusch GM, Bernard‐Verdier M, Testi B et al 2014. An evolutionary perspective on leaf economics: phylogenetics of leaf mass per area in vascular plants. Ecology and Evolution 4: 2799–2811. [DOI] [PMC free article] [PubMed] [Google Scholar]
- Gholizadeh H, Gamon JA, Townsend PA, Zygielbaum AI, Helzer CJ, Hmimina GY, Yu R, Moore RM, Schweiger AK, Cavender‐Bares J. 2019. Detecting prairie biodiversity with airborne remote sensing. Remote Sensing of Environment 221: 38–49. [Google Scholar]
- Hansen TF. 1997. Stabilizing selection and the comparative analysis of adaptation. Evolution 51: 1341. [DOI] [PubMed] [Google Scholar]
- Hansen TF, Martins EP. 1996. Translating between microevolutionary process and macroevolutionary patterns: the correlation structure of interspecific data. Evolution 50: 1404. [DOI] [PubMed] [Google Scholar]
- Harmon LJ, Weir JT, Brock CD, Glor RE, Challenger W. 2008. GEIGER: investigating evolutionary radiations. Bioinformatics 24: 129–131. [DOI] [PubMed] [Google Scholar]
- Hedges SB, Marin J, Suleski M, Paymer M, Kumar S. 2015. Tree of life reveals clock‐like speciation and diversification. Molecular Biology and Evolution 32: 835–845. [DOI] [PMC free article] [PubMed] [Google Scholar]
- Hinchliff CE, Smith SA, Allman JF, Burleigh JG, Chaudhary R, Coghill LM, Crandall KA, Deng J, Drew BT, Gazis R et al 2015. Synthesis of phylogeny and taxonomy into a comprehensive tree of life. Proceedings of the National Academy of Sciences, USA 112: 12764–12769. [DOI] [PMC free article] [PubMed] [Google Scholar]
- Isbell F, Craven D, Connolly J, Loreau M, Schmid B, Beierkuhnlein C, Bezemer TM, Bonin C, Bruelheide H, de Luca E et al 2015. Biodiversity increases the resistance of ecosystem productivity to climate extremes. Nature 526: 574–577. [DOI] [PubMed] [Google Scholar]
- Isbell F, Gonzalez A, Loreau M, Cowles J, Díaz S, Hector A, Mace GM, Wardle DA, O'Connor MI, Duffy JE et al 2017. Linking the influence and dependence of people on biodiversity across scales. Nature 546: 65–72. [DOI] [PMC free article] [PubMed] [Google Scholar]
- Jacquemoud S, Baret F. 1990. PROSPECT: a model of leaf optical properties spectra. Remote Sensing of Environment 34: 75–91. [Google Scholar]
- Jetz W, Cavender‐Bares J, Pavlick R, Schimel D, Davis FW, Asner GP, Guralnick R, Kattge J, Latimer AM, Moorcroft P et al 2016. Monitoring plant functional diversity from space. Nature Plants 2: 16024. [DOI] [PubMed] [Google Scholar]
- Katoh K, Standley DM. 2013. MAFFT multiple sequence alignment software version 7: improvements in performance and usability. Molecular Biology and Evolution 30: 772–780. [DOI] [PMC free article] [PubMed] [Google Scholar]
- Kattge J, Díaz S, Lavorel S, Prentice IC, Leadley P, Bönisch G, Garnier E, Westoby M, Reich PB, Wright IJ et al 2011. TRY – a global database of plant traits. Global Change Biology 17: 2905–2935. [Google Scholar]
- Kokaly RF, Asner GP, Ollinger SV, Martin ME, Wessman CA. 2009. Characterizing canopy biochemistry from imaging spectroscopy and its application to ecosystem studies. Remote Sensing of Environment 113: S78–S91. [Google Scholar]
- Kuhn M. 2008. Building predictive models in R using the caret package. Journal of Statistical Software 28: 1–26.27774042 [Google Scholar]
- Laliberté E, Schweiger AK, Legendre P. 2020. Partitioning plant spectral diversity into alpha and beta components. Ecology Letters 23: 370–380. [DOI] [PMC free article] [PubMed] [Google Scholar]
- Li H‐T, Yi T‐S, Gao L‐M, Ma P‐F, Zhang T, Yang J‐B, Gitzendanner MA, Fritsch PW, Cai J, Luo Y et al 2019. Origin of angiosperms and the puzzle of the Jurassic gap. Nature Plants 5: 461–470. [DOI] [PubMed] [Google Scholar]
- Madritch MD, Kingdon CC, Singh A, Mock KE, Lindroth RL, Townsend PA. 2014. Imaging spectroscopy links aspen genotype with below‐ground processes at landscape scales. Philosophical Transactions of the Royal Society of London. Series B: Biological Sciences 369: 20130194. [DOI] [PMC free article] [PubMed] [Google Scholar]
- Maherali H, Klironomos JN. 2007. Influence of phylogeny on fungal community assembly and ecosystem functioning. Science 316: 1746–1748. [DOI] [PubMed] [Google Scholar]
- McManus K, Asner GP, Martin RE, Dexter KG, Kress WJ, Field C. 2016. Phylogenetic structure of foliar spectral traits in tropical forest canopies. Remote Sensing 8: 196. [Google Scholar]
- Meireles JE, Schweiger AK, Cavender‐Bares J. 2017. Spectrolab: class and methods for hyperspectral data. R Package. [WWW document] URL https://cran.r‐project.org/web/packages/spectrolab [accessed 20 July 2018]. [Google Scholar]
- O'Meara BC, Ané C, Sanderson MJ, Wainwright PC. 2006. Testing for different rates of continuous trait evolution using likelihood. Evolution 60: 922–933. [PubMed] [Google Scholar]
- Ollinger SV. 2011. Sources of variability in canopy reflectance and the convergent properties of plants. New Phytologist 189: 375–394. [DOI] [PubMed] [Google Scholar]
- Pearse WD, Purvis A. 2013. phyloGenerator: an automated phylogeny generation tool for ecologists. Methods in Ecology and Evolution 4: 692–698. [Google Scholar]
- Pimm SL, Jenkins CN, Abell R, Brooks TM, Gittleman JL, Joppa LN, Raven PH, Roberts CM, Sexton JO. 2014. The biodiversity of species and their rates of extinction, distribution, and protection. Science 344: 1246752. [DOI] [PubMed] [Google Scholar]
- Reich PB, Wright IJ, Cavender‐Bares J, Craine JM, Oleksyn J, Westoby M, Walters MB. 2003. The evolution of plant functional variation: traits, spectra, and strategies. International Journal of Plant Sciences 164: 143–164. [Google Scholar]
- Revell LJ. 2012. phytools: an R package for phylogenetic comparative biology (and other things). Methods in Ecology and Evolution 3: 217–223. [Google Scholar]
- Schneider FD, Morsdorf F, Schmid B, Petchey OL, Hueni A, Schimel DS, Schaepman ME. 2017. Mapping functional diversity from remotely sensed morphological and physiological forest traits. Nature Communications 8: 1441. [DOI] [PMC free article] [PubMed] [Google Scholar]
- Schweiger AK, Cavender‐Bares J, Townsend PA, Hobbie SE, Madritch MD, Wang R, Tilman D, Gamon JA. 2018. Plant spectral diversity integrates functional and phylogenetic components of biodiversity and predicts ecosystem function. Nature Ecology & Evolution 2: 976–982. [DOI] [PubMed] [Google Scholar]
- Serbin SP, Singh A, McNeil BE, Kingdon CC, Townsend PA. 2014. Spectroscopic determination of leaf morphological and biochemical traits for northern temperate and boreal tree species. Ecological Applications 24: 1651–1669. [DOI] [PubMed] [Google Scholar]
- Shiklomanov A, Serbin S, Dietze M. 2019. PEcAnRTM: PEcAn functions used for radiative transfer modeling. R package. [WWW document] URL https://github.com/ashiklom/PEcAnRTM [accessed 27 October 2018]. [Google Scholar]
- Smith SA, O'Meara BC. 2012. treePL: divergence time estimation using penalized likelihood for large phylogenies. Bioinformatics 28: 2689–2690. [DOI] [PubMed] [Google Scholar]
- Stamatakis A. 2014. RAxML version 8: a tool for phylogenetic analysis and post‐analysis of large phylogenies. Bioinformatics 30: 1312–1313. [DOI] [PMC free article] [PubMed] [Google Scholar]
- Tilman D, Isbell F, Cowles JM. 2014. Biodiversity and ecosystem functioning. Annual Review of Ecology, Evolution, and Systematics 45: 471–493. [Google Scholar]
- Turner W. 2014. Conservation. Sensing biodiversity. Science 346: 301–302. [DOI] [PubMed] [Google Scholar]
- Ustin SL, Gitelson AA, Jacquemoud S, Schaepman M, Asner GP, Gamon JA, Zarco‐Tejada P. 2009. Retrieval of foliar information about plant pigment systems from high resolution spectroscopy. Remote Sensing of Environment 113: S67–S77. [Google Scholar]
- Wang R, Gamon JA. 2019. Remote sensing of terrestrial plant biodiversity. Remote Sensing of Environment 231: 111218. [Google Scholar]
- Wang R, Gamon JA, Cavender‐Bares J, Townsend PA, Zygielbaum AI. 2018. The spatial sensitivity of the spectral diversity‐biodiversity relationship: an experimental test in a prairie grassland. Ecological Applications 28: 541–556. [DOI] [PubMed] [Google Scholar]
- Wu J, Chavana‐Bryant C, Prohaska N, Serbin SP, Guan K, Albert LP, Yang X, van Leeuwen WJD, Garnello AJ, Martins G et al 2017. Convergence in relationships between leaf traits, spectra and age across diverse canopy environments and two contrasting tropical forests. New Phytologist 214: 1033–1048. [DOI] [PubMed] [Google Scholar]
Associated Data
This section collects any data citations, data availability statements, or supplementary materials included in this article.
Supplementary Materials
Fig. S1 Reconciliation of spectral data acquired using different instruments.
Fig. S2 Majority rule consensus tree of the 544 seed plant species used in this study.
Fig. S3 Relationship between genus ages estimated by Li et al. (2019) and by our analysis.
Fig. S4 Phylogenetic signal of leaf spectra emerging from the evolution of RTM parameters.
Fig. S5 Phylogenetic signal detected in leaf spectra at the order level.
Fig. S6 PLS‐DA classification of orders and families of seed plants.
Methods S1 Harmonization of spectral data measured with different instruments.
Methods S2 Assessment of clade support and divergence times.
Methods S3 Validation of the framework for modeling the evolution of leaf spectra.
Please note: Wiley Blackwell are not responsible for the content or functionality of any Supporting Information supplied by the authors. Any queries (other than missing material) should be directed to the New Phytologist Central Office.
Data Availability Statement
The spectral and phylogenetic data that support the findings of this study are openly available in Figshare at https://doi.org/10.6084/m9.figshare.12449153 and https://doi.org/10.6084/m9.figshare.12449147.