

Abstract
Floral plantings are promoted to foster ecological intensification of agriculture through provisioning of ecosystem services. However, a comprehensive assessment of the effectiveness of different floral plantings, their characteristics and consequences for crop yield is lacking. Here we quantified the impacts of flower strips and hedgerows on pest control (18 studies) and pollination services (17 studies) in adjacent crops in North America, Europe and New Zealand. Flower strips, but not hedgerows, enhanced pest control services in adjacent fields by 16% on average. However, effects on crop pollination and yield were more variable. Our synthesis identifies several important drivers of variability in effectiveness of plantings: pollination services declined exponentially with distance from plantings, and perennial and older flower strips with higher flowering plant diversity enhanced pollination more effectively. These findings provide promising pathways to optimise floral plantings to more effectively contribute to ecosystem service delivery and ecological intensification of agriculture in the future.
Keywords: Agroecology, agri‐environment schemes, bee pollinators, conservation biological control, ecological intensification, farmland biodiversity, floral enhancements, natural pest regulation, pollination reservoirs, sustainable agriculture, wildflower strips
Our quantitative synthesis of the impacts of floral plantings on pest control, crop pollination and yield reveals that flower strips, but not hedgerows, enhanced pest control services in adjacent fields by 16% on average, while effects on crop pollination and yield were more variable. Our synthesis identifies several important drivers of this variability in effectiveness of plantings: pollination services declined exponentially with distance from plantings, and perennial and older flower strips with higher flowering plant diversity enhanced pollination more effectively, with important implications for the the design and implementation of these measures to effectively promote ecological intensification of agriculture in the future
Introduction
Meeting the increasing demands for agricultural products while minimising negative impacts on biodiversity and ecosystem health is among the greatest global challenges (Godfray et al., 2010). Intensive agricultural production and the simplification of agroecosystems threaten farmland biodiversity and associated ecosystem services worldwide (Foley et al., 2005; IPBES, 2016; IPBES, 2018). Concerns over loss of biodiversity and associated impairment of ecosystem services have helped strengthen the implementation of agri‐environmental schemes and other measures to mitigate such negative consequences (IPBES, 2016). Beyond restoration of farmland biodiversity in general, an implicit or explicit goal of such measures is to foster sustainable agricultural production through ecological intensification by harnessing biodiversity‐based ecosystem services, such as crop pollination and natural pest control services (Bommarco et al., 2013; Pywell et al., 2015; Kovács‐Hostyánszki et al., 2017). In intensively managed agroecosystems, the establishment of strips or other areas of flowering herbaceous plants, hereafter ‘flower strips’, and hedgerows are among the most commonly applied measures to achieve these goals (Scheper et al., 2015; Tschumi et al., 2015; Williams et al., 2015; Dainese et al., 2017; Kremen et al., 2019). For example, the establishment of flower strips or hedgerows is supported by the Common Agricultural Policy (CAP) in the European Union and by the Farm Bill (e.g. programs of the Natural Resources Conservation Service of the United States Department of Agriculture) in the United States (IPBES, 2016; Kovács‐Hostyánszki et al., 2017; Venturini et al., 2017a). Typically established along field edges, flower strips and hedgerows offer resources for pollinators and natural enemies of crop pests such as shelter, oviposition sites, overwintering opportunities and food resources (Tschumi et al., 2015; Holland et al., 2016; Kremen et al., 2019) and can locally increase their abundance and diversity (Haaland et al., 2011; Scheper et al., 2013; M’Gonigle et al., 2015; Williams et al., 2015; Tschumi et al., 2016; Sutter et al., 2017, 2018; Kremen et al., 2019). It is less well understood whether enhanced species diversity translates to ex situ provisioning of pollination, pest control and increased yield. The ‘exporter’ hypothesis (Morandin and Kremen, 2013; Kremen et al., 2019) predicts enhanced delivery of ecosystem services through functional spillover from floral plantings (sensu Blitzer et al., 2012; Albrecht et al., 2007; Morandin and Kremen, 2013; Pywell et al., 2015; Tschumi et al., 2015, 2016; Sutter et al., 2017). However, according the ‘concentrator’ hypothesis (Kremen et al., 2019; also referred to as the ‘aggregation’ hypothesis (Venturini et al., 2017a) or the ‘Circe principle’ (Lander et al., 2011)), resource‐rich floral plantings temporarily compete with flowering crops and concentrate pollinators and natural enemies from the surrounding agriculture into the floral plantings, potentially resulting in (transiently) reduced crop pollination and pest control services (Nicholson et al., 2019). This may explain why plantings fail to enhance crop pollination or pest control services, even if they successfully promote local pollinator or natural enemy abundance in restored habitats (e.g. Phillips and Gardiner, 2015; Tscharntke et al., 2016; Karp et al., 2018).
The lack of clarity about effects of flower plantings on ecosystem service provisioning and crop yield scattered in numerous case studies is a barrier to farmer adoption of such measures (Garbach and Long, 2017; Kleijn et al., 2019). A quantitative synthesis of such demonstrated broad evidence may assist farmers in making the decision to adopt these measures (Garbach and Long, 2017; Kleijn et al., 2019). Moreover, it is important to gain a general understanding of whether such effects are restricted to the area of the crop near to the adjacent planting (Ganser et al., 2018) or be detectable over larger distances (Tschumi et al., 2015). Such knowledge should be considered when designing schemes with optimal spatial arrangement of plantings across agricultural landscapes (Ricketts et al., 2008; Garibaldi et al., 2011), and to facilitate cost‐benefit assessments (Blaauw and Isaacs, 2014; Morandin et al., 2016; Dainese et al., 2017; Williams et al., 2019; Haan et al., 2020).
To improve the effectiveness of flower strip and hedgerow plantings in promoting crop pollination, natural pest control, and potentially crop production, we need to better understand what determines their failure or success. We hypothesise that at least three factors influence the effectiveness of floral plantings in enhancing crop pollination and pest control services: plant diversity, time since establishment and landscape context. First, theory predicts that higher plant species richness, and associated trait diversity, promotes diverse pollinator and natural enemy communities due to positive selection and complementarity effects across space and time (e.g. Campbell et al., 2012; Scheper et al., 2013; Sutter et al., 2017; M’Gonigle et al., 2017). However, the role of plant diversity driving effects of floral plantings on pollination and natural pest control services benefits to nearby crops is poorly understood. Second, time since the establishment of floral plantings is likely to play a key role for the local delivery of crop pollination and pest control services (Thies and Tscharntke, 1999). This is of particular relevance for sown flower strips that may range from short‐lived annual plantings to longer‐lived perennial plantings. Perennial plantings should offer better overwintering and nesting opportunities for pollinators and natural enemies (Ganser et al., 2019; Kremen et al., 2019) and may foster local population growth over time (e.g. Blaauw and Isaacs, 2014; Venturini et al., 2017b). Third, the effectiveness of floral plantings could depend on the agricultural landscape context. Highly simplified landscapes likely have depleted source populations of pollinators and natural enemies. In complex landscapes, however, the ecological contrast introduced by floral plantings may not be great enough to result in strong effects (Scheper et al., 2013). Strongest effects are therefore expected at intermediate landscape complexity (intermediate landscape complexity hypothesis; Tscharntke et al., 2005; Kleijn et al., 2011). Although support for this hypothesis has been found with respect to biodiversity restoration (e.g. Bátary et al., 2011; Scheper et al., 2013, 2015; but see e.g. Hoffmann et al., 2020), its validity for ecological intensification and the local delivery of crop pollination and pest control services has only just begun to be explored (Jonsson et al., 2015; Grab et al., 2018; Rundlöf et al., 2018).
Here we use data from 35 studies including 868 service‐site‐year combinations across 529 sites in North American, European and New Zealand agroecosystems to quantitatively assess the effectiveness of two of the most commonly implemented ecological intensification measures, flower strips and hedgerows, in promoting crop pollination, pest control services and crop production. Moreover, we aim to better understand the key factors driving failure or success of these measures to suggest improvement of their design and implementation. Specifically, we address: (1) the extent to which flower strips and hedgerows enhance pollination and pest control services in adjacent crops; (2) how service provisioning changes with distance from floral plantings; (3) the role of plant diversity and time since establishment of floral plantings in promoting pollination and pest control services; (4) whether simplification of the surrounding landscape modifies the responses; and (5) whether floral plantings enhance crop yield in adjacent fields.
Our synthesis reveals general positive effects of flower strips but not hedgerows on pest control services in adjacent crop fields. Effects on crop pollination, however, depended on flowering plant diversity and age since establishment, with more species‐rich and older plantings being more effective. However, no consistent impacts of flower strips on crop yield could be detected, highlighting the need for further optimisations of plantings as measures for ecological intensification.
Materials and Methods
Data collection
To identify data sets suitable to address our research questions, we performed a search in the ISI Web of Science and SCOPUS (records published until 31.12.2017 were considered). To minimise potential publication bias (i.e. the file drawer problem, Rosenthal 1979) and to maximise the number of relevant data sets we also searched for unpublished data by contacting potential data holders through researcher networks. Data sets had to meet the following requirements to be included in the analysis: (1) pollination and/or pest control services in crops were measured in both crop fields adjacent to floral plantings and control fields without planting; (2) the replication at the field level was ≥ six fields per study (three fields with plantings and three without; i.e. disqualifying small‐scaled plot treatment comparisons within fields). We contacted data holders fulfilling these requirements and requested primary data on plant species richness of plantings, time since establishment, landscape context and crop yield (see below) in addition to measured pollination and pest control services. Overall, we analysed data from 35 studies. We here define a study as a dataset collected by the same group of researchers for a particular crop species and ecosystem service (pest control or pollination) in a particular region during one or several sampling years. We collected 18 pest control service and 17 pollination service studies, representing a total of 868 service‐site‐year combinations across 529 sites (fields with or without adjacent floral planting; see Fig. S1 for a map showing the distribution of sites and Table S1 for detailed information about studies). In eight of these studies (122 sites) both crop pollination and pest control services were measured (Table S1).
Pollination services, pest control services and crop yield
As different studies used different methods and measures to quantify pollination services, pest control services and crop yield, we standardised data prior to statistical analysis using z‐scores (e.g. Garibaldi et al., 2013; Dainese et al., 2019). The use of z‐scores has clear advantages compared with other transformations or standardisation approaches (such as the division by the absolute value of the maximum observed level of the measured response) because (1) average z‐scores follow a normal distribution, and (2) the variability present in the raw data is not constrained as in other indices that are bound between 0 and 1 (Garibaldi et al., 2013). Pollination services were measured as seed set (number of seeds per fruit), fruit set (proportion of flowers setting fruit), pollen deposition rate (number of pollen grains deposited on stigmas within a certain time period) and, in one study, flower visitation rate (number of visits per flower within a certain time period). If available, differences in pollination service measures of open‐pollinated flowers and flowers from which pollinators were excluded were analysed. Measures of pest control services were quantified as pest parasitism (proportion of parasitised pests), pest predation (proportion of predated pests), population growth (see below) or crop damage by pests or pest densities (see Table S2 for an overview of pollination and pest control service measures across studies). Whenever possible, the pest control index based on population growth proposed by Gardiner et al. (2009) was calculated and analysed (Table S2). Note that standardised values of pest density and crop damage were multiplied by −1 because lower values of these measures reflect an increased pest control service (e.g. Karp et al., 2018). Crop yield was only considered for the analysis if a direct measure of final crop yield was available. Too few studies assessed crop quality which was therefore not considered further. Yield was measured as crop mass or number of fruits produced per unit area. Due to a lack of studies measuring crop yield in fields with and without adjacent hedgerows, the analysis of crop yield focused on effects of flower strips. Crop yield measures were available from a total of 11 flower strip studies and 194 fields (see Tables S1 and S2 for a detailed description of study systems, crop yield measures and methods used across studies).
Descriptors of floral plantings and landscape context
Flower strips are here defined as strips or other areas of planted wild native and/or non‐native flowering herbaceous plants. Hedgerows are defined as areas of linear shape planted with native and/or non‐native at least partly flowering woody plants and typically also herbaceous flowering plants. For hedgerows, information about the exact time since establishment and number of plant species was not available for most studies. The analyses of these drivers (question 3) therefore focus on flower strip effects on pollination and pest control services. Information on plant species richness was available in 12 out of 18 pest control studies and 10 out of 17 pollination studies. Whenever available, the species richness of flowering plants was used. Otherwise, for some flower strip studies, the number of sown, potentially flowering plant species (excluding grasses) was used. Time since establishment of flower strips, that is the time span between seeding or planting and data sampling, was available for all studies ranging from 3 to 122 months.
The proportional cover of arable crops was available and analysed as a proxy for landscape simplification (e.g. Tscharntke et al., 2005; Dainese et al., 2019) in 11 pest control and 12 pollination studies. Proportional cover of arable crops was calculated in circular sectors of 1 km radius around focal crops, or 750 m or 500 m radius (two studies for which data on a 1 km radius were not available; see Table S1; results remained qualitatively identical when only considering the 1 km radius datasets).
Statistical analysis
We used a mixed effect‐modelling approach to address our research questions. In all models, study was included as a random intercept to account for the hierarchical structure of the data with field measures nested within study. To assess whether flower strips and hedgerows enhanced pollination and pest control services in adjacent crops (question 1) linear mixed‐effect models with planting (field with or without planting) were separately fitted for flower strips and hedgerows for the response variables pollination service and pest control service. To test how the effects on service provisioning change with distance (continuous variable; meters) from plantings (question 2) and with landscape simplification (question 4) these explanatory variables and their interactions with the fixed effects described earlier were included in the models. Exploratory analyses showed that neither distance nor landscape simplification effects differed between flower strips and hedgerows; that is no significant interactive effects of planting type with any of the tested fixed effects. We therefore pooled flower strip and hedgerow data in the final models, excluding planting type and its two or three‐way interactions as fixed effects. In addition to linear relationships we tested for an exponential decline of measured response variables from the border of the field by fitting log10(distance) in the linear mixed‐effect models described earlier. In this case, field nested within study was included as a random effect. To test the intermediate landscape complexity hypothesis, we tested for linear as well as hump‐shaped relationships between landscape context, and its interaction with local floral plantings by fitting landscape variables as a quadratic fixed predictor in the models described earlier (second degree polynomial functions). To present the ranges covered by the agricultural landscape gradients, we did not standardise measures of landscape simplification within studies (e.g. Martin et al., 2019). To examine how pollination and pest control service provisioning relates to flower strip plant diversity and time since establishment (question 3) plant species richness and log10(number of months since establishment) were included as fixed effects in models with study as a random effect. Using log(months since establishment) predicted the data better than establishment time as linear predictor. Plant species richness and time since establishment of flower strips were not correlated (r = 0.22). Only 10 studies measured services in several years since establishment (Table S1), and we included only data from the last sampling year. To assess how the presence of plantings affected the agronomic yield of adjacent crops (question 5), we fitted a linear mixed‐effect model with the same fixed and random structure as described for question 1, but with crop yield as the response variable. Statistical analyses for different models and response variables differed in sample sizes as not all studies measured crop yield in addition to pollination or pest control services (Tables 1, Table S1). In all models we initially included planting area as a co‐variate in an explorative analysis, but removed it in the final models, as it did not explain variation in any of the models and did not improve model fit (not shown).
Table 1.
Summary of results of linear and generalised linear mixed‐effects models testing the effects of presence and type of floral plantings (flower strips and hedgerows) on crop pollination and natural pest control services, and how effects are influenced by in‐field distance, local planting characteristics and landscape context. Response variables, explanatory variables, estimates, numerator degrees of freedom and denominator degrees of freedom (Df), differences in log‐likelihood for chi‐squared tests (LRT) and P values (P < 0.05 in bold; P ≥ 0.05 < 0.10 in bold italic) are shown for each model. Note that effects of local drivers (i.e. flowering plant species richness and time since establishment) considered only crops adjacent to flower strips
| Response variable | Explanatory variable | Estimate | Df | LRT | P‐value |
|---|---|---|---|---|---|
| Effects of plantings | |||||
| Natural pest control service | Flower strip | 0.254 | 1,316 | 7.26 | 0.007 |
| Hedgerow | 0.196 | 1,60 | 1.06 | 0.303 | |
| Crop pollination service | Flower strip | 0.032 | 1,170 | 0.06 | 0.808 |
| Hedgerow | 0.097 | 1,106 | 0.28 | 0.595 | |
| Distance effects | |||||
| Natural pest control service | Planting × log(distance) | −0.051 | 1,590.9 | 1.35 | 0.245 |
| Planting | 0.199 | 1,590.4 | 5.92 | 0.015 | |
| Log(distance) | −0.052 | 1,618.5 | 5.62 | 0.018 | |
| Crop pollination service | Planting × log(distance) | −0.082 | 1,445.3 | 5.73 | 0.017 |
| Planting | 0.315 | 1,420.8 | 2.40 | 0.121 | |
| Log(distance) | −0.014 | 1,453.3 | 2.64 | 0.104 | |
| Effects of local drivers (flower strips) | |||||
| Natural pest control service | Flowering plant species richness | −0.013 | 1,49.3 | 0.47 | 0.494 |
| Log(time since establishment) | 0.104 | 1,16.1 | 1.32 | 0.251 | |
| Crop pollination service | Flowering plant species richness | 0.036 | 1,49.8 | 3.39 | 0.066 |
| Log(time since establishment) | 0.276 | 1,10.9 | 3.47 | 0.062 | |
| Effects of landscape context | |||||
| Natural pest control service | Planting × landscape simplification | −0.004 | 1,274.2 | 0.10 | 0.754 |
| Planting | 0.171 | 1,286.2 | 1.28 | 0.257 | |
| Landscape simplification | −0.007 | 1,181.9 | 1.81 | 0.179 | |
| Crop pollination service | Planting × landscape simplification | −0.003 | 1,278.9 | 0.91 | 0.340 |
| Planting | 0.198 | 1,278.9 | 0.00 | 0.950 | |
| Landscape simplification | −0.011 | 1,145.9 | 4.03 | 0.045 | |
Effect sizes provided in the text and figures are model estimates of z‐transformed response variables. For statistical inference of fixed effects we used log‐likelihood ratio tests (LRT) recommended for testing significant effects of a priori selected parameters relevant to the hypotheses (Bolker et al., 2009). For all models, assumptions were checked according to the graphical validation procedures recommended by Zuur et al. (2009). All statistical analyses were performed in R version 3.5.2 (R Core Team, 2017) using the R‐package lme4 (Bates et al., 2015).
RESULTS
Effects of floral plantings on pest control and pollination services
The provisioning of pest control services in crop fields adjacent to flower strips was enhanced by 16% on average compared to fields without flower strips. On average, pest control services were also increased in crops adjacent to hedgerows, but effects were more variable and overall not statistically significant (Fig. 1; Table 1). Pest control services declined exponentially with distance from the field edge, but the slopes of the distance functions between fields with and without adjacent floral plantings did not differ (Fig. 2a; Table 1).
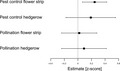
Figure 1.

Forest plot showing effects of flower strips and hedgerows on pollination and pest control service provisioning in adjacent crops compared to control crops without adjacent floral plantings. Squares illustrate predicted mean effects (z‐score estimates), bars show 95% confidence intervals (CIs). On average, pest control services were enhanced by 16% (z‐score: 0.25) in fields with adjacent flower strip compared to control fields.
Figure 2.
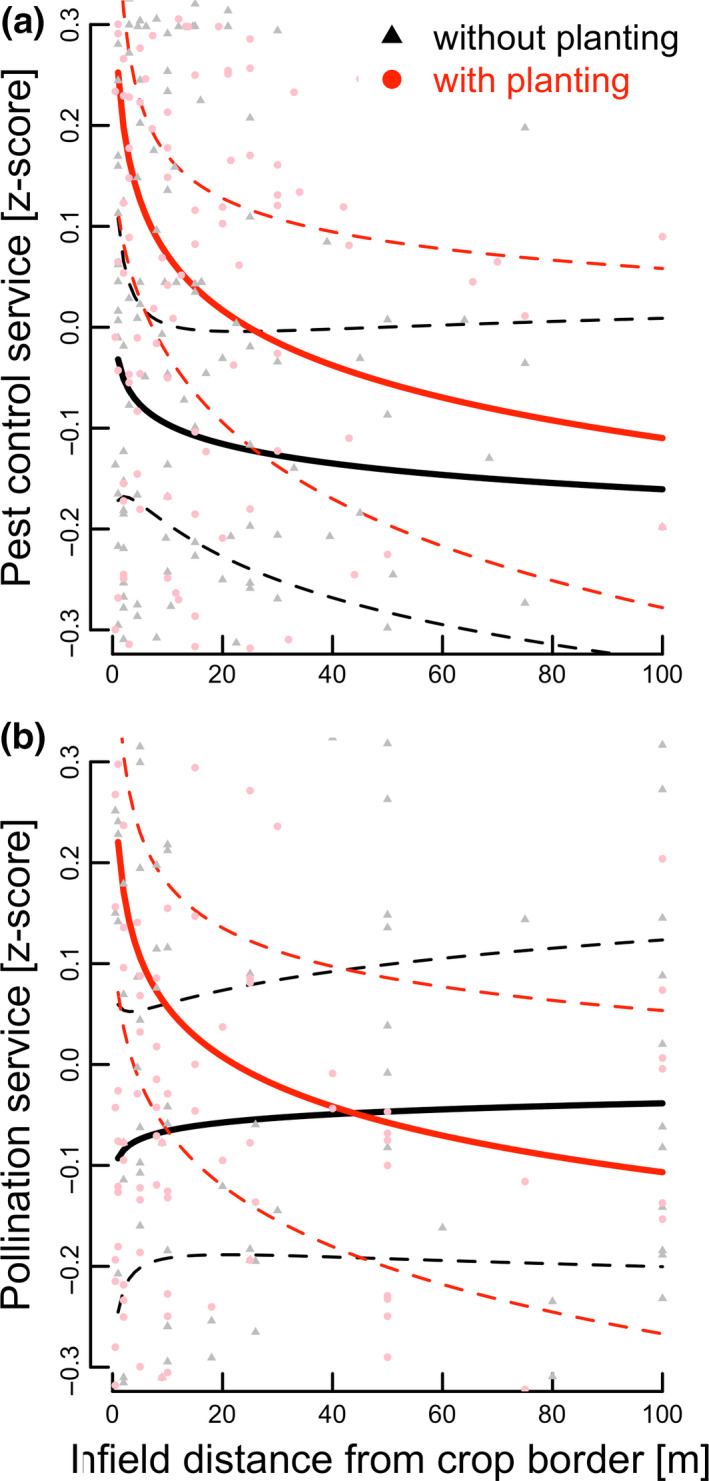
Predicted relationships between (a) mean natural pest control service and (b) mean crop pollination service (z‐scores (solid lines) ± 95% CI (dashed lines)) and in‐field distance to field border for field with (red lines; dots) or without adjacent floral planting (black lines, triangles).
Crop pollination effects were more variable across studies and overall not significantly different between crops with or without adjacent floral planting across all studies and within‐field distances (Fig 1; Table 1). However, effects of distance to field edge differed for fields with floral plantings compared with control fields (significant interaction between presence of planting and distance from field border; Table 1). Pollination services were increased near floral plantings and decreased exponentially with increasing distance from plantings, while no such effect of distance to field edge was detected for control fields (Fig. 2b). The fitted distance curves for fields with or without floral plantings intersected at 43 m (Fig. 2b).
The role of flowering plant diversity and time since establishment of flower strips
Crop pollination services, but not pest control services, tended to increase with flowering plant species richness of the adjacent flower strip (52% predicted increase in crop pollination from 1 to 25 plant species in adjacent flower strip; Fig. 3a; Table 1). Crop pollination services also tended to increase with time since establishment of the adjacent flower strip, but showed a positive saturating relationship (Fig. 3b; Table 1). Pollination services increased by 27% in 2 year old strips compared with the youngest plantings (roughly 3 months old), while the additional predicted increase from 2 to 4 years or older strips was approximately 5% on average (Fig. 3b; only few strips were older than four years, see Fig. 3b and explanations in figure caption). Pest control services in crops adjacent to flower strips did not increase with flower strip age (Table 1).
Figure 3.
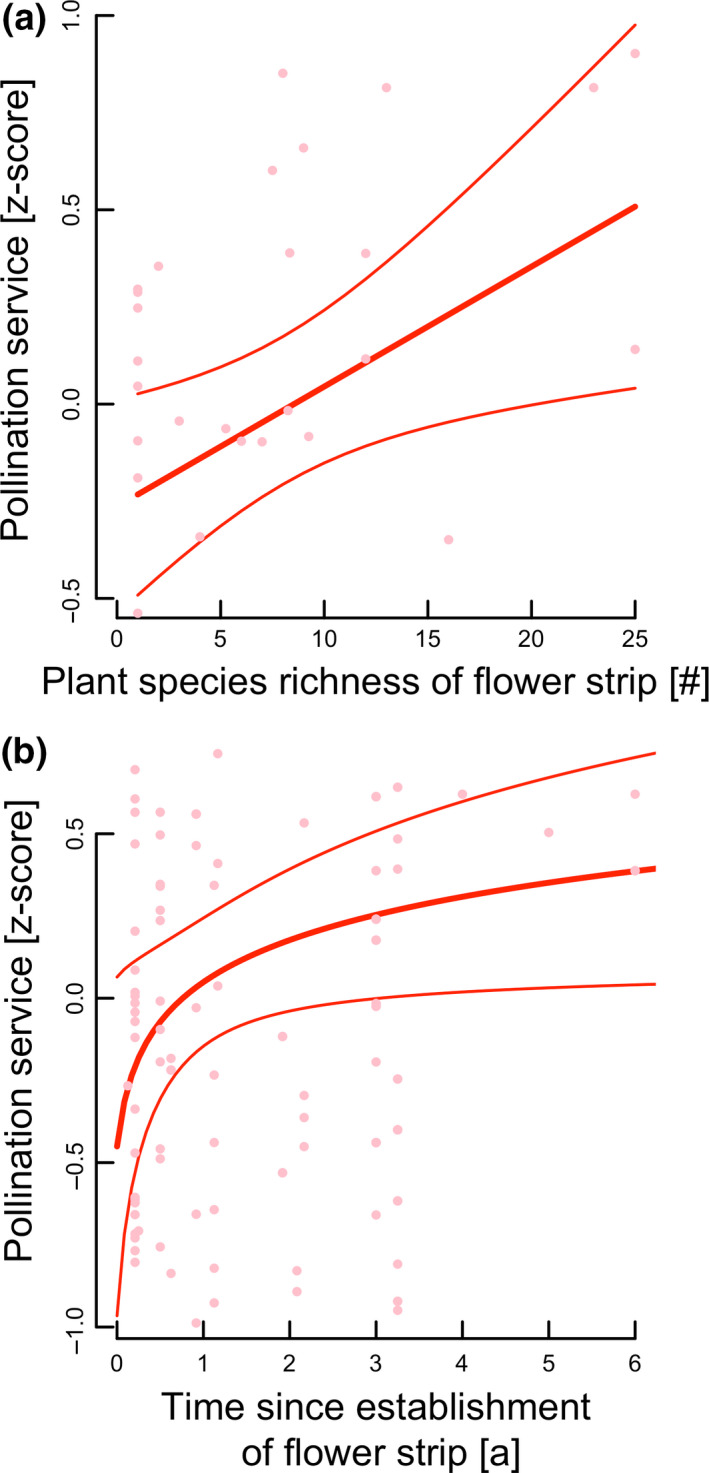
Predicted relationships between mean crop pollination service (z‐scores (fat solid lines) ± 95% CI (fine solid lines)) and (a) flowering plant species richness and (b) time since establishment of adjacent flower strips. Predicted relationship and results of an analysis without the points representing flower strips older than four years were qualitatively identical.
Effects of landscape simplification
The model testing for a linear relationship between service provision and landscape simplification and its interaction with local flower presence fitted the data better than a model testing for hump‐shaped relationships (Table S3). Pollination, but not pest control services, decreased linearly with landscape simplification (12% decrease from 50 to 100% crops in the surrounding landscape), irrespective of the presence of a floral planting (no significant floral planting × landscape simplification interaction; Fig 4; Table 1).
Figure 4.
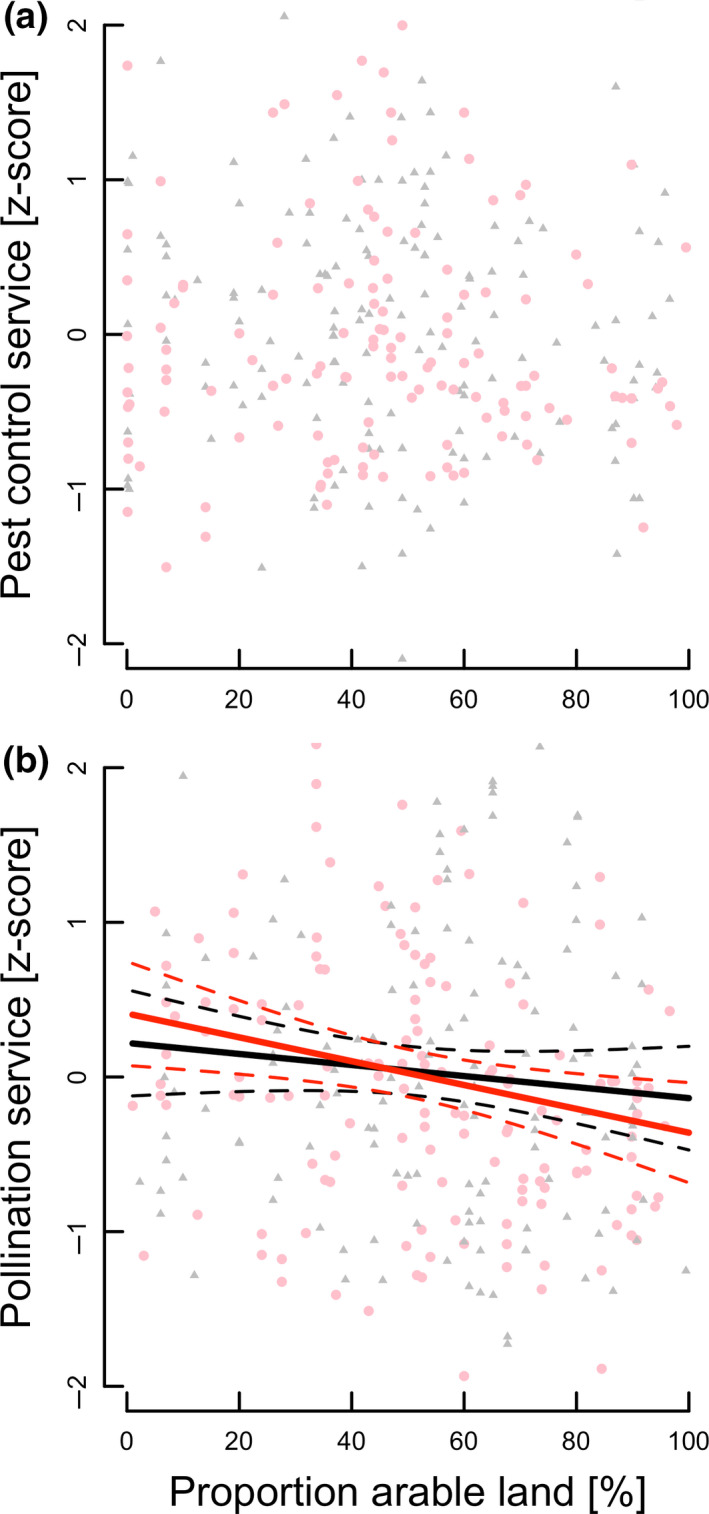
Predicted relationship between mean (a) pest control and (b) crop pollination service (z‐scores (solid lines) ± 95% CI (dashed lines)) and landscape simplification (percentage of arable crops in the landscape) in fields with adjacent floral planting (red line; red circles) or without planting (black line; black triangles). Pollination services, but not pest control services, declined with landscape simplification; the slight differences in slopes for pollination‐landscape simplification relationships of fields with or without adjacent plantings were statistically not significant.
Effects of flower strips on crop yield
Overall, no significant effect of flower strips on yield in adjacent crops was detected (subset of 11 studies for which crop yield data was available; Fig. 5; Table S4). Furthermore, no effects of within‐field distance, plant species richness, time since establishment or landscape simplification, or their interactions with flower strip presence on yield, were detected (Table S4).
Figure 5.
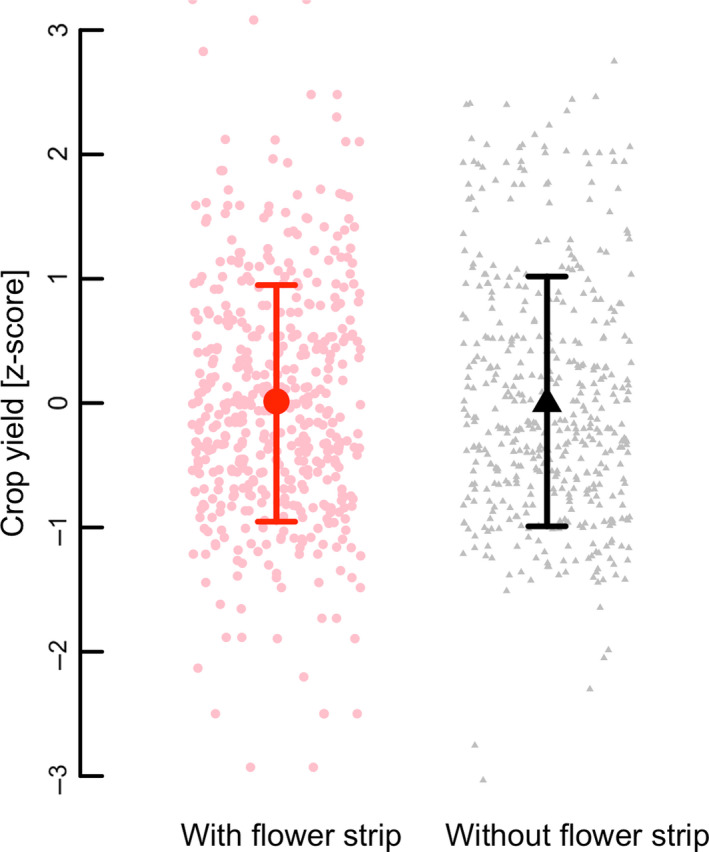
Mean predicted crop yield (z‐scores; ±95% CI) of fields with adjacent flower strips (red circles) and control fields without adjacent flower strip (black triangles). The data set includes a subset of 11 studies.
DISCUSSION
Our quantitative synthesis demonstrates a generally positive effect of flower strips on pest control services but these effects did not consistently translate into higher yields. Although in most cases beneficial effects of plantings were also found for crop pollination services, effects on crop pollination and final crop yield were variable and overall not significant. The effect of wildflower strips on pollination services increased with age and species‐richness suggesting that the quality of such plantings plays a pivotal role in effective service provision. Moreover, crop pollination declined with increasing distance to floral plantings (hedgerows and flower strips). These results indicate that floral plantings have great potential to benefit ecosystem service provision, but to do so will need to be carefully tailored for functioning at specific spatial scales. Flower diversity and strip age are important drivers through which this can be achieved and they should be considered integrally before floral plantings can make a significant contribution to the ecological intensification of agricultural production.
We found positive effects of flower strips on ecosystem service provisioning in support of the ‘exporter’ hypothesis (sensu Morandin and Kremen, 2013; Kremen et al., 2019), although effects were generally variable and only significant for flower strips enhancing pest control services by 16% on average. This is an important finding as it provides general empirical evidence that flower strips can reduce crop pest pressures across various crops, landscape contexts and geographical regions. One explanation for the more consistent positive effects on pest control services of flower strips compared to hedgerows may be that in many of the studied flower strips the selection of flowering plants was tailored to the requirements of the target natural enemy taxa (Tschumi et al., 2015, 2016) while this was generally less the case in the studied hedgerow plantings.
Wildflower plantings have been heralded as one of the most effective measures to enhance the provision of ecosystem service to crops (Kleijn et al., 2019) with many studies showing positive effects on service provisioning (e.g. Blaauw and Isaacs, 2014; Tschumi et al., 2015, 2016; included in this quantitative synthesis). Our synthesis shows, however, that although general significant effects of flower strips were found for pest control service provisioning, effects of plantings on crop pollination services were highly variable. This highlights the need to better understand these conditions and drivers of success or failure of floral plantings to promote pollination services. Our synthesis identifies several drivers explaining this variability in delivered services and therefore offers pathways to enhance the effectiveness of these measures in the future.
First, the success of flower strips to promote crop pollination services increased with their age. The strongest increase was detected up to roughly three years since the planting date. Pollination services also appeared to continue to increase with establishment time beyond three years. This trend needs to be interpreted with caution as only three studies assessed four years old or older flower strips highlighting that scarcity of long‐term data on the effects of floral plantings on services provisioning and yield, which represents an important knowledge gap. We found no evidence that this increase in effectiveness with age is driven by floral abundance, as flower abundance did not increase with flower strip age. Case studies from Central and Northwestern Europe suggest that abundance and species richness of flowering herbaceous plants in sown flower strips on the highly fertilised soils in these agricultural regions often even decline with age after the second or third year as grasses take over (Steffan‐Dewenter and Tscharntke, 2001; Ganser et al., 2019). The observed positive effect of flower strip age is, however, in agreement with the expectation that the build‐up and restoration of local crop pollinator populations need time (Blaauw and Isaacs, 2014; Buhk et al., 2018; Kremen et al., 2018). It may also be explained by greater provision of nesting and overwintering opportunities in older floral plantings (Kremen et al., 2019) which are likely scarce in short‐lived annual flower strips that could even be ecological traps for overwintering arthropods (Ganser et al., 2019). In fact, Kremen and M’Gonigle (2015) found higher incidence of above‐ground cavity nesting bees compared to ground‐nesting bees with hedgerow maturation; Ganser et al. (2019) reported increased overwintering of arthropod predators and pollinators of perennial compared to annual flower strips.
Second, our findings reveal that higher species richness of flowering plants tends to enhance pollination service delivery in adjacent crops. This is an important finding as it indicates that restoring plant diversity can not only promote rare pollinator species and pollinator diversity (cf. Scheper et al., 2013; Kremen and M’Gonigle, 2015; Sutter et al., 2017; Kremen et al., 2018), but also crop pollination services. Flowering plant diversity likely promotes complementary floral resources for numerous pollinator taxa with different resource needs and continuity of floral resource availability throughout the season (Schellhorn et al., 2015; M’Gonigle et al., 2017). The identification of species or traits contributing particularly strongly to such effects is a promising area of research (Lundin et al., 2019). Moreover, appropriate management, such as reducing the frequency of hedgerow cutting, is important to ensuring high availability and diversity of floral resources (Staley et al., 2012). Our synthesis reveals that floral plantings enhance pollination services, but only in the part of adjacent crops near to plantings, declining exponentially with distance to plantings (Fig. 2). The exponential decline function predicts pollination service provisioning of less than 50% at 10 m and slightly more than 20% at 20 m compared to the level of service provisioning directly adjacent to plantings, partially explaining the overall non‐significant benefits when considering all measured distances across the entire field (Fig. 2). This may also explain part of the high variability observed across studies and reconcile some of the contrasting findings with respect to pollination service provisioning in studies measuring services relatively near plantings (e.g. up to 15 m; Blaauw and Isaacs (2014), or up to larger distances, e.g. up to 200 m; Morandin and Kremen (2013); Sardiñas et al, (2016)). We found no indication that the degree of the dependency of a crop on insect pollination significantly contributed the observed variability in effects of plantings on crop pollination services or yield (Table S5).
Consistent with previous studies (e.g. Dainese et al., 2019), landscape simplification was associated with decreased pollination services, irrespective of the presence of floral plantings. In contrast, no such effects were detected for pest control services, in agreement with recent studies (Karp et al., 2018; Dainese et al., 2019; but see Veres et al., 2013; Rusch et al., 2016; Martin et al., 2019). The effect of adding a flower strip or hedgerow was, however, independent of landscape context. Although individual case studies (Jonsson et al., 2015; Grab et al., 2018; included in this synthesis) found support for the intermediate landscape hypothesis, enhanced ecosystem services associated with floral plantings were not generally limited to moderately complex landscape contexts, which should encourage farmers to adopt these measures irrespective of the type of landscape in which they are farming.
Crop yield is affected by a complex interplay of a multitude of agricultural management practices such as fertilisation, level of pesticide use, pest pressures, soil cultivation and other factors such as local soil and climatic conditions (e.g. Bartomeus et al., 2015; Gagic et al., 2017), which can potentially mask benefits from improved natural pest regulation or pollination services (Sutter et al., 2018). Positive effects of floral plantings have been shown by some case studies included in this synthesis (e.g. Tschumi et al., 2016; see also Pywell et al., 2015), although sometimes only several years after the establishment of plantings (Blaauw and Isaacs, 2014; Morandin et al., 2016; Venturini et al., 2017b), but we did not detect consistent effects on crop yield associated with adjacent floral plantings. The identified drivers of the effectiveness of floral plantings to enhance crop pollination services, such as age and flowering plant diversity, could provide promising pathways towards optimising plantings as measures contributing to ecological intensification. Future optimisations should also consider the potential for synergistic interactions of enhanced pollination and pest control services by ‘multi‐service’ designs of plantings (Sutter and Albrecht, 2016; Morandin et al., 2016), temporal dynamics (Blaauw and Isaacs, 2014; M’Gonigle et al., 2015), optimised ratios of floral planting (contributing to ecosystem service supply) to crop area (affecting service demand; Kremen et al., 2019; Williams et al., 2019), and the distance‐dependency of services quantified by this synthesis. However, floral plantings are also established for other goals than yield increase. From an environmental and health perspective, maintaining crop yields through a replacement of insecticides by enhanced natural pest control services, should be considered as a great achievement (e.g. Tschumi et al., 2015). Moreover, floral plantings, of sufficient ecological quality, for example in terms of native plant species diversity, contribute also to further ecosystem services, especially biodiversity conservation (e.g. Haaland et al., 2011; Scheper et al., 2013); but farmers are often reluctant to adopt such measures due to concerns of negative effects on crop yield, for example due to spillover of pests. Our findings of similar crop yield in fields with and without plantings can dispel such concerns.
Conclusions and implications
Our synthesis demonstrates enhanced natural pest control services to crops adjacent flower strips plantings, across a broad suite of regions, cropping systems and types of flower strips studied. However, it also reveals inconsistent and highly variable effects of flower strips and hedgerows on crop pollination services and yield. This highlights a strong need to identify the key factors driving this variability and the effectiveness of different types of floral plantings in contributing to ecosystem service delivery. Informed by such improved understanding, the design, implementation and management of floral plantings can increase their effectiveness as measures for ecological intensification. This synthesis identifies several promising pathways towards more effective floral plantings for the provision of ecosystem services and ecological intensification: the modelled exponential distance‐decay function of pollination service provisioning by floral plantings into crop field helps to predict service provision in crop fields; together with the lack of a strong planting area effect, our findings suggest that a dense spatial network of relatively small plantings will be more effective than a few large ones to optimise pollination service provisioning. Moreover, it identifies important drivers of the effectiveness of floral plantings for delivery of crop pollination services: flowering plant diversity and age. Based on these findings we strongly encourage the establishment, adequate management and restoration of existing perennial floral plantings that ensure the availability of high floral diversity across several years as promising pathways towards optimised measures for ecological intensification.
Authors’ contributions
MA and LS designed the study. MA, DK, MT, BRB, RB, AJC, MD, FD, MHE, DG, ADG, DG, HG, HH, FH, RI, KJ, PJ, MJ, EK, CK, DAL, GML, LM, MMK, LM, SCP, SGP, MR, HS, AS, CT, TT, EV, EV, IMGV, AW, DBW, FW, KW, NMW, MW, SW and LS contributed data. MA compiled the dataset. LS and MA analysed the data. MA, LS, DK, MG, SGP and MR interpreted results. MA wrote the paper and all authors contributed to revision
Supporting information
Fig S1
Table S1
Table S2
Table S3
Table S4
Table S5
Acknowledgements
We thank all farmers, field and technical assistants, researchers and funders who contributed to the studies made available for this synthesis. We thank Matthias Suter, Lukas Pfiffner, Henryk Luka, Mario Balzan, Michael Garratt and Emily Martin for statistical advice and inspiring and valuable discussions. We also thank Professor Irwin and two anonymous reviewers for their thoughtful comments and excellent suggestions that have clearly improved an earlier version of the manuscript. Furthermore, we are grateful for funding by the EU COST‐Action FA1307 ‘SUPER‐B’ that enable fruitful discussions with members of the SUPER‐B network during the conceptual and analysis phase of this work. AJC was funded by the Biotechnology and Biological Sciences Research Council (BBSRC) and Syngenta UK as part of a case award PhD (grant no. 1518739). DAL was supported by the Great Lakes Bioenergy Research Center, U.S. Department of Energy, Office of Science, Office of Biological and Environmental Research (Award DE‐SC0018409), by the National Science Foundation Long‐term Ecological Research Program (DEB 1832042) at the Kellogg Biological Station, and by Michigan State University AgBioResearch. RI and BB were funded by the USDA Sustainable Agriculture Research and Education program and by AgBioResearch. EV acknowledges funding from Estonian Research Council Institutional Research Funding project IUT36‐2 and the QuESSA project funded by the European Union (FB7, grant agreement no. 311879. EV and FD were funded by The United States Department of Agriculture – National Institute of Food and Agriculture Specialty Crops Research Initiative Grant 2011‐51181‐30673, and by the University of Maine School of Biology and Ecology. MT was funded by the Hauser and Sur‐La‐Croix foundations. SCP was supported through the QuESSA project funded by the European Union (FB7, grant agreement no. 311879). SGP was supported through the Insect Pollinators Initiative UK Crop pollination project funded by BBSRC, Defra, NERC, the Scottish Government and the Wellcome Trust (BB/1000348/1), and SMOOPS project funded by BBSRC, Worldwide Fruit Limited, Avalon and Syngenta (BB/P003664/1). MJ acknowledges funding from the Tertiary Education Commission through the Bio‐Protection Research Centre at Lincoln University, New Zealand and Centre for Biological Control at Swedish University of Agricultural Sciences. MMK and DBW acknowledge funding from Waitrose & Partners, Fruition PO and the University of Worcester.
[Correction added on 1 June 2021 after first online publication: Duncan B. Westbury has been added as a co‐author, and the Acknowledgments have been updated to reflect the associated funding information, in this version.]
Data availability statement
Data available from the Dryad Digital Repository: https://doi.org/10.5061/dryad.ns1rn8pq2.
REFERENCES
- Albrecht, M. , Duelli, P. , Müller, C. , Kleijn, D. & Schmid, B. (2007). The Swiss agri‐environment scheme enhances pollinator diversity and plant reproductive success in nearby intensively managed farmland. J. Appl. Ecol., 44, 813–822. [Google Scholar]
- Buhk, C. , Oppermann, R. , Schanowski, A. , Bleil, R. , Lüdemann, J. & Maus, C. (2018). Flower strip networks offer promising long term effects on pollinator species richness in intensively cultivated agricultural areas. BMC Ecol., 18, 55. [DOI] [PMC free article] [PubMed] [Google Scholar]
- Bartomeus, I. , Gagic, V. & Bommarco, R. (2015). Pollinators, pests and soil properties interactively shape oilseed rape yield. Basic Appl. Ecol., 16, 737–745. [Google Scholar]
- Bátary, P. , Baldi, A. , Kleijn, D. & Tscharntke, T. (2011). Landscape‐moderated biodiversity effects of agri‐environmental management: a meta‐analysis. Proc. Royal Soc. B, 278, 1894–1902. [DOI] [PMC free article] [PubMed] [Google Scholar]
- Bates, D. , Maechler, M. , Bolker, B. , Walker, S. , Christensen, R.H.B. , Singmann, H. et al (2015). Package ‘lme4’. Convergence, 12 . Available at: https://cran.r‐project.org/web/packages/lme4/lme4.pdf. Last accessed 20 January 2020.
- Blaauw, B.R. & Isaacs, R. (2014). Floral plantings increase wild bee abundance and the pollination services provided to a pollination‐dependent crop. J. Appl. Ecol., 51, 890–898. [Google Scholar]
- Blitzer, E.J. , Dormann, C.F. , Holzschuh, A. , Klein, A.M. , Rand, T.A. & Tscharntke, T. (2012). Spillover of functionally important organisms between managed and natural habitats. Agric. Ecosyst. Environ., 146, 34–43. [Google Scholar]
- Bolker, B.M. , Brooks, M.E. , Clark, C.J. , Geange, S.W. , Poulsen, J.R. , Stevens, M.H.H. et al (2009). Generalized linear mixed models: a practical guide for ecology and evolution. Trends Ecol. Evol., 24, 127–135. [DOI] [PubMed] [Google Scholar]
- Campbell, A.J. , Biesmeijer, J.C. , Varma, V. & Wäckers, F.L. (2012). Realising multiple ecosystem services based on the response of three beneficial insect groups to floral traits and trait diversity. Basic Appl. Ecol., 13, 363–370. [Google Scholar]
- Dainese, M. , Montecchiari, S. , Sitzia, T. , Sigura, M. & Marini, L. (2017). High cover of hedgerows in the landscape supports multiple ecosystem services in Mediterranean cereal fields. J. Appl. Ecol., 54, 380–388. [Google Scholar]
- Dainese, M. , Martin, E.A. , Aizen, M.A. , Albrecht, M. , Bartomeus, I. , Bommarco, R. et al (2019). A global synthesis reveals biodiversity‐mediated benefits for crop production. Sci. Adv., 5, eaax0121. [DOI] [PMC free article] [PubMed] [Google Scholar]
- Bommarco, R. , Kleijn, D. & Potts, S. (2013). Ecological intensification: harnessing ecosystem services for food security. Trends Ecol. Evol., 28, 230–238. [DOI] [PubMed] [Google Scholar]
- Foley, J. , DeFries, R. , Asner, G.P. , Barford, C. , Bonan, G. , Carpenter, S.R. et al (2005). Global consequences of land use. Science, 309, 570–574. [DOI] [PubMed] [Google Scholar]
- Gagic, V. , Kleijn, D. , Báldi, A. , Boros, G. , Jørgensen, H.B. , Elek, Z. , et al (2017). Combined effects of agrochemicals and ecosystem services on crop yield across Europe. Ecol. Lett., 20, 1427–1436. [DOI] [PubMed] [Google Scholar]
- Ganser, D. , Mayr, B. , Albrecht, M. & Knop, E. (2018). Wildflower strips enhance pollination in adjacent strawberry crops at the small scale. Ecol. Evol., 8, 11775–11784. [DOI] [PMC free article] [PubMed] [Google Scholar]
- Ganser, D. , Knop, E. & Albrecht, M. (2019). Sown wildflower strips as overwintering habitat for arthropods: effective measure or ecological trap? Agric. Ecosyst. Environ., 275, 123–131. [Google Scholar]
- Garbach, K. & Long, R.F. (2017). Determinants of field edge habitat restoration on farms in California's Sacramento Valley. J. Environ. Manage., 189, 134–141. [DOI] [PubMed] [Google Scholar]
- Gardiner, M.M. , Landis, D.A. , Gratton, C. , DiFonzo, C.D. , O’Neal, M. , Chacon, J.M. et al (2009). Landscape diversity enhances biological control of an introduced crop pest in the north‐central USA. Ecol. Appl., 19, 143–154. [DOI] [PubMed] [Google Scholar]
- Garibaldi, L.A. , Steffan‐Dewenter, I. , Kremen, C. , Morales, J.M. , Bommarco, R. , Cunningham, S.A. et al (2011). Stability of pollination services decreases with isolation from natural areas despite honey bee visits. Ecol. Lett., 14, 1062–1072. [DOI] [PubMed] [Google Scholar]
- Garibaldi, L.A. , Steffan‐Dewenter, I. , Winfree, R. , Aizen, M.A. , Bommarco, R. , Cunningham, S.A. et al (2013). Wild pollinators enhance fruit set of crops regardless of honey bee abundance. Science, 339, 1608–1611. [DOI] [PubMed] [Google Scholar]
- Godfray, H.C.J. , Beddington, J.R. , Crute, I.R. , Haddad, L. , Lawrence, D. , Muir, J.F. et al (2010). Food security: the challenge of feeding 9 billion people. Science, 327, 812–818. [DOI] [PubMed] [Google Scholar]
- Grab, H. , Poveda, K. , Danforth, B. & Loeb, G. (2018). Landscape context shifts the balance of costs and benefits from wildflower borders on multiple ecosystem services. Proc. Royal Soc. B, 285, 20181102. [DOI] [PMC free article] [PubMed] [Google Scholar]
- Haaland, C. , Naisbit, R.E. & Bersier, L.F. (2011). Sown wildflower strips for insect conservation: a review. Insect Conserv. Divers., 4, 60–80. [Google Scholar]
- Haan, N. , Zhang, Y. & Landis, D.A. (2020). Predicting landscape configuration effects on agricultural pest suppression. Trends Ecol. Evol., 35, 175–186. 10.1016/j.tree.2019.10.003. [DOI] [PubMed] [Google Scholar]
- Hoffmann, U.S. , Jauker, F. , Diehl, E. , Mader, V. , Fiedler, D. , Wolters, V. & et al (2020). The suitability of sown wildflower strips as hunting grounds for spider‐hunting wasps of the genus Trypoxylon depends on landscape context. J. Insect Cons., 24, 125–131. [Google Scholar]
- Holland, J.M. , Bianchi, F. , Entling, M.H. , Moonen, A.C. , Smith, B.M. & Jeanneret, P. (2016). Structure, function and management of semi‐natural habitats for conservation biological control: a review of European studies. Pest Manage. Sci., 72, 1638–1651. [DOI] [PubMed] [Google Scholar]
- IPBES (2016). The assessment report of the Intergovernmental Science‐Policy Platform on Biodiversity and Ecosystem Services on pollinators, pollination and food production. (eds. Potts, S.G. , Imperatriz‐Fonseca, V.L. & Ngo, H.T. ). Secretariat of the Intergovernmental Science‐Policy Platform on Biodiversity and Ecosystem Services, Bonn, Germany, p. 827. [Google Scholar]
- IPBES (2018). The IPBES regional assessment report on biodiversity and ecosystem services for Europe and Central Asia. (eds Rounsevell, M. , Fischer, M. , Torre‐Marin Rando, A. and Mader, A. ). Secretariat of the Intergovernmental Science‐Policy Platform on Biodiversity and Ecosystem Services, Bonn, Germany. 892 pp. [Google Scholar]
- Jonsson, M. , Straub, C.S. , Didham, R.K. , Buckley, H.L. , Case, B.S. , Hale, R.J. et al (2015). Experimental evidence that the effectiveness of conservation biological control depends on landscape complexity. J. Appl. Ecol., 52, 1274–1282. [Google Scholar]
- Karp, D.S. , Chaplin‐Kramer, R. , Meehan, T.D. , Martin, E.A. , DeClerck, F. , Grab, H. et al (2018). Crop pests and predators exhibit inconsistent responses to surrounding landscape composition. Proc. Natl. Acad. Sci. U.S.A., 115, 7863–7870. [DOI] [PMC free article] [PubMed] [Google Scholar]
- Kleijn, D. , Rundlöf, M. , Scheper, J. , Smith, H.G. & Tscharntke, T. (2011). Does conservation on farmland contribute to halting the biodiversity decline? Trends Ecol. Evol., 26, 474–481. [DOI] [PubMed] [Google Scholar]
- Kleijn, D. , Bommarco, R. , Fijen, T.P. , Garibaldi, L.A. , Potts, S.G. & van der Putten, W.H. (2019). Ecological intensification: bridging the gap between science and practice. Trends Ecol. Evol., 34, 154–166. [DOI] [PubMed] [Google Scholar]
- Kovács‐Hostyánszki, A. , Espíndola, A. , Vanbergen, A.J. , Settele, J. , Kremen, C. & Dicks, L.V. (2017). Ecological intensification to mitigate impacts of conventional intensive land use on pollinators and pollination. Ecol. Lett., 20, 673–689. [DOI] [PMC free article] [PubMed] [Google Scholar]
- Kremen, C. & M'Gonigle, L.K. (2015). Small‐scale restoration in intensive agricultural landscapes supports more specialized and less mobile pollinator species. J. Appl. Ecol., 52, 602–610. [Google Scholar]
- Kremen, C. , M’Gonigle, L.K. & Ponisio, L.C. (2018). Pollinator community assembly tracks changes in floral resources as restored hedgerows mature in agricultural landscapes. Front. Ecol. Evol., 6, 1–10. [Google Scholar]
- Kremen, C. , Albrecht, M. & Ponisio, L. (2019). Restoring pollinator communities and pollination services in hedgerows in intensively managed agricultural landscapes. In The ecology of hedgerows and field margins. (ed Dover, J.W. ). Routledge, New York, USA, pp. 163–185. [Google Scholar]
- Lander, T.A. , Bebber, D.P. , Choy, C.T.L. , Harris, S.A. & Boshier, D.H. (2011). The Circe principle explains how resource‐rich land can waylay pollinators in fragmented landscapes. Curr. Biol., 21, 1302–1307. [DOI] [PubMed] [Google Scholar]
- Lundin, O. , Ward, K.L. & Williams, N.M. (2019). Identifying native plants for coordinated habitat management of arthropod pollinators, herbivores and natural enemies. J. Appl. Ecol., 56, 665–676. [Google Scholar]
- Martin, E.A. , Dainese, M. , Clough, Y. , Báldi, A. , Bommarco, R. , Gagic, V. et al (2019). The interplay of landscape composition and configuration: new pathways to manage functional biodiversity and agroecosystem services across Europe. Ecol. Lett., 22, 1083–1094. [DOI] [PubMed] [Google Scholar]
- M'Gonigle, L.K. , Ponisio, L. , Cutler, K. & Kremen, C. (2015). Habitat restoration promotes pollinator persistence and colonization in intensively‐managed agriculture. Ecol. Appl., 25, 1557–1565. [DOI] [PubMed] [Google Scholar]
- M’Gonigle, L.K. , Williams, N.M. , Lonsdorf, E. & Kremen, C. (2017). A tool for selecting plants when restoring habitat for pollinators. Conserv. Lett., 10, 105–111. [Google Scholar]
- Morandin, L.A. & Kremen, C. (2013). Hedgerow restoration promotes pollinator populations and exports native bees to adjacent fields. Ecol. Appl., 23, 829–839. [DOI] [PubMed] [Google Scholar]
- Morandin, L.A. , Long, R.F. & Kremen, C. (2016). Pest control and pollination cost–benefit analysis of hedgerow restoration in a simplified agricultural landscape. J. Econ. Entomol., 109, 1–8. [DOI] [PubMed] [Google Scholar]
- Nicholson, C.C. , Ricketts, T.H. , Koh, I. , Smith, H.G. , Lonsdorf, E.V. & Olsson, O. (2019). Flowering resources distract pollinators from crops: model predictions from landscape simulations. J. Appl. Ecol., 56, 618–628. [Google Scholar]
- Phillips, B.W. & Gardiner, M.M. (2015). Use of video surveillance to measure the influences of habitat management and landscape composition on pollinator visitation and pollen deposition in pumpkin (Cucurbita pepo) agroecosystems. PeerJ, 3, e1342. [DOI] [PMC free article] [PubMed] [Google Scholar]
- Pywell, R. , Heard, M. , Woodcock, B. , Hinsley, S. , Ridding, L. , Nowakowski, M. et al (2015). Wildlife‐friendly farming increases crop yield: evidence for ecological intensification. Proc. Roy. Soc. B., 282, 20151740. [DOI] [PMC free article] [PubMed] [Google Scholar]
- R Core Team , (2017). R: a language and environment for statistical computing. R Foundation for Statistical Computing, Vienna, Austria. [Google Scholar]
- Ricketts, T.H. , Regetz, J. , Steffan‐Dewenter, I. , Cunningham, S.A. , Kremen, C. , Bogdanski, A. et al (2008). Landscape effects on crop pollination services: are there general patterns? Ecol. Lett., 11, 499–515. [DOI] [PubMed] [Google Scholar]
- Rosenthal, R. (1979). The ‘file drawer problem’ and tolerance for null results. Psychol. Bull., 86, 638–641. [Google Scholar]
- Rundlöf, M. , Lundin, O. & Bommarco, R. (2018). Annual flower strips support pollinators and potentially enhance red clover seed yield. Ecol. Evol., 8, 7974–7985. [DOI] [PMC free article] [PubMed] [Google Scholar]
- Rusch, A. , Chaplin‐Kramer, R. , Gardiner, M.M. , Hawro, V. , Holland, J. , Landis, D. et al (2016). Agricultural landscape simplification reduces natural pest control: a quantitative synthesis. Agric. Ecosyst. Environ., 221, 198–204. [Google Scholar]
- Sardiñas, H.S. , Tom, K. , Ponisio, L.C. , Rominger, A. & Kremen, C. (2016) Sunflower (Helianthus annuus) pollination in California's Central Valley is limited by native bee nest site location. Ecol. Appl., 26, 438–447. [DOI] [PubMed] [Google Scholar]
- Schellhorn, N.A. , Gagic, V. & Bommarco, R. (2015). Time will tell: resource continuity bolsters ecosystem services. Trends Ecol. Evol., 30, 524–530. [DOI] [PubMed] [Google Scholar]
- Scheper, J. , Holzschuh, A. , Kuussaari, M. , Potts, S. , Rundlöf, M. , Smith, H. et al (2013). Environmental factors driving the effectiveness of European agri‐environmental measures in mitigating pollinator loss – a meta‐analysis. Ecol. Lett., 16, 912–920. [DOI] [PubMed] [Google Scholar]
- Scheper, J. , Bommarco, R. , Holzschuh, A. , Potts, S.G. , Riedinger, V. , Roberts, S.P. et al (2015). Local and landscape‐level floral resources explain effects of wildflower strips on wild bees across four European countries. J. Appl. Ecol., 52, 1165–1175. [Google Scholar]
- Staley, J.T. , Sparks, T.H. , Croxton, P.J. , Baldock, K.C. , Heard, M.S. , Hulmes, S. et al (2012). Long‐term effects of hedgerow management policies on resource provision for wildlife. Biol. Cons., 145, 24–29. [Google Scholar]
- Steffan‐Dewenter, I. & Tscharntke, T. (2001). Succession of bee communities on fallows. Ecography, 24, 83 93. [Google Scholar]
- – Sutter, L. & Albrecht, M. (2016). Synergistic interactions of ecosystem services: florivorous pest control boosts crop yield increase through insect pollination. Proc. Royal Soc. B, 283, 20152529. [DOI] [PMC free article] [PubMed] [Google Scholar]
- Sutter, L. , Jeanneret, P. , Bartual, A.M. , Bocci, G. & Albrecht, M. (2017). Enhancing plant diversity in agricultural landscapes promotes both rare bees and dominant crop‐pollinating bees through complementary increase in key floral resources. J. Appl. Ecol., 54, 1856–1864. [Google Scholar]
- Sutter, L. , Albrecht, M. & Jeanneret, P. (2018). Landscape greening and local creation of wildflower strips and hedgerows promote multiple ecosystem services. J. Appl. Ecol., 55, 612–620. [Google Scholar]
- Thies, C. & Tscharntke, T. (1999). Landscape structure and biological control in agroecosystems. Science, 285, 893–895. [DOI] [PubMed] [Google Scholar]
- Tscharntke, T. , Klein, A.M. , Kruess, A. , Steffan‐Dewenter, I. & Thies, C. (2005). Landscape perspectives on agricultural intensification and biodiversity ‐ ecosystem service management. Ecol. Lett., 8, 857–874. [Google Scholar]
- Tscharntke, T. , Karp, D.S. , Chaplin‐Kramer, R. , Batáry, P. , DeClerck, F. , Gratton, C. et al (2016). When natural habitat fails to enhance biological pest control–Five hypotheses. Biol. Cons., 204, 449–458. [Google Scholar]
- Tschumi, M. , Albrecht, M. , Entling, M. & Jacot, K. (2015). High effectiveness of tailored flower strips in reducing pests and crop plant damage. Proc. Roy. Soc. B., 282, 20151369. [DOI] [PMC free article] [PubMed] [Google Scholar]
- Tschumi, M. , Albrecht, M. , Collatz, J. , Dubsky, V. , Entling, M.H. , Najar‐Rodriguez, A.J. et al (2016). Tailored flower strips promote natural enemy biodiversity and pest control in potato crop. J. Appl. Ecol., 53, 1169–1176. [Google Scholar]
- Veres, A. , Petit, S. , Conord, C. & Lavigne, C. (2013). Does landscape composition affect pest abundance and their control by natural enemies? A review. Agric. Ecosyst. Environ., 166, 110–117. [Google Scholar]
- Venturini, E.M. , Drummond, F.A. , Hoshide, A.K. , Dibble, A.C. & Stack, L.B. (2017a). Pollination reservoirs for wild bee habitat enhancement in cropping systems: a review. Agroecol. Sust. Food, 41, 101–142. [Google Scholar]
- Venturini, E.M. , Drummond, F.A. , Hoshide, A.K. , Dibble, A.C. & Stack, L.B. (2017b). Pollination reservoirs in lowbush blueberry (Ericales: Ericaceae). J. Econ. Entomol., 110, 333–346. [DOI] [PMC free article] [PubMed] [Google Scholar]
- Williams, N.M. , Ward, K.L. , Pope, N. , Isaacs, R. , Wilson, J. , May, E. A. et al (2015). Native wildfloral plantings support wild bee abundance and diversity in agricultural landscapes across the United States. Ecol. Appl., 25, 2119–2131. [DOI] [PubMed] [Google Scholar]
- Williams, N.M. , Isaacs, R. , Lonsdorf, E. , Winfree, R. & Ricketts, T.H. (2019). Building resilience into agricultural pollination using wild pollinators. In: Agricultural resilience – perspectives from ecology and economics. (eds Gardner, S.M. , Ramsden, S.J. , & Hails, R.S. ). Cambridge University Press, Cambridge. pp. 109–134. [Google Scholar]
- Zuur, A. , Ieno, E.N. , Walker, N. , Saveliev, A.A. & Smith, G.M. (2009). Mixed effects models and extensions in ecology with R. Springer Science & Business Media, New York, USA. [Google Scholar]
Associated Data
This section collects any data citations, data availability statements, or supplementary materials included in this article.
Supplementary Materials
Fig S1
Table S1
Table S2
Table S3
Table S4
Table S5
Data Availability Statement
Data available from the Dryad Digital Repository: https://doi.org/10.5061/dryad.ns1rn8pq2.