

Abstract
Prevention of the emergence and spread of foodborne diseases is an important prerequisite for the improvement of public health. Source attribution models link sporadic human cases of a specific illness to food sources and animal reservoirs. With the next generation sequencing technology, it is possible to develop novel source attribution models. We investigated the potential of machine learning to predict the animal reservoir from which a bacterial strain isolated from a human salmonellosis case originated based on whole‐genome sequencing. Machine learning methods recognize patterns in large and complex data sets and use this knowledge to build models. The model learns patterns associated with genetic variations in bacteria isolated from the different animal reservoirs. We selected different machine learning algorithms to predict sources of human salmonellosis cases and trained the model with Danish Salmonella Typhimurium isolates sampled from broilers (n = 34), cattle (n = 2), ducks (n = 11), layers (n = 4), and pigs (n = 159). Using cgMLST as input features, the model yielded an average accuracy of 0.783 (95% CI: 0.77–0.80) in the source prediction for the random forest and 0.933 (95% CI: 0.92–0.94) for the logit boost algorithm. Logit boost algorithm was most accurate (valid accuracy: 92%, CI: 0.8706–0.9579) and predicted the origin of 81% of the domestic sporadic human salmonellosis cases. The most important source was Danish produced pigs (53%) followed by imported pigs (16%), imported broilers (6%), imported ducks (2%), Danish produced layers (2%), Danish produced cattle and imported cattle (<1%) while 18% was not predicted. Machine learning has potential for improving source attribution modeling based on sequence data. Results of such models can inform risk managers to identify and prioritize food safety interventions.
Keywords: Machine learning, source attribution, whole genome sequencing
1. INTRODUCTION
Salmonella Typhimurium including its monophasic variants is the second most prevalent human Salmonella serotype in the European Union (EU) and most EU member states (EFSA, 2018). During the last few years, monophasic variants of Salmonella Typhimurium have also repeatedly been involved in human foodborne outbreaks (Hazards, 2010). Salmonella Typhimurium is a major serotype in pigs but is also commonly found in a number of other food‐animal reservoirs (e.g., poultry and cattle) and environmental samples. This is in contrast to Salmonella serotypes primarily associated with a single reservoir, e.g., Salmonella Dublin that is mainly associated with the bovine reservoir (Uzzau et al., 2000). It was, therefore, decided to focus on source attribution of human salmonellosis infections caused by Salmonella Typhimurium and its monophasic variants.
Being able to prevent the emergence and spread of foodborne diseases is important and improves public health. Source attribution models link sporadic human cases of a specific illness to food sources and animal reservoirs (Pires et al., 2009). The result of a source attribution model is a source account that sums up the number of sporadic human salmonellosis cases attributed to the different animal reservoirs thus providing information to decision‐makers about prevention and control of human salmonellosis cases, eventually improving public health. In Denmark, the Salmonella source account is based on sporadic salmonellosis cases and index cases (the first documented human case of an outbreak) and positive Salmonella samples from animal and food registered as part of the Danish national Salmonella surveillance programs for animals, food, and humans. In Denmark, a Salmonella source account has been published every year for the past two decades in the annual report on zoonoses in Denmark (https://www.food.dtu.dk/Publikationer/Sygdomsfremkaldende-mikroorganismer/Zoonoser-aarlige-rapporter) which has informed decision‐makers regarding prevention strategies.
The Danish source account has up until now been based on a Bayesian modeling approach that accounted for prevalence of the Salmonella types in the different sources (Hald, Vose, Wegener, & Koupeev, 2004). The types have over the years been defined by serotyping, phage typing, MLVA typing, and resistance profiling (de Knegt et al., 2016; Hald et al., 2004) and the source attribution model has been modified and applied in other countries such as Australia (Fearnley et al., 2018; Glass et al., 2015) and New Zealand (Mullner et al., 2009).
From January 2017, sero‐ and multiple locus variable number tandem repeat analysis (MLVA) typing of isolates, collected as part of the Danish national Salmonella surveillance, was replaced by whole genome sequencing. Consequently, new tools for source attribution models based on sequencing data had to be developed as MLVA types cannot be derived from the sequence because it relies on repeats that are very difficult to determine based on the short‐read sequences. A forest of different bioinformatics analysis for analyzing sequences exists. One of these is the core genome multi locus sequence typing (cgMLST) that analyzes all core genes and differentiate strains by their allelic variations. With the Salmonella core genome consisting of 3,002 genes each having several allelic variations, highly discriminatory data are obtained. Machine learning algorithms are well suited for analyzing this type of data sets (Libbrecht & Noble, 2015) and has been mentioned as a potential approach for source attribution models based on sequencing data (Mughini‐Gras, Franz, & Pelt, 2017) in a public health context (Lupolova, Dallman, Holden, & Gally, 2017). Recent studies by Zhang et al. (2019) and Lupolova et al. (2017) agree on the potential of using machine learning and whole genome sequencing data to discriminate between different sources, while the aim of data sets are different than the one presented here. Zhang et al. (2019) found the approach useful when identifying potential sources of foodborne Salmonella Typhimurium outbreaks based on core genome mutations and accessory genes. Lupolova et al. (2017) focused on analyzing host restriction using a combined machine learning and phylogenetic approach. The study was based on data from a large time period (1945–2016) covering almost all continents and included three animal reservoirs.
These recent papers and a newly published guide to machine learning for bacterial host attribution using genome sequence data (Lupolova, Lycett, & Gally, 2019) indicate a growing interest in machine learning approaches to source attribution. We focus on the attribution of domestic sporadic human cases and demonstrate the usefulness of a machine learning analysis of core genomes of Salmonella Typhimurium and its application for source attribution in a public health context. Specifically, we investigate the potential of machine learning to predict the source from which a bacterial strain isolated from a Danish human salmonellosis case originated on the basis of input derived from whole‐genome sequencing data. We hypothesize that cgMLST and allelic variations are potentially useful to distinguish patterns between sources in a source attribution context.
2. METHODS
2.1. Data Description and Collection
The data set included food, animal, and human isolates collected specifically for this study. The human, food, and animal isolates were collected as part of integrated surveillance systems and were thus representative of Salmonella Typhimurium and its monophasic variants in human, domestic, and imported animals and food in 2013 and 2014. A subset of the Salmonella Typhimurium isolated from human, food, and animals was sequenced for this project as described in detail elsewhere (Munck et al., 2020). These isolates were previously used for the Danish Salmonella source account published in the annual reports on zoonoses in Denmark in 2013 and 2014 (see, e.g., Anonymous, 2015). Domestic and sporadic human cases were included and information about travel was obtained.
In total, 65% of the 325 samples of Salmonella Typhimurium and its monophasic variants isolated from domestic and imported food and animals were sequenced as part of the food data set for this study. The human data set consisted of 18% of the 764 samples of Salmonella Typhimurium and its monophasic variants. All isolates were sequenced using an Illumina HiSeq, NextSeq, or MiSeq sequencing machine.
2.2. Phylogeny of the Data Set
The phylogeny of the data set was analyzed to examine its applicability for source attribution. Maximum likelihood phylogenetic trees were constructed from sequence variations in the genome shared between strains included in the analysis using FastTree (Price, Dehal, & Arkin, 2009).
Sequence variations were defined as the single nucleotide polymorphisms (SNPs) within the genome shared between the strains included. Distances between isolates were equivalent to the number of SNPs between them. The data set was assumed applicable when human salmonellosis cases were intermixed with the food and animal sources. SNPs were identified using the Call SNPs and Infer Phylogeny (CSI) phylogeny pipeline (Kaas, Leekitcharoenphon, Aarestrup, & Lund, 2014; Leekitcharoenphon et al., 2012), freely available from the center for genomic epidemiology (www.genomicepidemiology.org). We briefly describe the pipeline here. Trimmed paired‐end reads of each isolate were aligned against the reference genome, Salmonella enterica subsp. enterica serovar Typhimurium str. LT2 (AE006468.2, 4,857,432 base pairs) (McClelland et al., 2001) using Burrows–Wheeler Aligner version 0.7.2 (Li & Durbin, 2009). The SNPs were identified using "mpileup" module in SAMTools version 0.1.18 (Li et al., 2009). SNPs fulfilling the following criteria were selected: (i) a minimum distance of 15 bps between each SNP (pruning), (ii) a minimum of 10% of the average depth, (iii) mapping quality above 30, (iv) the SNP quality was more than 20, and (v) all indels were excluded. The selected SNPs from each genome were concatenated into a single pseudoalignment corresponding to the position of the reference genome. The phylogenetic tree was annotated and visualized using Itol (Letunic & Bork, 2016) and the distances between isolates equivalent to the amount of SNPs between them.
2.3. Bioinformatics Analysis
Core genome multilocus sequence typing (cgMLST) of all sequences included in the data set was used to generate input data to the source attribution model. cgMLST was obtained using the Enterobase scheme (Alikhan, Zhou, Sergeant, & Achtman, 2018) in BioNumerics version 7.6 (Applied Maths, Sint Martens Latem, Belgium). The core genome of Salmonella consists of 3,002 loci with one single locus having several allele variations (Alikhan, Zhou, Sergeant, & Achtman, 2018). cgMLST allele calls were accepted for strains with a core genome coverage higher than 95% (2,852) of 3,002 core genomes alleles and a detection of mixed sequence alleles lower than 50 alleles. BioNumerics sometimes omit calling an allele due to, e.g., stop codens, indels or the like leading to missing values in the cgMLST profile. These values were imputed using missForest function in the missForest package in R version 3.4.3. missForest is applicable to high‐dimensional data sets for which the number of features exceeds the number of observations and can also handle mixed data types (Stekhoven & Buhlmann, 2012).
2.4. Source Attribution Modeling
We applied machine learning algorithms trained on allelic variations in the core genes of the Salmonella Typhimurium isolated from food and animal to predict the source from which a given bacterial strain isolated from a human salmonellosis case originated. We hypothesized that patterns in the allelic variations of the Salmonella core genome were associated with the animal reservoir.
We applied supervised machine learning classification models. The classification was supervised, because it has class labels and the algorithm thus learns from which of the different animal reservoirs (classes) each of the specific isolates from food and animal originates. The model is then used to identify loci that are able to differentiate between the sources based on their allelic variation, obtained through cgMLST analysis of the sequences. The modeling steps are visualized in Fig. 1 and elaborated in the sections below. Analysis was performed in R version 3.5.2 (2018‐12‐20). The R script is included in Supporting Information.
Fig 1.
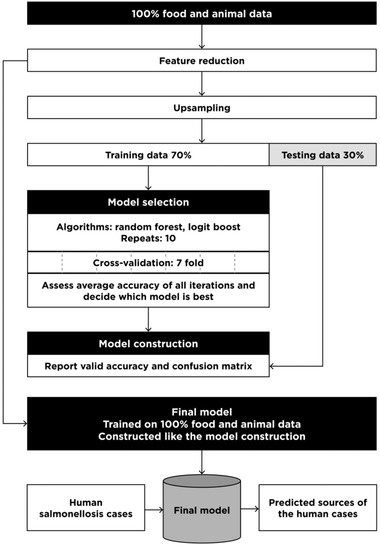
Conceptual model of the machine learning method development.
2.4.1. Feature Reduction
The Salmonella core genome, and hence the number of features (loci) consists of 3,002 loci (Alikhan et al., 2018). The number of features (loci) was reduced in order to decrease computing time and complexity and to avoid correlated features. Zero variance within each variable was detected using the NearZeroVariance function in the caret R package (Kuhn, 2008, 2018). Boruta function in the Boruta R package was used to iteratively reduce less relevant features by statistically comparing them to randomly generated features (Kursa & Rudnicki, 2010). Irrelevant features with no useful information for distinguishing between the different sources were excluded.
2.4.2. Class Imbalance
Salmonella Typhimurium mainly inhabit the pig reservoir in Denmark and to a much lower extent other animal reservoirs such as broilers, layers, and cattle (Anonymous, 2014, 2015). Unequal sample sizes among the sources occurred that could influence the model fitting (Kuhn & Johnson, 2013). A variety of sampling approaches have been developed to mitigate this issue (Kuhn & Johnson, 2013). Upsampling was performed using the upsample function in the caret package in R, which randomly samples (with replacement) cases from the minority classes to be the same size as the majority class (Kuhn & Johnson, 2013). The upsampled data set was applied to the model selection and model construction step (Fig. 1) while the final predictive model was developed from the original (and not upsampled) data set.
2.4.3. Machine Learning
The machine learning model was developed using the food and animal data. Model selection and model construction were based on training sets while the final model was developed from the entire data set.
Model selection
Two machine learning algorithms, logit boost and random forest, were evaluated. These algorithms have been successfully applied in studies analyzing sequence data (Machado, Mendoza, & Corbellini, 2015; Njage et al., 2018; Njage, Leekitcharoenphon, & Hald, 2019; Ogutu, Piepho, & Schulz‐Streeck, 2011). The models were trained on the randomly generated training data set (70%) and performance was estimated using the testing data set (30%) with cross‐validation. Ten iterations were performed. Cross‐validation randomly partitioned the training data set into seven subsets: one held‐out‐subset and six equal sized subsets (also termed “folds”). Average accuracies were reported from the prediction of the held‐out‐subsets by the model build on the six remaining subsets. The held‐out‐subset was returned to the training set and the procedure was repeated until all subsets had been held out and predicted (Kuhn & Johnson, 2013). Ten iterations were performed and the algorithm with the highest average accuracy was selected as the best algorithm to proceed with in the model construction.
Model construction and evaluation
After selection of the best performing model, a new model was constructed following identical modeling procedure described in model selection. Performance of the constructed model was evaluated from its valid accuracy, kappa value, and confusion matrix. Valid accuracy was determined from the models’ ability to predict the labels of the animal and food isolates testing data set. Results of the valid accuracy were also expressed in a confusion matrix that cross‐tabulates observed and predicted cases. The kappa value is calculated from the row and column sums in the confusion matrix and takes and reflects the agreement between the predicted and observed sources (Kuhn & Johnson, 2013).
Final model
The final model was constructed by applying the algorithm from the model construction to the complete and not‐upsampled food and animal data set. The model learned as much as possible about the variability in the data when all available data were used. Thus, this was the best take‐off for a predictive model. Accuracy and confusion matrix obtained from the final model would be misleading and artificially precise and were not reported.
2.5. Prediction of Human Cases
The probability that each human case originated from a specific source was predicted from the final model. For each source, the sum of the probabilities equaled the number of human cases attributed to that source. Human cases for which a source could not be predicted were referred to an unknown source category. Sporadic domestic and outbreak index cases, if available, were predicted. Human cases with travel history were not predicted and per definition attributed to travel.
2.6. Validation
We attempted to validate the machine learning model by comparing the results with those obtained by applying the Bayesian source attribution model (or the Hald model) (Hald et al., 2004) to the same data set. The Hald model relies on a Bayesian framework using Markov Chain Monte Carlo simulations and estimates the number of human salmonellosis cases to each source (j) per Salmonella subtype (i): where λ is the number of human salmonellosis cases, m is amount of the food sources available for consumption, p is the prevalence, and q and a are Salmonella subtype and source‐specific factors estimated by the model, respectively. Salmonella subtype was discriminated by serotype, the MLVA profile and phenotypic resistance profile. The MLVA profile was defined by the number of repetitions observed in loci STTR3, STTR10, and STTR9 and the resistance profile compiling phenotypic resistance towards ampicillin, chloramphenicol, sulphamethoxazole, tetracyclin, trimethoprim, ciprofloxacin, gentamicin, nalidixan, and ceftiofur. The prevalence of each specific Salmonella subtype by source was calculated as the number of positive Salmonella isolates divided by the total number of samples collected from that source in 2013 and 2014 combined. The q‐value was calculated for Salmonella types occurring only in a single source (de Knegt et al., 2016). The remaining q‐factors and all a‐factors were included as noninformative priors. The model attributed sporadic domestic human salmonellosis cases to animal reservoirs whereas the sporadic travel cases were attributed directly to travel. A subset of the human salmonellosis cases with unknown travel history were allocated to travel cases using prior information about the distribution of travelers and nontravelers. Consequently, unknown travel cases allocated to travel cases were attributed to animal sources whereas known travel cases were attributed to travel. Results were reported as the mean percent cases of human salmonellosis cases attributed to the different sources with 95% credible intervals (CrI). The unknown source category reflected any over‐ and underestimation by the model. Data management was performed in Microsoft Excel and the source attribution model was set up and run with WinBugs version 3.2.3. Five independent Markov Chain Monte Carlo simulations were run for 50,000 iterations with random defined starting values between 0 and 100. The burn‐in period was 10,000 iterations with a thinning value of 1. Convergence was monitored using the Gelman–Rubin diagnostics (Toft, Innocent, Gettinby, & Reid, 2007).
3. RESULTS
3.1. Data Sets
The applicability of the data set to develop and apply a new source attribution model was assessed by examining the population structure obtained from the phylogenetic analysis (Fig. 2). The phylogenetic profiles of the human isolates were intermixed with those from potential food and animal sources indicating that the strains from humans were more likely to have originated from one or more of the included sources than from an unobserved source. The phylogeny also confirms that the human salmonellosis cases did not cluster separately from the included animal sources. The data set was thus assessed as appropriate for development of a new source attribution model based on sequencing data.
Fig 2.
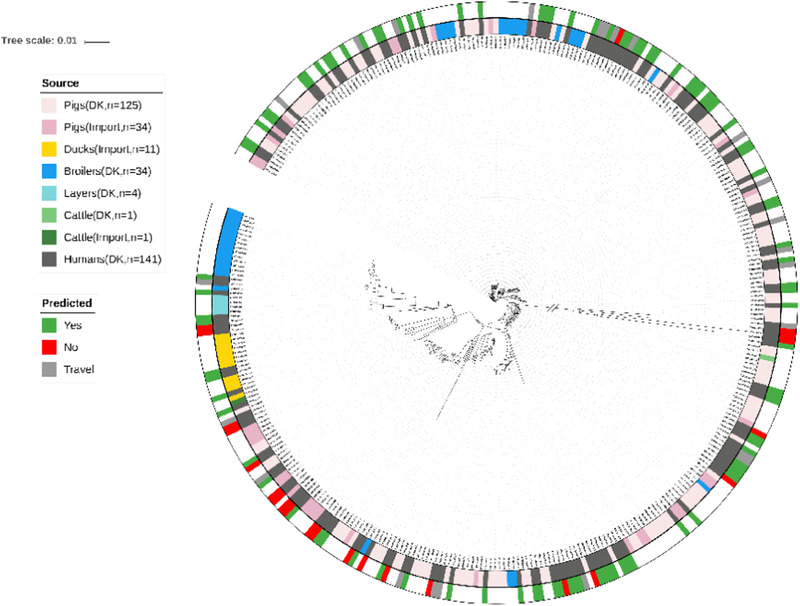
Phylogenetic tree of the Danish data set. Branch length to outgroup ST36 reduced by 30 from 0.71421 to 0.023807. Isolates are annotated by source (inner ring). Whether the source of the human cases was predicted is indicated in the outer ring. Source: light red: domestically produced pigs, Pigs (DK), light pink: imported pigs, Pigs (import), yellow: imported ducks, Ducks (import), blue: domestically produced broilers, Broilers (DK), turquoise: domestically produced eggs, Layers (DK), light green: domestically produced cattle, Cattle (DK), dark green: imported cattle, Cattle (Import), and dark grey: Danish human salmonellosis cases, Humans (DK).
3.2. Predictive Model
We developed a supervised machine learning model from 210 food and animal isolates collected through the Danish national Salmonella surveillance program in 2013 and 2014 (Table I). The model was based on Salmonella core genes and associated allelic variations. In total, 520 (0.08%) allelic values from the food and animal isolates and 15,176 (3.6%) of the allelic values from the human isolates were imputed with a good performance reflected in the proportion of falsely classified entries of 0.002861816 (Stekhoven & Buhlmann, 2012). Of the 3,002 Salmonella core genes, 17 were found important after feature reduction (Subsection 2.4.1) and therefore selected for further modeling. The importance of the 17 core genes across the sources are listed in Table II. The importance is based on the accuracies of the prediction of the sources by each feature (loci). The values are in fact area under the ROC curve (AUC) derived from the source specific sensitivities and specificities values (Table III).
Table I.
Number of Salmonella Typhimurium and its Monophasic Variants Included in the Danish Data Set
| DK Data Set, 2013–2014 Source | 2013 | 2014 | Number of Isolates |
|---|---|---|---|
| Pigs (DK) | 84 | 41 | 125 |
| Pigs (import) | 20 | 14 | 34 |
| Broilers (DK) | 13 | 21 | 34 |
| Ducks (import) | 0 | 11 | 11 |
| Layers (DK) | 3 | 1 | 4 |
| Cattle (DK) | 1 | 0 | 1 |
| Cattle (import) | 0 | 1 | 1 |
| Total animal | 121 | 89 | 210 |
| Human | 29 | 112 | 141 |
Note: DK, Denmark.
Table II.
Seventeen Loci Sorted by Maximum Importance across the Sources
| Broilers | Cattle | Cattle | Ducks | Layers | Pigs | Pigs | |
|---|---|---|---|---|---|---|---|
| Loci | (DK) | (DK) | (Import) | (Import) | (DK) | (DK) | (Import) |
| SALM01217 | 0.9677 | 0.9677 | 0.5161 | 0.5269 | 0.6819 | 1.0000 | 0.9677 |
| SALM02906 | 1.0000 | 1.0000 | 0.5000 | 0.5238 | 0.6802 | 1.0000 | 1.0000 |
| SALM01562 | 1.0000 | 1.0000 | 0.7796 | 0.7204 | 0.7204 | 1.0000 | 1.0000 |
| SALM01921 | 0.7796 | 0.7796 | 0.7796 | 0.7238 | 0.7204 | 1.0000 | 0.7796 |
| SALM01860 | 1.0000 | 0.8647 | 0.7796 | 0.7204 | 0.7204 | 1.0000 | 1.0000 |
| SALM02626 | 0.7796 | 0.7796 | 0.7796 | 0.7238 | 0.7204 | 1.0000 | 0.7796 |
| SALM02334 | 1.0000 | 0.7204 | 0.7204 | 0.7204 | 0.7204 | 1.0000 | 1.0000 |
| SALM00032 | 0.9409 | 0.9409 | 0.9409 | 0.7737 | 0.7881 | 1.0000 | 0.9409 |
| SALM01381 | 0.5000 | 0.9432 | 0.5000 | 0.5238 | 0.6802 | 0.5000 | 0.9432 |
| SALM01938 | 0.8172 | 0.8172 | 0.9367 | 0.8172 | 0.8172 | 0.8172 | 0.8172 |
| SALM00628 | 0.8172 | 0.8172 | 0.8172 | 0.8172 | 0.8172 | 0.8172 | 0.8172 |
| SALM00010 | 0.7204 | 0.7204 | 0.7204 | 0.7204 | 0.7204 | 0.7204 | 0.7204 |
| SALM02003 | 0.7204 | 0.7204 | 0.7204 | 0.7204 | 0.7204 | 0.7204 | 0.7204 |
| SALM01572 | 0.5000 | 0.5000 | 0.5000 | 0.5417 | 0.6977 | 0.5000 | 0.5000 |
| SALM02871 | 0.5269 | 0.5269 | 0.5269 | 0.5875 | 0.6689 | 0.5269 | 0.5269 |
| SALM01670 | 0.5269 | 0.5269 | 0.6019 | 0.5269 | 0.6602 | 0.5269 | 0.5269 |
| SALM00643 | 0.5753 | 0.5753 | 0.5753 | 0.5753 | 0.5753 | 0.5753 | 0.5753 |
Note: The numbers represent importance based on accuracies of the prediction of the sources by each feature (loci). The values are in fact area under the ROC curve (AUC) derived from the source specific sensitivities and specificities values (Table III).
Table III.
Sensitivity, Specificity and Balanced Accuracy for the Prediction of Sources by the Logit Boost Machine Learning Model
| Broilers (DK) | Cattle (DK) | Cattle (import) | Ducks (Import) | Layers (DK) | Pigs (DK) | Pigs (Import) | |
|---|---|---|---|---|---|---|---|
| Sensitivity | 1 | NA | 1 | 0.8919 | 1 | 0.61538 | 0.73333 |
| Specificity | 0.9353 | 1 | 0.9688 | 1 | 1 | 1 | 1 |
| Balanced accuracy | 0.9676 | NA | 0.98 | 0.95 | 1 | 0.81 | 0.87 |
Note: Balanced accuracies defined by Brodersen et al. (2010) as the average accuracy obtained on either class. DK, Denmark.
3.3. Model Selection
We compared the performance of the random forest and logit boost algorithm by the average accuracies obtained from 10 iterations each applying sevenfold cross‐validation. Average accuracy for all 10 iterations was 0.783 (95% CI: 0.77–0.80) for random forest and 0.933 (95% CI: 0.92–0.94) for logit boost. Valid accuracy and confusion matrix (Table IV) were therefore reported from the model constructed using the logit boost algorithm (model construction step of Fig. 1).
Table IV.
Confusion Matrix of the Constructed Model
| % of Total Predicted | Broilers (DK) | Cattle (DK) | Cattle (Import) | Ducks (Import) | Layers (DK) | Pigs (DK) | Pigs (Import) |
|---|---|---|---|---|---|---|---|
| Broilers (DK) | 100 | 0 | 0 | 0 | 0 | 38 | 27 |
| Cattle (DK) | 0 | 0 | 0 | 0 | 0 | 0 | 0 |
| Cattle (import) | 0 | 0 | 100 | 0 | 0 | 0 | 0 |
| Ducks (import) | 0 | 0 | 0 | 100 | 0 | 0 | 0 |
| Layers (DK) | 0 | 0 | 0 | 0 | 100 | 0 | 0 |
| Pigs (DK) | 0 | 0 | 0 | 0 | 0 | 62 | 0 |
| Pigs (import) | 0 | 0 | 0 | 0 | 0 | 0 | 73 |
| % of isolates in testing data | |||||||
| Total predicted | 87.5 | 0 | 100 | 89.2 | 100.0 | 31.7 | 38.5 |
| Not predicted | 12.5 | 100 | 0 | 10.8 | 0.0 | 68.3 | 61.5 |
Note: Rows: Predicted Source. Column: Observed Source. DK, Denmark.
3.4. Logit Boost Model
Valid accuracy obtained from the confusion matrix (Table IV) for the constructed model was 0.92 (95% CI: 0.87–0.96). The kappa value was 0.9033, which is almost perfect according to criteria by (Landis & Koch, 1977) and excellent according to Fleiss et al. (2003). In comparison, valid accuracy was 0.74 (95% CI: 0.68–0.79) and kappa value was 0.6982 for the random forest model. Sensitivity and specificity were 0.9 for most sources except domestically produced and imported pig (0.6 and 0.7 respectively). The balanced accuracies, defined by Brodersen, Soon Ong, Stephan, and Buhmann (2010), as the average accuracy obtained on either class, were greater than 0.8 for all sources except domestically produced cattle for which the sensitivity and balanced accuracy were inestimable (Table III). For comparison, similar values were obtained from the random forest model (Supporting Information Table A1). Domestically produced broilers, imported cattle, imported ducks, and domestically produced layers were correctly predicted while 38% of the domestically produced pigs and 27% of the imported pigs were wrongly predicted as domestically produced broilers. The final predictive model was trained on the entire food and animal data set.
3.5. Source Attribution of Human Salmonellosis Cases
The machine learning model predicted 95 (81%) of the human salmonellosis cases. The main source was Danish produced pigs (53% human cases attributed) followed by imported pigs (16% human cases attributed), imported broilers (6% human cases attributed), imported ducks (2% human cases attributed), Danish produced layers (2% human cases attributed), Danish produced cattle, and imported cattle (<1% human cases attributed) while 18% was not predicted (Fig. 3 and Table V). Predicted human cases are shown in the phylogenetic tree (Fig. 2). The uncertainty of the results is reflected in Fig. 3 illustrating the probability of each human case to originate from one of the seven sources. Travel related cases (23 cases) were not predicted by the machine learning model and attributed to travel. Domestic sporadic human cases that were not predicted (21 cases, 17.8%) by the model were either infected from a source not represented in the model or infected from a variety of one of the sources not captured by the model.
Fig 3.
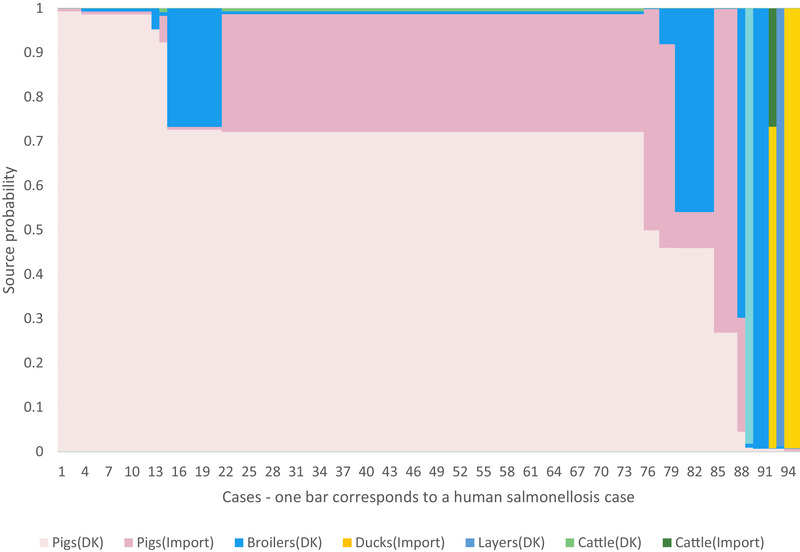
Result of the predictive machine learning model. All the 95 predicted human salmonellosis cases are lined up along the x‐axis and the source specific probabilities for each of the human cases are stacked along the y‐axis. Human cases attributed to unknown sources are not shown.
Table V.
Source Attribution Results Obtained by Applying the Machine Learning Model and the Bayesian Model to the Same Data Set
| Machine Learning Model | Bayesian Model | ||
|---|---|---|---|
| DK data | 17 loci | Serotype, MLVA profile, resistance profile | |
| Performance measure |
Valid accuracy: 0.922 (CI 0.8706–0.9579) Kappa value: 0.9033 |
Fit 0.9 (0.7–1.2) | |
| Prediction |
Human cases attributed, n (% of 118 domestic sporadic human cases) |
Human cases attributed, n mean (% of 141 domestic and travel sporadic human cases) |
95%CI of n mean |
| Number of human cases predicted (%) | 95 (81) | 69 (49) | NA |
| Broilers (DK) | 7.5 (6.4) | 8 (5.7) | 0.2–24.7 |
| Cattle (DK) | 0.4 (0.3) | 4 (2.8) | 0.4–13.2 |
| Cattle (Import) | 0.3 (0.2) | 3 (2.1) | 0.3–7 |
| Ducks (Import) | 2.7 (2.3) | 2 (1.4) | 0.2–5.6 |
| Layers (DK) | 2 (1.7) | 2 (1.4) | 0.2–5.6 |
| Pigs (DK) | 62.9 (53.3) | 31 (22.0) | 13.6–53.5 |
| Pigs (Import) | 19.3 (16.4) | 19 (13.5) | 3.2–42.6 |
| Not predicted | 21 (17.8) | 31 (22.0) | 11–49.2 |
| Travel cases | 23* | 41 (29.1) | 36.7–45.4 |
Note: MLVA profile: Allelic number in loci STTR3, STTR10, and STTR9. Resistance profile: Phenotypic resistance Towards ampicillin, chloramphenicol, sulphamethoxazole, tetracyclin, trimethoprim, ciprofloxacin, gentamicin, nalidixan, and ceftiofur. *No percentage as these were attributed directly to travel and thus not predicted. CI: 95% Confidence Interval, DK, Denmark.
The Bayesian model had a fit value of 0.9 (95% CI: 0.7–1.2) and attributed 69 (49%) human salmonellosis cases. As for the machine learning model the three main sources were domestically produced pigs followed by imported pigs and domestically produced broilers. Human salmonellosis cases attributed to the different sources by the machine learning model were within the 95% CI of the mean number of human cases attributed by the Bayesian model for all sources except for domestically produced pigs, where the machine learning model predicted more cases (Table V). More cases were attributed to travel by the Bayesian model than by the machine learning model.
4. DISCUSSION
We developed a source attribution method based on loci derived from the core genome analysis of 210 food and animal Salmonella Typhimurium isolates. The source attribution model predicted the source of 80% of the 118 human salmonellosis cases.
By analysing the food and animal data set with a logit boost machine learning algorithm, we found allelic variations in 17 different loci to be sufficient for recognition of patterns distinguishing between sources. Application of machine learning for microbial source prediction and host specificity have recently been studied by others (Lupolova et al., 2017; Zhang et al., 2019).
Zhang et al. (2019) identified 10 core genome mutations and 40 accessory genes as relevant for source prediction in Salmonella Typhimurium when applying a random forest machine learning algorithm and verified the approach by predicting sources of foodborne outbreaks with known sources of origin. This study was, compared to our study, based on a much larger data set (n = 1,473) consisting of sequenced isolates from a range of years and different countries. Zhang et al. (2019) describe their study as a large‐scale phylogeny study used to predict major livestock sources over a period of many years. In contrast, our study is restricted to a shorter time frame (two years), but has more details in the “source panel.” In addition, all included animal and food isolates were collected as part of an integrated Salmonella surveillance program ensuring representativeness of the animal reservoirs and a close relatedness in time and space. Combined with the genetic relatedness, our results are considered useful as decision support for authorities to evaluate the need for new or the effect of established interventions in the different food sectors, particularly when it is updated on an annual basis as it is in Denmark.
The Danish National Salmonella surveillance program is designed to thoroughly monitor all major food animals and food of animal origin for Salmonella. Results from centrally coordinated studies furthermore supplement the surveillance programs, particularly regarding data on imported food of animal origin. Elaborate description of the Salmonella surveillance and monitoring programs, from which the reported data originates, are found in the annual report on zoonoses in Denmark (Anonymous, 2014, 2015). Despite the relative low sample size compared to other studies, we believe that this data set is better suited for development of source attribution methods as it contains a sample representative of the domestically produced and imported food available for consumption in Denmark. Our data set is furthermore unique as the isolates were previously used for the Danish Salmonella source account based on the Bayesian approach which facilitated a comparison of results obtained using the different methods and the same data set.
Lupolova et al. (2017) assessed the ability of a support vector machine analysis of protein variants to predict the isolation host of isolates. This included human isolates together with isolates from main animal reservoirs which were split into both training and testing data sets to test the ability of their model to predict the host group. A large proportion of the human isolates were predicted to originate from human. Furthermore, Lupolova et al. (2017) acknowledged machine learning as a valuable asset for source attribution in a public health context.
The vast majority of the Salmonella Typhimurium samples were isolated from the pig reservoir and only few isolates were sampled from the other sources, reflecting low Salmonella Typhimurium prevalence in these sources. The unbalanced data set, however, challenged the modeling process and made upsampling necessary. Upsampling adjusted samples in each source category to equal the number of domestically produced pigs in the data set. The upsampling procedure was applied after feature reduction but before model selection and identical isolates might have been included in both training and testing data sets. Therefore, accuracy may have been overestimated for both of the machine learning algorithms tested in the model selection step. Since the source attribution results obtained from the logit boost model were in line with those obtained from the Bayesian model (Table V), we do not find that this hampered the model selection and decision about which algorithm to construct the final model from.
The model should ideally have been validated by predicting an unseen validating data set. Due to the low sample size (n = 210) we decided to use all available data for model development. Results obtained from our machine learning model were in line with those obtained from the Bayesian model suggesting the machine learning model as a new standard for source attribution when sequences are available.
Our data set was limited to include only Salmonella Typhimurium and the monophasic variants. A similar machine learning model was applied to prepare the Danish Salmonella source account for 2017 data, which includes other serovars besides Salmonella Typhimurium, and is published in the annual report on zoonoses in Denmark 2017 (Anonymous, 2018). Because Salmonella strains from 2017 were not MLVA typed, it was not possible to apply the Bayesian model and compare the two models using this data set. However, the results obtained with the machine learning model were in line with the attribution results obtained by the Bayesian model applying 2016 data (Anonymous, 2018), which gives credibility to both modeling approaches, as the results from one year to next usually do not fluctuate considerably. This also suggests that the machine learning model is applicable for source attribution when Salmonella Typhimurium and other Salmonella serotypes are included in the data set.
In addition to the use of different input (serotype, MLVA, and resistance profile for the Bayesian model and cgMLST loci for the machine learning model), other differences between the Bayesian source attribution model and the machine learning model should be mentioned. First, the Bayesian model uses prior information about the distribution of variables in the model enabling allocation of, e.g., a subset of cases with unknown travel history to travel cases. The machine learning model allocates all cases with unknown travel history as cases with no travel history and seeks to predict the animal reservoir. This explains the differences in travel cases from the two models (Table V). Second, the Bayesian model includes prevalence of the given Salmonella subtypes in the given source whereas the machine learning model is independent of prevalence and assumes that the training data set represents the epidemiology of Salmonella in the sources included. Third, only Salmonella types isolated from both humans and at least one animal source was included in the Bayesian model whereas the machine learning model was trained on all available Salmonella types independent on their presence in humans. This enables the machine learning to timely predict future human salmonellosis cases. Fourth, input data for the Bayesian model was simpler and could be stored and easily shared via Microsoft Excel files for example, while thorough understanding and correct handling of input data for the machine learning model required bioinformatics expertise and an understanding of the bioinformatics discipline.
Our model was developed and validated using Danish data only. We believe that the machine learning model can be applied to predict the animal origin of human salmonellosis cases from other European countries. Two data sets from Germany and United Kingdom were collected for this purpose and described elsewhere (Munck et al., 2020). Furthermore, we speculate that this machine learning model can also be used to investigate Salmonella contamination of fresh produce and a French data set was collected for this purpose (Munck et al., 2020). This has recently been accomplished by attributing Salmonella contamination of Australian macadamia nuts to Australian animal and environmental reservoirs using a Bayesian source attribution model (Munck et al., 2019).
The machine learning model is limited by only being able to predict the origin of a human salmonellosis case if it has “learned” about the strain. Timely update of the model is therefore recommended if applied to an outbreak investigation setting. Campylobacter causes more human cases than Salmonella and we therefore suggest developing a similar source attribution model based on campylobacter sequences.
With sequences as new input data to source attribution models combined with new source attribution methods, collaboration and more importantly communication between laboratory technicians, data managers, epidemiologist, microbiologists, and bioinformaticians has become essential for correct data management, sequence processing, modeling, understanding, and for reporting and communicating results to decision‐makers. This has also recently been acknowledged as a key requirement for an effective switch to whole genome sequencing in public health surveillance (Ford et al., 2018). This study is a result of such a collaboration and a successful example of the continuous collaboration between the mentioned disciplines when working with genomic epidemiology.
Supporting information
Supplementary Material
Table A1: Sensitivity, Specificity and Balanced Accuracy for the Prediction of Sources by the Random Forest Machine Learning Model.
ACKNOWLEDGMENTS
This research was funded by the European Union's Horizon 2020 research and innovation program under grant agreement No. 643476. COMPARE is a Horizon 2020 EU project with the intention to speed up the detection of and response to disease outbreaks among humans and animals worldwide through the use of new genome technology. The aim is to reduce the impact and cost of disease outbreaks.
REFERENCES
- Alikhan, N. F. , Zhou, Z. , Sergeant, M. J. , & Achtman, M. (2018). A genomic overview of the population structure of Salmonella. PLoS Genetics, 14(4), e1007261. [DOI] [PMC free article] [PubMed] [Google Scholar]
- Anonymous . (2014). Annual Report on Zoonoses in Denmark, 2013 . Technical report. Technical University of Denmark, the Danish Veterinary and Food Administration and Statens Serum Institut.
- Anonymous . (2015). Annual Report on Zoonoses in Denmark, 2014 . Technical report. Technical University of Denmark, the Danish Veterinary and Food Administration and Statens Serum Institut.
- Anonymous . (2018). Annual Report on Zoonoses in Denmark 2017 . Technical report. National Food Institute, Technical University of Denmark.
- Brodersen, K. H. , Soon Ong, C. , Stephan, K. E. , & Buhmann, J. M. (2010). The balanced accuracy and its posterior distribution. Proceeding of the 20th International Conference on Pattern Recognition, Istanbul, Turkey.
- de Knegt, L. V. , Pires, S. M. , Löfström, C. , Sørensen, G. , Pedersen, K. , Torpdahl, M. , … Hald, T. (2016). Application of molecular typing results in source attribution models: The case of multiple locus variable number tandem repeat analysis (MLVA) of salmonella isolates obtained from integrated surveillance in Denmark. Risk Analysis, 36(3), 571–588. [DOI] [PubMed] [Google Scholar]
- EFSA . (2018). The European union summary report on trends and sources of zoonoses, zoonotic agents and food‐borne outbreaks in 2017. EFSA Journal, 16(12), 5500. [DOI] [PMC free article] [PubMed] [Google Scholar]
- Fearnley, E. J. , Lal, A. , Bates, J. , Stafford, R. , Kirk, M. D. , & Glass, K. (2018). Salmonella source attribution in a subtropical state of Australia: Capturing environmental reservoirs of infection. Epidemiology and Infection, 146, 1903–1908. [DOI] [PMC free article] [PubMed] [Google Scholar]
- Fleiss, J. L. , Levin B., Paik M. C.. (2003). Statistical Methods for Rates and Proportions, John Wiley Sons, 10.1198/tech.2004.s812 (1706, 800) [DOI] [Google Scholar]
- Ford, L. , Carter, G. P. , Howard, P. , Glass, K. , Wang, Q. , Kirk, M. D. , … Williamson, D. A. (2018). Incorporating whole‐genome sequencing into public health surveillance: lessons from prospective sequencing of Salmonella typhimurium in Australia. Foodborne Pathogens and Disease, 15(3), 161–167. [DOI] [PubMed] [Google Scholar]
- Glass, K. , Fearnley, E. , Hocking, H. , Raupach, J. , Veitch, M. , Ford, L. , & Kirk, M. D. (2015). Bayesian source attribution of salmonellosis in South Australia. Risk Analysis, 36(3), 561–570. [DOI] [PubMed] [Google Scholar]
- Hald, T. , Vose, D. , Wegener, H. C. , & Koupeev, T. (2004). A Bayesian approach to quantify the contribution of animal‐food sources to human salmonellosis. Risk Analysis, 24(1), 255–269. [DOI] [PubMed] [Google Scholar]
- Hazards, E. B. P. (2010). Scientific opinion on monitoring and assessment of the public health risk of “Salmonella Typhimurium‐like” strains. EFSA Journal, 8(10), 1826 10.2903/j.efsa.2010.1826 [DOI] [Google Scholar]
- Kaas, R. S. , Leekitcharoenphon, P. , Aarestrup, F. M. , & Lund, O. (2014). Solving the problem of comparing whole bacterial genomes across different sequencing platforms. PloS One, 9(8), e104984. [DOI] [PMC free article] [PubMed] [Google Scholar]
- Kuhn, M. (2008). Building predictive models in R using the caret package. Journal of Statistical Software, 28(5), 1–26.27774042 [Google Scholar]
- Kuhn, M. (2018). The caret package: Classification and regression training . Retrieved from https://cran.r-project.org/web/packages/caret/caret.pdf
- Kuhn, M. , & Johnson, K. (2013). Applied predictive modeling. New York, NY: Springer. [Google Scholar]
- Kursa, M. B. , & Rudnicki, W. R. (2010). Feature selection with the Boruta package. Journal of Statistical Software, 36(11), 1–13. [Google Scholar]
- Landis, J. R. , & Koch, G. G. (1977). The Measurement of observer agreement for categorical data. Biometrics, 33(1), 159. [PubMed] [Google Scholar]
- Leekitcharoenphon, P. , Kaas, R. S. , Thomsen, M. C. F. , Friis, C. , Rasmussen, S. , Aarestrup, F. M. , … Aarestrup, F. M. (2012). SNP tree–A web‐server to identify and construct SNP trees from whole genome sequence data. BMC Genomics, 13(Suppl 7), S6. [DOI] [PMC free article] [PubMed] [Google Scholar]
- Letunic, I. , & Bork, P. (2016). Interactive tree of life (iTOL) v3: An online tool for the display and annotation of phylogenetic and other trees. Nucleic Acids Research, 44(W1), W242–5. [DOI] [PMC free article] [PubMed] [Google Scholar]
- Li, H. , & Durbin, R. (2009). Fast and accurate short read alignment with Burrows‐Wheeler transform. Bioinformatics, 25(14), 1754–1760. [DOI] [PMC free article] [PubMed] [Google Scholar]
- Li, H. , Handsaker, B. , Wysoker, A. , Fennell, T. , Ruan, J. , & Homer, N. … 1000 Genome Project Data Processing Subgroup .(2009) The sequence alignment/map format and SAMtools. Bioinformatics, 25(16), 2078–2079. [DOI] [PMC free article] [PubMed] [Google Scholar]
- Libbrecht, M. W. , & Noble, W. S. (2015). Machine learning applications in genetics and genomics. Nature Reviews Genetics, 16(6), 321–332. [DOI] [PMC free article] [PubMed] [Google Scholar]
- Lupolova, N. , Dallman, T. J. , Holden, N. J. , & Gally, D. L. (2017). Patchy promiscuity: Machine learning applied to predict the host specificity of Salmonella enterica and Escherichia coli . Microbial Genomics, 3(6), e00135. [DOI] [PMC free article] [PubMed] [Google Scholar]
- Lupolova, N. , Lycett, S. J. , & Gally, D. L. (2019). A guide to machine learning for bacterial host attribution using genome sequence data. Microbial Genomics, 5(12), 000317. [DOI] [PMC free article] [PubMed] [Google Scholar]
- Machado, G. , Mendoza, M. R. , & Corbellini, L. G. (2015). What variables are important in predicting bovine viral diarrhea virus? A random forest approach. Veterinary Research, 46(1), 85. [DOI] [PMC free article] [PubMed] [Google Scholar]
- McClelland, M. , Sanderson, K. E. , Spieth, J. , Clifton, S. W. , Latreille, P. , Courtney, L. , … Wilson, R. K. (2001). Complete genome sequence of Salmonella enterica serovar Typhimurium LT2. Nature, 413(6858), 852–856. [DOI] [PubMed] [Google Scholar]
- Mughini‐Gras, L. , Franz, E. , & Pelt, W. Van (2017). New paradigms for Salmonella source attribution based on microbial subtyping. Food Microbiology, 71, 1–8. [DOI] [PubMed] [Google Scholar]
- Mullner, P. , Jones, G. , Noble, A. , Spencer, S. E. F. , Hathaway, S. , & French, N. P. (2009). Source attribution of food‐borne zoonoses in New Zealand: A modified Hald model. Risk Analysis, 29(7), 970–984. [DOI] [PubMed] [Google Scholar]
- Munck, N. , Leekitcharoenphon, P. , Litrup, E. , Kaas, R. , Meinen, A. , Guillier, L. , … Hald, T. (2020). Four European Salmonella Typhimurium datasets collected to develop WGS‐based source attribution methods. Scientific Data, 7(1), 75. [DOI] [PMC free article] [PubMed] [Google Scholar]
- Munck, N. , Smith, J. , Bates, J. , Glass, K. , Hald, T. , & Kirk, M. D. (2019). Source attribution of Salmonella in Macadamia nuts to animal and environmental reservoirs in Queensland, Australia. Foodborne Pathogens and Disease, 17(5), 357–364. [DOI] [PMC free article] [PubMed] [Google Scholar]
- Njage, P. M. K. , Henri, C. , Leekitcharoenphon, P. , Mistou, M. , Hendriksen, R. S. , & Hald, T. (2018). Machine learning methods as a tool for predicting risk of illness applying next‐generation sequencing data. Risk Analysis, 39(12), 1397–1413. [DOI] [PMC free article] [PubMed] [Google Scholar]
- Njage, P. M. K. , Leekitcharoenphon, P. , & Hald, T. (2019). Improving hazard characterization in microbial risk assessment using next generation sequencing data and machine learning: Predicting clinical outcomes in shigatoxigenic Escherichia coli. International Journal of Food Microbiology, 292, 72–82. [DOI] [PubMed] [Google Scholar]
- Ogutu, J. O. , Piepho, H.‐P. , & Schulz‐Streeck, T. (2011). A comparison of random forests, boosting and support vector machines for genomic selection. BMC Proceedings, 5(S3), S11. [DOI] [PMC free article] [PubMed] [Google Scholar]
- Pires, S. M. , Evers, E. G. , van Pelt, W. , Ayers, T. , Scallan, E. , Angulo, F. J. , … Hald, T. (2009). Attributing the human disease burden of foodborne infections to specific sources. Foodborne Pathogens and Disease, 6(4), 417–424. [DOI] [PubMed] [Google Scholar]
- Price, M. N. , Dehal, P. S. , & Arkin, A. P. (2009). FastTree: Computing large minimum evolution trees with profiles instead of a distance matrix. Molecular Biology and Evolution, 26(7), 1641–1650. [DOI] [PMC free article] [PubMed] [Google Scholar]
- Stekhoven, D. J. , & Buhlmann, P. (2012). MissForest—Non‐parametric missing value imputation for mixed‐type data. Bioinformatics, 28(1), 112–118. [DOI] [PubMed] [Google Scholar]
- Toft, N. , Innocent, G. T. , Gettinby, G. , & Reid, S. W. J. (2007). Assessing the convergence of Markov chain Monte Carlo methods: An example from evaluation of diagnostic tests in absence of a gold standard. Preventive Veterinary Medicine, 79(2–4), 244–256. [DOI] [PubMed] [Google Scholar]
- Uzzau, S. , Brown, D. J. , Wallis, T. , Rubino, S. , Leori, G. , Bernard, S. , … Olsen, J. E. (2000). Host adapted serotypes of Salmonella enterica . Epidemiology and Infection, 125(2), 229–255. [DOI] [PMC free article] [PubMed] [Google Scholar]
- Zhang, S. , Li, S. , Gu, W. , Den Bakker, H. , Boxrud, D. , Taylor, A. , … Deng, X. (2019). Zoonotic source attribution of Salmonella enterica serotype typhimurium using genomic surveillance data, United States. Emerging Infectious Diseases, 25(1), 82–91. [DOI] [PMC free article] [PubMed] [Google Scholar]
Associated Data
This section collects any data citations, data availability statements, or supplementary materials included in this article.
Supplementary Materials
Supplementary Material
Table A1: Sensitivity, Specificity and Balanced Accuracy for the Prediction of Sources by the Random Forest Machine Learning Model.