

Abstract
Lignosulfonates are bulk‐scale byproducts of industrial sulfite pulping. Their amphiphilic character plays a central role in their successful application in large‐scale materials production. As an inherent feature of the chemical structure, this amphiphilic character poses a major analytical challenge. In this study, the amphiphilic behavior of an industrial lignosulfonate was investigated by hydrophobic interaction chromatography (HIC). This technique exploits hydrophobic regions present on the surface of lignosulfonates. Extensive characterization of the obtained fractions from preparative HIC, in terms of elemental composition, functional‐group content, chemical structure, and molecular weight distribution, revealed a detailed picture of the chemical composition distribution. The charge‐to‐size ratio, that is, differences in the degree of sulfonation, was the dominant factor governing separation in HIC. A combination of HIC with size exclusion chromatography showed good orthogonality of separation and demonstrated the power of this 2 D liquid chromatography approach for an in‐depth characterization, in general, and amphiphilicity, in particular.
Keywords: amphiphiles, analytical methods, ligninosulfonates, liquid chromatography, polymers
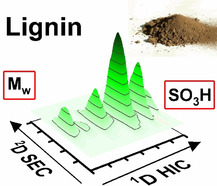
Better together: Hydrophobic interaction chromatography (HIC) is shown to be a suitable liquid chromatography (LC) technique for separating lignosulfonates according to their chemical composition. A combination of HIC with size exclusion chromatography (SEC) shows good orthogonality of separation and demonstrates the power of this 2 D LC approach for an in‐depth characterization of lignosulfonates and detailed assessment of their amphiphilicity.
Introduction
Lignosulfonates are important co‐products from the sulfite pulping process, and are currently utilized in various industries, by exploiting their surface‐active properties.1 They serve as dispersing agents, colloidal stabilizers, detergents, surfactants, and even adhesives in animal feeds.2 Sulfonation of the otherwise hydrophobic lignin backbone occurs during sulfite pulping, and renders the product lignosulfonates water‐soluble at any pH—a characteristic trait that distinguishes them from other technical lignins, such as Kraft lignins.2 The introduction of strongly polar sulfo groups, moreover, induces the amphiphilic character, on which their use as surfactants is based.1 Thus, amphiphilicity is a key to the successful industrial application of lignosulfonates, although analytical elucidation of this feature, which is a result of the interplay of the inherent hydrophobic domains and hydrophilic groups, remains quite challenging.
Common anionic surfactants usually consist of a polar end group (head) and one or more hydrophobic chains (tail), for instance, sodium dodecyl sulfate or linear alkylbenzene sulfonates. Typically, the nature of the hydrophilic group(s) largely defines the interactions of a surfactant in solution.3 However, the chemical structure of the hydrophobic part can also have a significant influence on the surface activity. Molecular weight, branching, unsaturation, or the presence of aromatic nuclei have an impact on surfactant behavior in solution, by affecting solubility, thermal stability, and biodegradability.3 To a certain extent, lignosulfonates exhibit all of these structural attributes. They usually have a branched, heterogeneous structure with broad molecular weight distributions (MWDs) and weight‐average molecular weights M w up to 150 000 g mol−1.1, 2 They also bear a variety of anionic polar moieties, such as phenolic and aliphatic hydroxyl groups, as well as carboxylic and sulfonic acid groups, which make lignosulfonates polyelectrolytes.
A primary tool for the characterization of lignosulfonates is size‐exclusion chromatography (SEC).4 Here, undesired enthalpic interactions between the solute and the stationary phase are prevented by co‐dissolved salts and ion pairing, which promote the desired separation solely on the basis of the hydrodynamic radii of the solutes. In addition, although SEC of lignosulfonates is well established, separations based on their chemical composition have not yet reached such level. Functional‐group contents of lignosulfonates are typically determined by wet‐chemical methods, and not by means of liquid chromatography (LC). They are sum parameter, that is, the average of a given distribution, which remains hidden, although its elucidation would be highly relevant for industrial applications.
A number of publications focused on the exploration of ion‐pair reversed‐phase LC (RPLC) of lignins, lignin derivatives, lignin degradation products, and humic substances, which are another class of biobased polyelectrolytes.5, 6, 7, 8, 9, 10, 11 However, the goal was separation according to size, but not according to chemical composition. Brudin et al. could not achieve significant orthogonality of separation using the combination of ion‐pair RPLC and ion‐pair SEC.5 Various other LC techniques have also been explored, including capillary electrophoresis for aromatic sulfonates,11 hydrophilic interaction chromatography and weak anion exchange chromatography for anionic surfactants,12 and ion exchange chromatography, metal ion affinity chromatography, and LC at critical conditions for humic substances.10, 13 Again, the aim was isolating fractions rather than profiling chemical compositions.
Hydrophobic interaction chromatography (HIC), as a variant of affinity chromatography, is a prominent technique for the purification of biological compounds, ranging from analytical to industrial scale.14 In HIC, the adsorption of solutes on a weakly hydrophobic stationary phase is favored by a high salt concentration in the mobile phase. Afterwards, elution of solutes is facilitated by a decrease in the salt concentration; the addition of modifiers (e.g., alcohols, detergents, chaotropic salts) can be used to promote the elution of strongly bound solutes.14 HIC has been tested on lignin–carbohydrate complexes and humic substances,15, 16 and more preliminarily on lignosulfonates and sulfonated Kraft lignin.17 In‐depth characterization of the fractions obtained by HIC has not been performed, and its true potential for profiling the chemical structure of lignins and lignosulfonates has yet to be determined.
Complex polymers exhibiting variation not only in molecular weight and size, but also in composition, require the combination of different separation systems to achieve the desired resolution and depth of characterization needed for successful industrial usage.18, 19, 20, 21 Our aim was to assess the potential of HIC in (offline) combination with SEC to reach such a high degree of insight into the complex amphiphilic structure of lignosulfonates. Ultimately, we attempted thereby to obtain a better understanding of how molecular weight and chemical functionality profiles influence the amphiphilicity of lignosulfonates as a whole.
Results and Discussion
Preparative HIC
In general, the preparative HIC fractionation of the purified lignosulfonate yielded a comparable outcome to the analytical counterpart (see Figure 1), with adsorption efficacies [Σ(peak area) of 2F–6F] of 89.5 and 87 %, respectively. Moreover, the successive peak areas of the collected fractions 2F–6F were in good agreement with the analytical profile (see Supporting Information), although a shift towards later fractions was observed in the case of preparative fractionation (see Figure 1). This shift is related to a stronger interaction of the lignosulfonate with the stationary phase in the preparative approach. In addition, base‐line separation was not optimal, similar to the case of analytical fractionation. On the one hand, the complex nature of lignosulfonates contributes to peak tailing, which is caused by eluting species still interacting to some extent with the stationary phase. On the other hand, base‐line drift occurs naturally with a change in the eluent composition or flow rate.
Figure 1.

(Left) Normalized chromatogram from preparative HIC fractionation of lignosulfonate. (Right) Comparison between preparative and analytical HIC fractionation in terms of relative peak area versus EtOH content in the mobile phase. A tendency towards later elution was seen in preparative HIC.
HSQC NMR spectroscopy
Figure 2 shows the HSQC NMR spectra of the reference sample (LS) with selected structural motifs highlighted. Peak assignment was carried out according to the literature.22, 23, 24 Although the HSQC spectra are not strictly quantitative, the chosen conditions allow an approximate relative comparison of the selected features between the fractions. Fractions 1F–4F showed no major structural changes compared to reference sample LS (see Supporting Information). Fractions 5F and 6F could not be assessed by HSQC NMR spectroscopy owing to their limited solubility in deuterated DMSO. The similarity of the HSQC NMR spectra indicates that all key structural features of lignosulfonates are still present in the different HIC fractions. A significant influence of the structure of the lignin backbone on the separation in HIC could thus not be discerned. Structural effects are superimposed by effects of molecular weight and chemical functionality. Consequently, it is not feasible to deduce the degree of amphiphilicity of a given lignosulfonate simply from its HSQC NMR spectrum.
Figure 2.
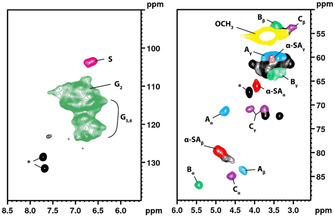
HSQC NMR spectra of the reference sample (LS). Selected structural motifs are highlighted: S (S unit); G2,5,6 (G unit); Aα,β,γ (β‐aryl ether); Bα,β,γ (phenylcoumaran); Cα,β,γ (resinol); and α‐SAα,β,γ (sulfo group in α position). *=plasticizer impurity.
Furthermore, the spectra of the ultrafiltrated fractions (UF10 to UF100) exhibited no substantial structural changes, and all structural features were present in the different ultrafiltrated fractions as well (see Supporting Information). This indicates limited changes in the structure of the lignin backbone with molecular weight in the lignosulfonate studied. The determination of the syringyl/guaiacyl (S/G) ratio of the reference sample (LS) yielded a very small fraction of 0.012 S units per G unit, which is typical for softwood lignins.25, 26, 27 The S/G ratio of HIC fractions 1F–4F ranged between 0.006 and 0.008. Moreover, the ultrafiltrated fractions showed a decrease in the S/G ratio from 0.014 (UF10 and UF3–UF10) to 0.009 (UF10–30, UF30–UF100, and UF100) with increasing molecular weight.
Effect of molecular weight on HIC fractionation
The strength of 2 D separation lies in the combination of techniques based on dissimilar separation principles, that is, their orthogonality. Since SEC is crucial for the characterization of lignosulfonates, the suitability of HIC for implementation into a 2 D setup depends on its capability to achieve separation based on chemical composition, rather than on molecular weight. Therefore, the influence of molecular weight on the separation of lignosulfonates in HIC was extensively investigated.
Polystyrene sulfonate (PSS) standards
In a first attempt to understand the elution mechanism of sulfonated polymers in HIC, uniform polystyrene sulfonate (PSS) standards of increasing molecular weight (6.5, 14.9, 29.1, and 63.9 kDa) were evaluated with the analytical HIC setup (Figure 3). PSS standards were chosen because they are commonly used as standards in SEC of lignins or lignosulfonates. Additionally, their uniform degree of sulfonation (>90 %) allowed comparison of polymers with the same charge‐to‐size ratio, for which elution is influenced solely by the difference in size.
Figure 3.
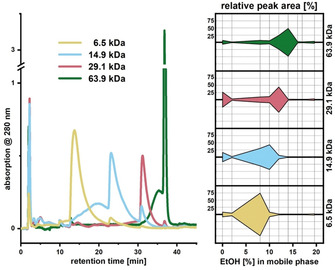
(Left) Normalized chromatograms from analytical HIC fractionation of PSS standards of different sizes. (Right) Comparison of PSS standards in terms of relative peak area versus EtOH content in the mobile phase. Elution was sensitive to M w with lower‐M w standards eluted earlier than higher‐M w ones.
The adsorption efficacy [Σ(peak area) of 2F–6F] ranged between 74 and 93 %, and was found to be unrelated to M w of the PSS standard. Elution of the PSS standards was sensitive to eluent composition with respect to their M w values, whereby lower‐M w standards were eluted earlier than higher‐M w standards (Figure 3). In all cases, elution of the focused main peak was preceded by a broad onset, leading to an asymmetric peak shape. Typical for HIC, the transition from adsorption to elution is very sensitive to the eluent composition, and thus can be fairly abrupt. At a certain eluent composition, the adsorption of PSS on the stationary phase can be sufficiently weakened to allow elution, while interaction with the stationary phase is still strong enough to cause considerable retention. After another small increase in the elution strength of the mobile phase, retention becomes rapidly negligible, and a sharp main peak appears. The same applies to the small succeeding peaks (Figure 3). Here, peak tailing is shortened by an increase in elution strength.
Ultrafiltrated lignosulfonate fractions (UF)
In the second step, lignosulfonate fractions UF10–UF100 of different molecular weights were evaluated with the analytical HIC setup. Here, the specific aim was to elucidate the elution behavior of lignosulfonate fractions with narrow weight distributions, and to compare them with the PSS standards. The fractions were obtained by ultrafiltration (Scheme 1); their MWDs according to size exclusion chromatography (SEC) are shown in Figure 5, and the statistical moments of the distributions are given in Table 1.
Scheme 1.

The sequential fractionation of purified lignosulfonate by membrane ultrafiltration (100 to 3 kDa). Colored boxes indicate the collected sample fractions.
Figure 5.
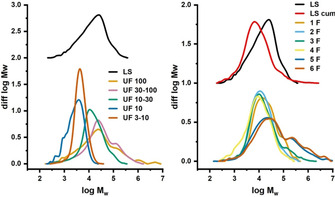
Normalized SEC diagrams of the ultrafiltrated fractions (Left) and fractions 1F–6F collected from preparative HIC (Right). MWD of the original lignosulfonate (LS) and a cumulated MWD of the HIC fractions (LS cum.) are also shown as references.
Table 1.
Calculated statistical moments for lignosulfonate fractions from HIC and ultrafiltration based on SEC MALS.
|
Sample |
Statistical moments |
|||||
|---|---|---|---|---|---|---|
|
method |
name |
M n [kDa] |
M w [kDa] |
M z [kDa] |
M p [kDa] |
Đ (M w/M n) |
|
HIC |
LS |
6.34 |
26.64 |
68.64 |
25.40 |
4.2 |
|
1F |
9.02 |
33.11 |
95.85 |
13.23 |
3.7 |
|
|
2F |
7.48 |
23.12 |
74.08 |
11.02 |
3.1 |
|
|
3F |
7.42 |
40.09 |
259.45 |
9.73 |
5.4 |
|
|
4F |
4.35 |
17.34 |
51.80 |
8.85 |
4.0 |
|
|
5F |
10.56 |
214.60 |
2 439.49 |
21.82 |
20.3 |
|
|
6F |
11.47 |
277.40 |
2 317.67 |
29.33 |
24.2 |
|
|
UF |
3–10 |
3.72 |
5.19 |
7.02 |
4.25 |
1.4 |
|
10 |
1.97 |
3.57 |
5.44 |
3.85 |
1.8 |
|
|
10–30 |
7.19 |
23.30 |
56.64 |
10.63 |
3.2 |
|
|
30–100 |
8.39 |
72.09 |
285.97 |
23.47 |
8.5 |
|
|
100 |
6.04 |
85.68 |
561.71 |
23.99 |
14.2 |
|
The normalized HIC chromatograms of the UF fractions (Figure 4, left) show a clear shift towards later elution of the sample with increasing molecular weight, as was the case for the PSS standards. The adsorption efficacy [Σ(peak area) of 2F–6F] also increased with increasing molecular weight and ranged between 67 and 92 %. However, the cumulative elution profile exhibited a much flatter shape compared with those of the PSS standards (Figure 4, right). To some extent, this feature of the elution profile is caused by the higher dispersity Đ of the UF fractions compared with the PSS standards. The lower average degree of sulfonation among the UF fractions (32–41 %, see Table 2) compared to the high degrees of sulfonation of the PSS standards contributes to later elution as well. Still, taking the differences in M w among the UF fractions into consideration (see Table 1), their elution profiles would have been expected to exhibit larger differences in the front and rear sections of the chromatograms. This indicates that the separation is influenced by additional factors other than molecular weight and average degree of sulfonation.
Figure 4.
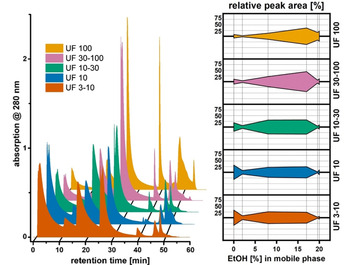
(Left) Normalized chromatograms from analytical HIC fractionation of ultrafiltrated lignosulfonates. (Right) Comparison of UF samples in terms of relative peak area versus EtOH content in the mobile phase. Elution was less sensitive to the respective M w values of the fraction compared with the PSS standards.
Table 2.
Lignosulfonate composition based on EA, HS‐GC, 31P NMR spectroscopy, and acidic methanolysis.
|
Sample |
Elemental analysis |
HS‐GC |
31P NMR |
Methanolysis |
||||
|---|---|---|---|---|---|---|---|---|
|
method |
name |
C9 formulae |
C9 M w [g mol−1] |
SO3H [mmol g−1] |
OCH3 [mmol g−1] |
aliphatic OH [mmol g−1] |
phenolic OH [mmol g−1] |
sugars [mg g−1] |
|
HIC |
LS |
C9H11.2N0.06S0.32O4.3 |
198.6 |
1.63 |
4.14 |
2.43 |
1.88 |
11.32 |
|
1F |
C9H11.7N0.19S0.39O4.8 |
211.8 |
1.84 |
3.36 |
1.44 |
1.78 |
7.41 |
|
|
2F |
C9H12.4N0.19S0.38O4.9 |
213.5 |
1.77 |
n.d. |
n.d. |
n.d. |
n.d. |
|
|
3F |
C9H11.0N0.20S0.34O5.0 |
212.5 |
1.58 |
3.20 |
0.70 |
1.31 |
8.90 |
|
|
4F |
C9H10.8N0.16S0.31O4.2 |
199.0 |
1.58 |
4.03 |
1.05 |
1.41 |
9.60 |
|
|
5 F |
C9H10.7N0.11S0.33O5.2 |
213.3 |
1.53 |
3.14 |
n.d. |
n.d. |
n.d. |
|
|
6F |
C9H10.9N0.13S0.29O5.2 |
213.3 |
1.38 |
2.79 |
n.d. |
n.d. |
n.d. |
|
|
UF |
3–10 |
C9H11.0N0.05S0.36O4.2 |
199.0 |
1.83 |
4.30 |
2.93 |
1.94 |
8.34 |
|
10 |
C9H10.9N0.07S0.41O4.5 |
204.7 |
2.01 |
3.83 |
2.43 |
2.31 |
11.03 |
|
|
10–30 |
C9H10.7N0.04S0.35O4.2 |
197.3 |
1.79 |
4.13 |
2.84 |
1.81 |
14.45 |
|
|
30–100 |
C9H10.5N0.17S0.33O3.7 |
191.6 |
1.74 |
3.87 |
2.75 |
1.78 |
n.d. |
|
|
100 |
C9H10.8N0.04S0.32O4.0 |
193.7 |
1.66 |
4.13 |
2.49 |
1.72 |
12.43 |
|
Preparative HIC lignosulfonate fractions
The impact of molecular weight on the separation in preparative HIC was directly assessed by SEC of the collected fractions 1F–6F; their MWDs are shown in Figure 5. Statistical moments of the distributions are given in Table 1. Fractions 5F and 6F could only be partially characterized because of limited solubility in the mobile phase. Moreover, these fractions also showed aggregation tendencies in SEC, which led to distortion of the MWD towards higher molecular weight. A cumulative MWD [Σ1(F–6F] of the collected fractions can be calculated by weighting their MWDs according to their relative peak areas in HIC. The thus‐calculated MWD was shifted towards lower molecular weight compared with reference sample LS (Figure 5). This shift may well be related to the extensive sample purification after fractionation. Also, a change of solubility of the high molecular weight fraction in the SEC eluent could be the reason for this. Nevertheless, despite the neglect of a minor part of the higher molecular weight fraction, the obtained MWD data can be regarded as reliable with regard to further evaluation.
To illustrate the orthogonality of the offline combination of preparative HIC and SEC, a 2 D plot was constructed (Figure 6) by using the respective MWDs of the collected fractions 1F–6F and the preparative HIC chromatogram. The resulting plot shows the distribution of molecular weight segments along the HIC fractionation domain, with the color code indicating the relative incidence. The good orthogonality of separation of the HIC‐SEC combination for lignosulfonates was obvious, that is, no distinct separation in terms of molecular weight could be observed.
Figure 6.
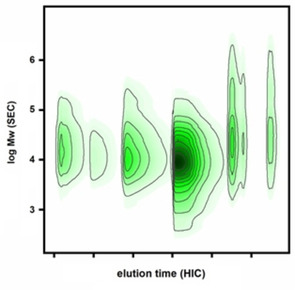
2 D plot from the offline combination of preparative HIC and SEC, demonstrating the good orthogonality of the HIC/SEC combination for lignosulfonates.
By dividing the plot into specific molecular weight sections (<1 kDa, 1–10 kDa, 10–100 kDa, and >100 kDa), a simplified elution matrix was produced that allows calculation of elution profiles for certain molecular weight ranges (Figure 7). Even though the difference in size between the sections is up to an order of magnitude, the elution profiles are surprisingly flat, as in the case of the UF fractions. The low and high molecular weight fractions appear to be well distributed across all of the collected fractions in HIC, and this reveals a limited impact of molecular weight on the separation outcome.
Figure 7.

Elution profiles of molecular weight sections along the HIC fractionation domain, derived from the 2 D plot. Relative peak area is plotted against the EtOH content in the mobile phase. Elution of low and high molecular weight fractions appears to be well distributed in HIC across all collected fractions.
In a further part of the work, the appropriateness of the simplified elution matrix for the prediction of elution profiles was examined. The elution profiles of ultrafiltrated fractions UF10–UF100 were predicted simply on the basis of their MWDs. To this end, the MWD was divided into specific weight sections (<1 kDa, 1–10 kDa, 10–100 kDa, and >100 kDa) and allocated to HIC fractions 1F–6F according to the simplified elution matrix. Then, the predicted profile was compared to the actual experimental elution profile (see Supporting Information).
The prediction is satisfactory overall, but evidently lacks precision in the regions of low (<10 kDa) and very high (>100 kDa) molecular weight, because these regions are not well represented in the elution matrix. Specifically, a large part of the low molecular weight fraction (<1 kDa) was lost during dialysis of the collected fractions, and the high molecular weight fraction was diminished because of limited dissolution in the SEC solvent. Still, apart from these border regions, the obtained elution matrix represents the characteristic distribution of hydrophobicity in the studied lignosulfonate quite well, and certainly justifies in‐depth optimization work and further elaboration of the 2 D HIC/SEC combination.
Effect of the charge‐to‐size ratio on HIC fractionation
The chemical composition of the lignosulfonate presumably has an important influence on the separation in HIC. To test for such dependence, the fractions obtained from the preparative HIC fractionation (1F–6F) and reference sample LS were comprehensively characterized with regard to their contents of hydroxyl and carboxyl groups (31P NMR spectroscopy), methoxyl groups (HS‐GC‐MS), and sulfo groups (elemental analysis). The characterization of the lignosulfonate fractions from ultrafiltration (UF10 to 100) would answer the question of whether changes in the functional group content of the collected fractions are related to a shift in the MWD or to a true difference in the charge‐to‐size ratio.
Functional‐group contents of the HIC fractions
The functional‐group contents of collected fractions 1F–6F are listed in Table 2. In the case of 2F, the collected amount of sample was too small to perform 31P NMR spectroscopy, while the 31P NMR studies on 5F and 6F failed due the low solubility in the solvent mixture. Acidic methanolysis was only carried out on 1F, 3F, and 4F. The reference values (LS) were determined on the original lignosulfonate after dialysis. Values were corrected for the inorganic content of the samples, which was determined by elemental analysis. To test the reliability of the functional‐group determinations, functional‐group contents of the collected fractions were cumulated according to their relative peak areas in HIC. In this way, the original sample was reconstructed from its separated components and then compared to the contents of reference sample LS (Figure 8).
Figure 8.
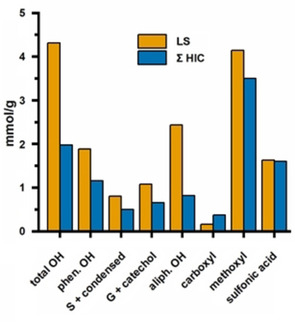
Cumulated functional group contents from the collected HIC fractions (Σ(1F to 6F)) compared to the contents from the reference sample (LS). Recovery of hydroxyl groups was suboptimal (see text for the reasons).
In general, the recovery of hydroxyl groups was suboptimal, evidently in part due to the limited solubility of 5F and 6F in solvents for 31P NMR measurements. However, the contents of aliphatic hydroxyl groups were also much lower than anticipated, probably owing to some disturbances in the derivatization procedure for 31P NMR spectroscopy. The reasons for this peculiarity are unknown, and the recovery of phenolic hydroxyl groups is only slightly lower than expected. The contents of carboxyl groups are overestimated to a large degree because of residual citric acid. Owing to all of these complications, the 31P NMR data of collected fractions 1F–6F should be treated with caution.
Determination of methoxyl groups was reliable, and showed only slightly lower recovery than expected. The methoxyl‐group content decreased along the fractions from 3.36 to 2.79 mmol g−1, except for 4F, which was in the range of reference sample LS with a methoxyl‐group content of 4.03 mmol g−1. In addition, the recovery of sulfo groups reached almost 100 %, that is, indirect determination by elemental analysis was quite reliable. The elemental composition of the collected fractions differed to some extent, but revealed, on average, one sulfo group per three C9 units. The sulfo content steadily decreased along the fractions from 1.84 to 1.38 mmol g−1, that is, it had an influence on the separation. A high content of the strongly polar sulfo groups renders the lignosulfonate less hydrophobic, and thus enables earlier elution in HIC. The carbohydrate content of the purified lignosulfonate (LS) was low, with only 11.32 mg g−1; no significant differences between 1F, 3F, and 4F were observed.
Influence of molecular weight on functional‐group contents
The characterization of the lignosulfonate fractions from ultrafiltration (UF10–UF100) revealed changes in the functional‐group contents with molecular weight (Table 2). This has already been observed in the literature.28, 29, 30, 31, 32 Unlike the collected fractions from HIC, the ultrafiltrated fractions showed good solubility in the 31P NMR solvent mixture. The content of aliphatic and the phenolic hydroxyl groups decreased with increasing molecular weight from 2.93 to 2.49 mmol g−1 and from 2.31 to 1.72 mmol g−1, respectively. The same was true for the sulfo‐group content, which decreased from 2.01 to 1.66 mmol g−1 with increasing molecular weight. Methoxyl‐group contents varied between 3.83 and 4.30 mmol g−1, while no distinct trend with molecular weight was observed. Carbohydrate contents varied between 8.34 and 14.45 mg g−1.
In Figure 9, methoxyl‐ and sulfo‐group contents of collected fractions 1F–6F, the reference sample LS, and the ultrafiltrated fractions UF10–UF100 are plotted against their respective molecular weights at the peak M p. The comparison was carried out only for methoxyl and sulfo groups, since they provided the most reliable functional‐group data concerning recovery. The M p value was chosen instead of M w as the reference for molecular weight because of the distorted MWDs of 5F and 6F. Under the assumption that ultrafiltration is only sensitive to size, the determined functional‐group contents of UF10–UF100 represent the average chemical composition of the lignosulfonate at a certain molecular weight. Consequently, if the collected fractions 1F–6F truly resulted from a separation based on their chemical composition, their actual functional‐group contents must be different from the average content that is expected from their molecular weight. Higher values would imply an enrichment of species with a higher content of methoxyl or sulfo groups compared with the average, and vice versa for lower values. Moreover, large deviations from the average contents indicate a large variation in the chemical composition at a certain molecular weight. Concerning methoxyl groups, all of the collected fractions, except 4F, showed a much lower content than anticipated from their molecular weight. In addition, the methoxyl content of the collected fractions decreased with increasing molecular weight. Notably, the difference in the methoxyl‐group content did not result from a change in the S/G ratio, since that difference between the fractions is rather low (see above). Concerning sulfo groups, 1F and 2F showed the expected or slightly higher content, while the later fractions (3F–6F) showed a lower‐than‐average content of sulfo groups. The charge‐to‐size ratio, which is expressed in sulfo‐group content per unit molecular weight, clearly decreased from 1F to 6F, and this is indicative of its strong influence on the separation mechanism. The observed characteristics of the collected fractions, in terms of functional‐group content, led to the reasonable hypothesis of a chemical composition distribution (CCD) in lignosulfonates along their MWD. HIC was able to resolve these differences in the chemical composition and, therefore, has substantial potential for 2 D LC applications in lignosulfonate analytics.
Figure 9.
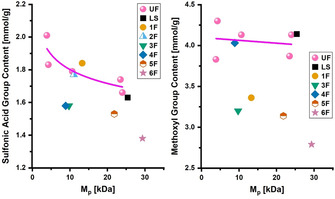
Functional group content versus M p of the collected HIC fractions (1F–6F), the reference sample (LS), and the ultrafiltrated fractions (UF10–UF100). (Left) sulfo groups; (Right) methoxyl groups. UF represents the average content from molecular weight; different contents indicate differences in the chemical composition of the collected fractions.
Conclusion
HIC proved to be a suitable LC technique for the separation of the studied lignosulfonate according to its chemical composition. It was able to resolve the different charge‐to‐size ratios present in the lignosulfonate. By contrast, SEC differentiates according to the hydrodynamic radii in solution, and eventually the molecular weight distribution. Specifically, the elution of the lignosulfonate in HIC was strongly related to the degree of sulfonation, which allows for more detailed information on the content and effect of sulfo groups than can be provided by other methods. HIC offers good orthogonality of separation in combination with SEC, providing the opportunity for in‐depth characterization of the chemical structure in terms of the MWD and CCD. For the first time, this 2 D‐LC approach has been set up for a lignosulfonate and critically evaluated. Besides direct determination of changes in the degree of sulfonation and in the resultant properties, the combination of HIC and SEC enabled detailed assessment of the amphiphilicity of the studied lignosulfonate, which is an intricate, complex property of lignosulfonates resulting from their chemical structure. Thus far, it has only been roughly described qualitatively and has not been directly analytically accessible.
Experimental Section
Raw material
An industrial sulfite spent liquor from the Magnefit process was purified according to Sumerskii et al.,33 by using Amberlite XAD‐7 (20–60 mesh), a macroporous polyacrylate resin, and Dowex 50WX8, a strongly acidic cation exchange resin. Both resins were obtained from Sigma‐Aldrich, and pretreated as described by Sumerskii et al.33 The purification process removes carbohydrate‐derived and inorganic byproducts of the sulfite spent liquor.
Ultrafiltration
Part of the purified lignosulfonate was subjected to ultrafiltration to obtain consecutive fractions of decreasing molecular weight. Ultrafiltration experiments were carried out with a 200 mL ultrafiltration cell (Amicon, Model 8200, Merck Millipore, Billerica, USA) and Ultracel regenerated cellulose (RC) membranes from Merck Millipore (Billerica, USA) with cutoffs of 3, 10, 30, and 100 kDa (thickness: 230 μm; diameter: 63.5 mm). Filtration was performed in deionized water under nitrogen (2.5–3.0 bar) at room temperature. The sequential fractionation of the lignosulfonate is shown schematically in Scheme 1. The fractions UF100, UF30–UF100, UF10–UF30, UF10, and UF3–UF10 were used for further measurements.
Mobile phases
The composition of the mobile phase was adopted from Ekeberg et al.,17 and the eluents were 0.05 m citric acid buffer containing 0.25 m ammonium sulfate (eluent A), ethanol/water (20 % v/v, eluent B), and 2‐propanol/water (40 % v/v, eluent C). Water (HPLC grade), ammonium sulfate (extra pure), citric acid (>99.5 %), sodium azide (>99.5 %), sodium hydroxide (NaOH), and 2‐propanol (HPLC grade) were purchased from Sigma‐Aldrich‐Fluka‐Merck (Schnelldorf, Germany) and used without further purification. Ethanol (absolute, HPLC grade) was purchased from Fisher Scientific (Schwerte, Germany).
Citric acid buffer (eluent A) was prepared by dissolving 33 g of ammonium sulfate, 10 g of citric acid, and 0.1 g of sodium azide in 700 mL of water. A 2 m solution of sodium hydroxide was used to adjust the pH to 7.0 prior to adding water up to 1 L. Eluent B was prepared by mixing 200 mL of ethanol with 800 mL of water (pH 12, set with 1 m NaOH). Eluent C was prepared by mixing 400 mL of 2‐propanol with 600 mL of water (pH 12, set with 1 m NaOH). All eluents were filtered through a 0.2 μm membrane (VacuCap® 60 filter unit, Pall Corporation, Port Washington, NY, USA).
Analytical HIC setup
The following setup was used in analytical HIC: Agilent Technologies 1260 Infinity quaternary pump; Agilent Technologies 1260 G1367C autosampler; Agilent Technologies 1100 G1316A column compartment, temperature: 25 °C; RESOURCETM ETH, a pre‐packed column with SourceTM 15ETH, 6.4×30 mm, bed volume 1 mL (GE Healthcare Europe GmbH, Freiburg, Germany); and an Agilent Technologies 1100 G1315B Diode Array Detector, slit width 4 nm, spectrum range: 190–600 nm (2.0 nm steps). For data evaluation, the signal at 280 nm (4 nm bandwidth; reference wavelength at 360 with 100 nm bandwidth) was used.
The flow‐rate profile and elution program, adopted from Ekeberg et al.,17 are given in Table 3. Purified lignosulfonate and its ultrafiltrated fractions were used for analysis. Polystyrene sulfonate (PSS) sodium salt standards (6.5, 14.9, 29.1, and 63.9 kDa) were used as reference materials (Polymer Standard Service, PSS GmbH, Mainz, Germany). For sample preparation, 40 mg of lignosulfonate or 10 mg of PSS standard was dissolved in eluent A, shaken overnight, and finally filtered through a 0.45 μm PTFE syringe filter. The injection volume was set to 60 μL and 80 μL for lignosulfonates and PSS standards, respectively.
Table 3.
Elution program for analytical HIC.
|
t [min] |
Flow rate [mL min−1] |
Eluent A [%] |
Eluent B [%] |
Eluent C [%] |
|---|---|---|---|---|
|
0–10 |
1 |
100 |
– |
– |
|
10–15 |
1 |
90 |
10 |
– |
|
15–24 |
1 |
60 |
40 |
– |
|
24–38 |
1 |
15 |
85 |
– |
|
38–45 |
1 |
– |
100 |
– |
|
45–52 |
0.5 |
– |
– |
100 |
|
52–70 |
0.5 |
100 |
– |
– |
Preparative HIC setup
The preparative HIC system consisted of an 1800 binary low‐pressure gradient pump (250 mL min−1 pump head); a preparative 5.9 mL mixing chamber; an ASM 2.1 L sample loading pump (50 mL min−1 pump head) for sample application (all Knauer, Berlin, Germany); a two‐way, three‐port valve to switch between pumps; and a 1:100 (v/v) fixed‐ratio splitter (ERC, Riemerling, Germany). The system was equipped with a 10×10 mm silica pre‐column (Phenomenex, Aschaffenburg, Germany) and a medium‐pressure ECOPLUS 35×140 mm column (YMC Europe GmbH, Dinslaken, Germany) packed with 200 mL SourceTM 15ETH (an ether‐modified polystyrene/divinylbenzene resin, GE Healthcare Europe GmbH, Freiburg, Germany). An Azura UVD 2.1S Detector was used for UV detection at 280 nm (Knauer, Berlin, Germany). The fractions were collected on an ISCO FOXY R1 with a 36‐position funnel rack (Teledyne, Lincoln, Nebraska, USA). Clarity Chrom software V3.0.7 (Knauer, Berlin, Germany) was used for controlling the chromatographic system and data acquisition.
For sample preparation, purified lignosulfonate (10 g) was dissolved in 1 L of ammonium sulfate adsorption buffer (eluent A), shaken overnight, and finally filtered through a 0.2 μm membrane (VacuCap® 60 filter unit, Pall Corporation, Port Washington, NY, USA).
The sample solution (18 mL, 180 mg lignosulfonate) was loaded onto the column at 10 mL min−1 with the loading pump. The flow rate was set to 25 mL min−1. The flow‐rate profile and elution program are listed in Table 4. Fractions were collected over the following intervals: 5.5–18.5 min (1F); 18.5–29 min (2F); 29–48 min (3F); 48–67 min (4F); 67–80 min (5F); and 99–109 min (6F). After pooling the fractions, sample purification was carried out by evaporation, solvent extraction with ethanol to eliminate excess ammonium sulfate, and finally dialysis to remove residual citric acid, by using regenerated cellulose tubing with a cutoff of 1 kDa (Spectra/Por® 7, Repligen Europe B.V., Breda, The Netherlands) in deionized water. A part of the purified lignosulfonate also underwent dialysis to serve as the comparative sample (LS).
Table 4.
Elution program for preparative HIC.
|
t [min] |
Flow rate [mL min−1] |
Eluent A [%] |
Eluent B [%] |
Eluent C [%] |
|---|---|---|---|---|
|
0–13.5 |
25 |
100 |
– |
– |
|
13.5–25.5 |
25 |
90 |
10 |
– |
|
25.5–43.0 |
25 |
60 |
40 |
– |
|
43–63.0 |
20 |
15 |
85 |
– |
|
63–83.5 |
20 |
– |
100 |
– |
|
83.5–88.0 |
10 |
– |
50 |
50 |
|
88–93.0 |
10 |
– |
– |
100 |
|
93–98.0 |
10 |
50 |
– |
50 |
|
98–115 |
15 |
100 |
– |
– |
NMR spectroscopy
All NMR spectra were recorded with a Bruker Avance II 400 or a Bruker Avance III HD 400 spectrometer (resonance frequencies 400.13 MHz for 1H and 100.63 MHz for 13C) equipped with a 5 mm observe broadband probe head (BBFO) or a liquid N2 cooled cryo probe head (Prodigy) with z gradients at room temperature and standard Bruker pulse programs.
HSQC NMR spectroscopy
For HSQC experiments, 20–50 mg lignosulfonate samples were dissolved in 0.6 mL of [D6]DMSO. Chemical shifts were given in parts per million, referenced to residual solvent signals (2.49 ppm for 1H, 39.6 ppm for 13C). HSQC experiments were performed in edited mode with a relaxation delay of 0.5 s by using adiabatic pulses for the inversion of 13C and the GARP sequence for broadband 13C decoupling, optimized for 1 J CH=145 Hz. Data processing was done with Bruker Topspin 3.1 or higher. Image post‐processing (coloring, size) was performed with Adobe Photoshop (Adobe Systems Inc., San José, CA, USA) for improved clarity. Determination of the S/G ratio was carried out as described in Kim et al.22
Molecular weight determination
SEC was carried out with a Dionex UltiMate 3000 chromatograph with an autosampler, column oven, and UV detector (all Thermo Fisher Scientific, Germany), coupled with an Optilab T‐rEX differential refractive index (RI) detector (λ=633 nm) and a Dawn HELEOS II MALS detector with a laser operating at 785 nm, equipped with 18 photodiodes at different measuring angles, every other with narrow band‐pass filters (±10 nm; Wyatt Technology, Santa Barbara, CA, USA). The analytical parameters were as follows: flow rate, 0.5 mL min−1; column temperature, 35 °C; injection volume, 10 μL; UV detector at 280 nm; and RI detector at 35 °C. Separation was done with an Agilent PLgel guard column of 7.5×50 mm and three Agilent PolarGel M columns of 7.5×300 mm (5 μm particle size) in series. DMSO with 0.5 % (w/v) lithium bromide was used as the eluent. Data evaluation was performed with ASTRA software, version 7.3 (Thermo Fisher Scientific, Germany). Data processing was carried out as described by Zinovyev et al.34
Samples were dissolved without derivatization at room temperature in the SEC eluent (10 mg mL−1), shaken overnight, and filtered through a 0.45 μm PTFE syringe filter before injection. The specific refractive index increment (dn/dc)μ of the original lignin sample in DMSO/LiBr (0.5 % w/v) was determined by offline injection of samples with increasing concentrations (2, 4, 6, 8, and 10 mg mL−1). The slope of the resulting plot of RI signal intensity versus sample concentration yielded a (dn/dc)μ value of 0.115.
Functional‐group analysis
Contents of aliphatic hydroxyl, phenolic hydroxyl, and carboxyl groups were determined by 31P NMR spectroscopy. Sample preparation was adapted from Korntner et al.31 Specifically, lignosulfonate (30 mg) was dissolved in a 1:1.6 mixture of N,N‐dimethylformamide and pyridine (anhydrous, nondeuterated), phosphitylation reagent (150 μL of 2‐chloro‐4,4,5,5‐tetramethyl‐1,3,2‐dioxaphospholane), internal standard (4 mg of N‐hydroxy‐5‐norbornene‐2,3‐dicarboxylic acid imide), and 0.5 mg of NMR relaxation agent, chromium(III) acetylacetonate. Spectral evaluation was carried out as described in Korntner et al.31
Methoxyl‐group content was determined in duplicate according to Sumerskii et al.35 In brief, methoxyl groups in the lignin sample were cleaved off with hydroiodic acid and converted to iodomethane, which was then quantified by headspace GC‐MS.
Elemental analysis
The determination of sulfo groups was performed indirectly by elemental analysis at the Laboratory for Microanalysis Services at the University of Vienna. Prior to analysis, the samples were thoroughly dried in a vacuum oven at 40 °C and stored under inert atmosphere. Elemental analysis was conducted as C/H/N/S analyses (oxygen was determined indirectly) with an EA 1108 CHNS‐O elemental analyzer (Carlo Erba Instruments, CE Elantech, Inc.).36
Acid methanolysis
Polysaccharide impurities were determined by acid methanolysis/GC‐MS according to literature protocols.37 GC‐MS was performed with an Agilent 6890N GC and an Agilent 5975B inert XL MSD quadrupole mass‐selective detector (EI: 70 eV), by using an Agilent HP‐5MS capillary column (30 m×0.25 mm i.d.; 0.25 μm film thickness), and helium as the carrier gas with a pressure of 0.94 bar, a flow rate of 1.1 mL min−1, a split flow rate of 7.5 mL min−1, and a split ratio of 7:1.
Conflict of interest
The authors declare no conflict of interest.
Supporting information
As a service to our authors and readers, this journal provides supporting information supplied by the authors. Such materials are peer reviewed and may be re‐organized for online delivery, but are not copy‐edited or typeset. Technical support issues arising from supporting information (other than missing files) should be addressed to the authors.
Supplementary
Acknowledgements
We gratefully acknowledge Mag. Johannes Theiner at the Faculty of Chemistry of the University of Vienna for elemental analysis. We also deeply acknowledge the following members of the Institute of Chemistry of Renewable Resources of BOKU University Vienna: Dr. Sonja Schiehser for acidic methanolysis, Dr. Ivan Sumerskii for HS GC‐MS, Dr. Hassan Amer for assistance with sample purification, and Dr. Josua Oberlerchner and Dr. Stefan Böhmdorfer for support and guidance in analytical and preparative chromatography. We gratefully acknowledge the support by our industry partners in the frame of the Flippr2 project, Mondi, Sappi, Zellstoff Pöls AG, a member of Heinzel pulp, and Papierholz Austria. The K‐Project Flippr2 is funded as part of COMET—Competence Centers for Excellent Technologies promoted by BMVIT, BMWFJ, and the states of Styria and Carinthia. The Austrian Biorefinery Center Tulln (ABCT) is gratefully acknowledged for financial and technical support.
O. Musl, I. Sulaeva, M. Bacher, A. K. Mahler, T. Rosenau, A. Potthast, ChemSusChem 2020, 13, 4595.
References
- 1. Aro T., Fatehi P., ChemSusChem 2017, 10, 1861–1877. [DOI] [PubMed] [Google Scholar]
- 2. Calvo-Flores F., Dobado J., Isac-Garcia J., Martin-Martinez F., Lignin and Lignans as Renewable Raw Materials—Chemistry, Technology and Applications, Wiley, Singapore, 2015. [Google Scholar]
- 3. Rosen M. J. in Surfactants Interfacial Phenomena, Wiley, 2004, pp. 1–33. [Google Scholar]
- 4. Brudin S., Schoenmakers P., J. Sep. Sci. 2010, 33, 439–452. [DOI] [PubMed] [Google Scholar]
- 5. Brudin S., Berwick J., Duffin M., Schoenmakers P., J. Chromatogr. A 2008, 1201, 196–201. [DOI] [PubMed] [Google Scholar]
- 6. Góra R., Hutta M., Vrška M., Katušcák S., Jablonský M., J. Sep. Sci. 2006, 29, 2179–2189. [DOI] [PubMed] [Google Scholar]
- 7. Hutta M., Góra R., J. Chromatogr. A 2003, 1012, 67–79. [DOI] [PubMed] [Google Scholar]
- 8. Mattusch J., Baran H., Schwedt G., Fresenius J. Anal. Chem. 1991, 340, 426–430. [Google Scholar]
- 9. Pojana G., Carrer C., Cammarata F., Marcomini A., Crescenzi C., Int. J. Environ. Anal. Chem. 2003, 83, 51–63. [Google Scholar]
- 10. Hutta M., Góra R., Halko R., Chalányová M., J. Chromatogr. A 2011, 1218, 8946–8957. [DOI] [PubMed] [Google Scholar]
- 11. Reemtsma T., J. Chromatogr. A 1996, 733, 473–489. [Google Scholar]
- 12. Hammer J., Haftka J. J. H., Scherpenisse P., Hermens J. L. M., de Voogt P., J. Chromatogr. A 2018, 1571, 185–192. [DOI] [PubMed] [Google Scholar]
- 13. Phillips S. L., Olesik S. V., Anal. Chem. 2003, 75, 5544–5553. [DOI] [PubMed] [Google Scholar]
- 14. Tomaz C. T., Queiroz J. A. in Liquid Chromatography: Fundamentals and Instrumentation (Eds.: S. Fanali, P. R. Haddad, C. F. Poole, P. Schoenmakers, D. Lloyd), Elsevier Inc., 2013, pp. 121–142. [Google Scholar]
- 15. Takahashi N., Azuma J. I., Koshijima T., Carbohydr. Res. 1982, 107, 161–168. [Google Scholar]
- 16. Blondeau R., Kalinowski E., J. Chromatogr. 1986, 351, 585–589. [Google Scholar]
- 17. Ekeberg D., Gretland K. S., Gustafsson J., Bråten S. M., Fredheim G. E., Anal. Chim. Acta 2006, 565, 121–128. [Google Scholar]
- 18. Pasch H., Polym. Adv. Technol. 2015, 26, 771–784. [Google Scholar]
- 19. Pasch H., Polym. Chem. 2013, 4, 2628. [Google Scholar]
- 20. Pasch H., Trathnigg B., HPLC of Polymers, Springer, 1999. [Google Scholar]
- 21. Kilz P., Radke W., Anal. Bioanal. Chem. 2015, 407, 193–215. [DOI] [PubMed] [Google Scholar]
- 22. Kim H., Ralph J., Akiyama T., BioEnergy Res. 2008, 1, 56–66. [Google Scholar]
- 23. Ralph J., Landucci L. L. in Lignins Lignans—Advances in Chemistry (Eds.: C. Heitner, D. Dimmel, J. Schmidt), Taylor & Francis Group, LCC, Boca Raton, FL, 2010, pp. 137–244. [Google Scholar]
- 24. Constant S., Wienk H. L. J., Frissen A. E., De Peinder P., Boelens R., Van Es D. S., Grisel R. J. H., Weckhuysen B. M., Huijgen W. J. J., Gosselink R. J. A., Bruijnincx P. C. A., Green Chem. 2016, 18, 2651–2665. [Google Scholar]
- 25. Sarkanen K., Hergert H. in Lignins—Occurrence, Formation, Structure and Reactions (Eds.: K. Sarkanen, C. Ludwig), Wiley, New York, 1971, pp. 43–95. [Google Scholar]
- 26. Ralph J., Lapierre C., Boerjan W., Curr. Opin. Biotechnol. 2019, 56, 240–249. [DOI] [PubMed] [Google Scholar]
- 27. Vanholme R., De Meester B., Ralph J., Boerjan W., Curr. Opin. Biotechnol. 2019, 56, 230–239. [DOI] [PubMed] [Google Scholar]
- 28. Duval A., Molina-Boisseau S., Chirat C., Holzforschung 2015, 69, 127–134. [Google Scholar]
- 29. Yang D., Li H., Qin Y., Zhong R., Bai M., Qiu X. Q., J. Dispersion Sci. Technol. 2015, 36, 532–539. [Google Scholar]
- 30. Yang D., Qiu X., Pang Y., Zhou M., J. Dispersion Sci. Technol. 2008, 29, 1296–1303. [Google Scholar]
- 31. Korntner P., Sumerskii I., Bacher M., Rosenau T., Potthast A., Holzforschung 2015, 69, 807–814. [Google Scholar]
- 32. Li B., Ouyang X., Adv. Mater. Res. 2012, 554–556, 2024–2030. [Google Scholar]
- 33. Sumerskii I., Korntner P., Zinovyev G., Rosenau T., Potthast A., RSC Adv. 2015, 5, 92732–92742. [Google Scholar]
- 34. Zinovyev G., Sulaeva I., Podzimek S., Rössner D., Kilpeläinen I., Sumerskii I., Rosenau T., Potthast A., ChemSusChem 2018, 11, 3259–3268. [DOI] [PMC free article] [PubMed] [Google Scholar]
- 35. Sumerskii I., Zweckmair T., Hettegger H., Zinovyev G., Bacher M., Rosenau T., Potthast A., RSC Adv. 2017, 7, 22974–22982. [Google Scholar]
- 36. Ma T. S. in Analytical Instrumentation Handbook (Ed.: G. W. Erwing), Taylor & Francis, 1997. [Google Scholar]
- 37.A. Sundberg, K. Sundberg, C. Lillandt, B. Holmbom, Nord. Pulp Pap. Res. J 1996, 11, 216–219.
Associated Data
This section collects any data citations, data availability statements, or supplementary materials included in this article.
Supplementary Materials
As a service to our authors and readers, this journal provides supporting information supplied by the authors. Such materials are peer reviewed and may be re‐organized for online delivery, but are not copy‐edited or typeset. Technical support issues arising from supporting information (other than missing files) should be addressed to the authors.
Supplementary