Abstract
The Shape, Elongation, Division, and Sporulation (“SEDS”) proteins are a highly conserved family of transmembrane glycosyltransferases that work in concert with class B penicillin binding proteins (bPBPs) to build the bacterial peptidoglycan cell wall1–6. How these proteins coordinate polymerization of new glycan strands with their crosslinking to the existing peptidoglycan meshwork remains unclear. Here, we report the crystal structure of the prototypical SEDS protein RodA from Thermus thermophilus in complex with its cognate bPBP at 3.3 Å resolution. The structure reveals a 1:1 stoichiometric complex with two extensive interaction interfaces between the proteins: one in the membrane plane and the other at the extracytoplasmic surface. When in complex with a bPBP, RodA shows a ~10 Å shift of transmembrane helix 7 that exposes a large membrane-accessible cavity. Negative-stain electron microscopy reveals that the complex can adopt a variety of different conformations. These data define the bPBP pedestal domain as the key allosteric activator of RodA both in vitro and in vivo, explaining how a SEDS:bPBP complex can coordinate its dual enzymatic activities of peptidoglycan polymerization and crosslinking to build the cell wall.
The peptidoglycan (PG) cell wall defines bacterial cell shape and maintains cellular integrity. Inhibiting the synthesis of the cell wall is among the most effective strategies for treating bacterial infections7,8. PG biogenesis begins inside the cell on the inner leaflet of the plasma membrane, where the lipid-linked disaccharide-pentapeptide precursor molecule lipid II is synthesized and then translocated to the extracellular membrane surface by the flippase MurJ9,10. Synthesis of PG from lipid II requires two enzymatic activities. First, peptidoglycan glycosyltransferase (GTase) enzymes polymerize long glycan strands from the disaccharide headgroup of lipid II. Second, polymerized glycans are crosslinked into the existing cell wall through their peptides by transpeptidase (TPase) enzymes. The class A penicillin binding proteins (aPBPs) contain both the GTase and TPase domains in a single polypeptide and for many years these and related monofunctional enzymes were the only known cell wall polymerases. However, it has recently been shown that integral membrane proteins of the SEDS family comprise a second class of peptidoglycan polymerases capable of working in concert with bPBPs to both polymerize and crosslink PG. Thus, the SEDS:bPBP complex constitutes a peptidoglycan synthase machine that recapitulates the bifunctionality of aPBPs in two separate polypeptides1–3,11,12 (Figure 1a). SEDS/bPBP systems are more widely conserved than the aPBPs, although commonly both systems are present and function in parallel to facilitate cell wall synthesis1,9. In view of its essential role in PG biogenesis, the SEDS:bPBP complex is an attractive target for novel therapeutic design to combat the rise of antibiotic resistance in pathogenic bacteria.
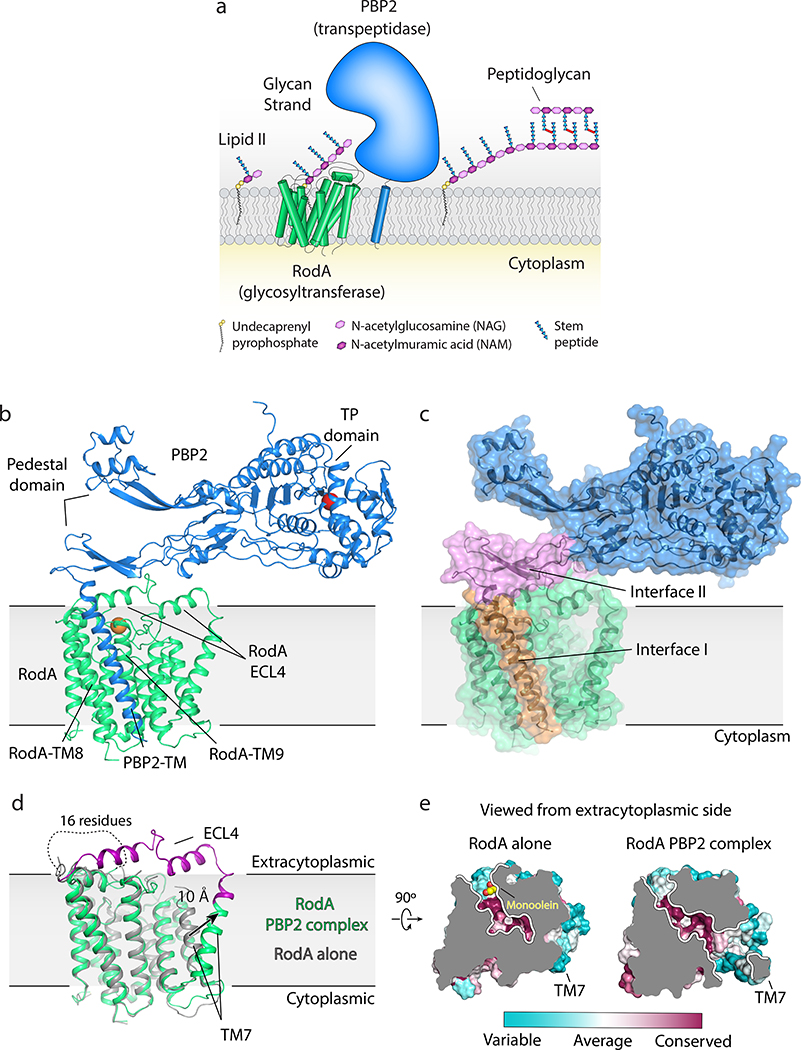
Figure 1 |. Crystal structure of Thermus thermophilus RodA:PBP2 peptidoglycan synthase complex.
a, RodA polymerizes glycans strands from lipid II precursor molecules and PBP2 crosslinks the newly formed glycans to the existing peptidoglycan cell wall. b, Structure of RodA:PBP2 complex viewed parallel to the membrane plane. The active site residue (Ser308) in the TP domain of PBP2 and Asp255 in RodA are shown as red and orange spheres, respectively. A short peptide that was modeled in the pedestal domain was removed for clarity. c, Surface view showing two distinct interfaces. Interface I (orange) is within the membrane plane, while interface II (pink) lies above the membrane. d, Comparison of the structure of RodA in isolation (PDB code: 6BAR; grey) and RodA in complex with PBP2 (green). Newly resolved residues in extracellular loop 4 (ECL4) of RodA in the PBP2 complex are highlighted in purple. e, Top down surface view cross-section of the highly conserved membrane-accessible cavities in both RodA stuctures.
Previously, we solved the structure of the prototypical SEDS protein family member RodA from Thermus thermophilus and predicted the interface between TtRodA and its cognate bPBP (TtPBP2) using evolutionary coupling analysis13. These data in combination with recent genetic and biochemical studies11,12 strongly indicate that RodA and PBP2 function as a complex in vivo. To better understand how these two proteins work together we sought to characterize their interaction in molecular detail through a combination of biochemical and crystallographic methods.
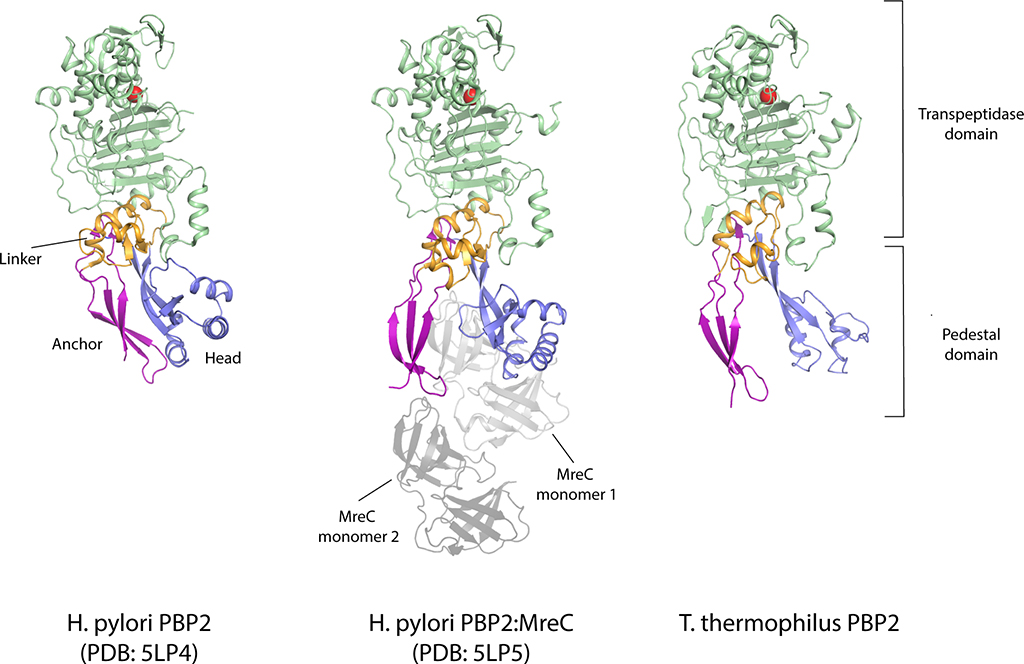
RodA and PBP2 from Thermus thermophilus were co-expressed and purified, resulting in a stoichiometric complex (Supplementary Figure 1). The complex was then crystallized by the lipidic cubic phase method (Supplementary Figure 114) and X-ray diffraction datasets were collected to resolutions of 3.5 Å and 3.3 Å for a wild-type complex and a catalytically inactive RodAD255A variant complex treated with ampicillin, respectively (Supplementary Table 1). The structures of the complex with wild-type RodA and the D255A variant were virtually identical, so we focus here on the modestly higher resolution RodAD255A:PBP2 structure. The TtRodA:PBP2 complex adopts a surprisingly compact conformation where RodA and the TM segment of PBP2 lie within the membrane plane, while the pedestal domain of PBP2 sits on top of the extracytoplasmic loops of RodA (Figure 1b). The structure of the TtPBP2 ectodomain shares the same overall domain architecture as the PBP2 proteins of H. pylori and E. coli (Supplementary Figure 2 and 3)15,16. The N-terminal transmembrane domain is connected by a short hinge region to the pedestal domain, which is formed by two subdomains—the anchor subdomain and the head subdomain. The anchor is composed of a small β-sheet formed by the β1 strand and the β8–β9 hairpin and is connected to the hinge region by an extensive network of hydrogen bonds and salt bridges (Supplementary Figure 2). This is followed by the head domain, which is composed of a small discontinuous β-sheet, with four interspersed α-helices that form the remainder of the head subdomain, as well as the linker subdomain that connects the pedestal and transpeptidase domains. The C-terminal transpeptidase domain possesses the common penicillin-binding protein fold, a core β-sheet surrounded by α-helices, and lies just above the membrane plane, positioned ~80 Å away from central core of RodA. Although the structure of each subdomain is well-conserved between T. thermophilus and the PBP2 proteins of other species, the relative orientation of these domains differs in each of the determined structures (Supplementary Figure 2).
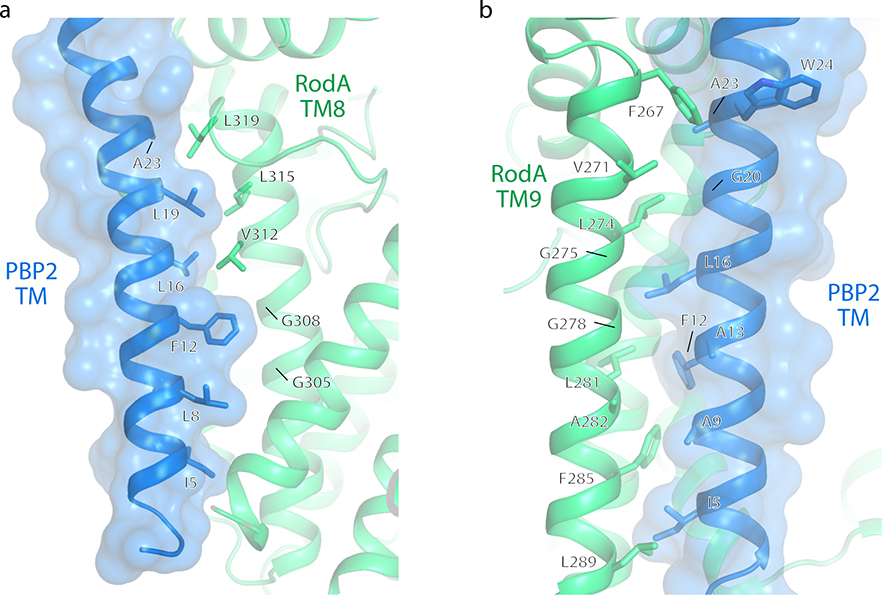
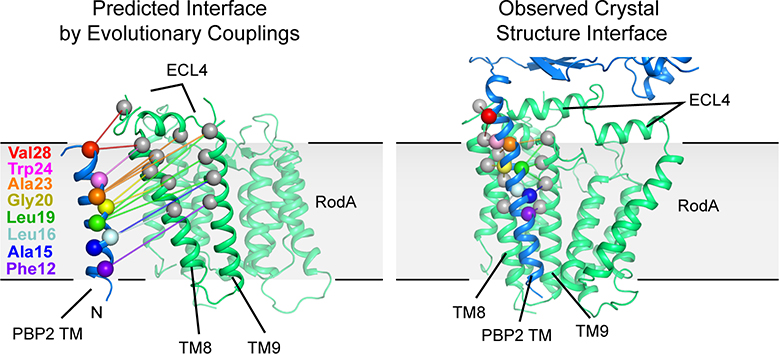
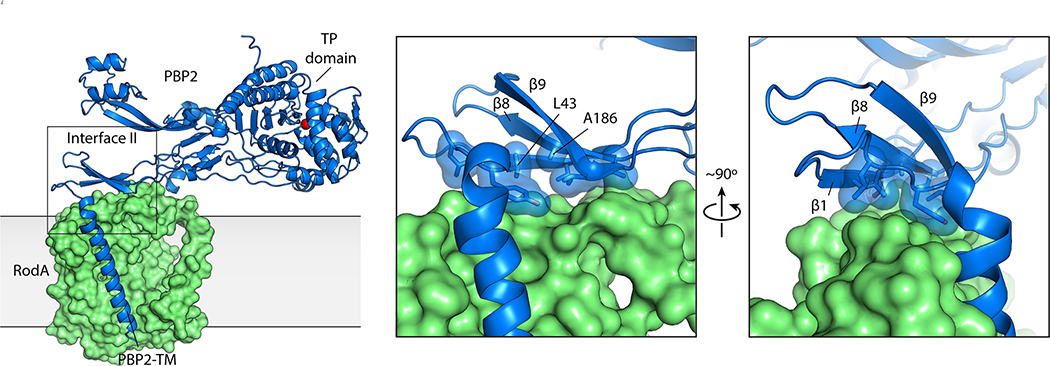
There are two main inter-protein interfaces in the RodA:PBP2 complex structure (Figure 1c). The first lies within the membrane plane where the transmembrane domain of PBP2 packs tighty against TM8 and TM9 of RodA. This interface is almost entirely hydrophobic and seems to be driven by steric compatibility (Extended Data Figure 1)17. It agrees well with our previously predicted interaction interface13 (Extended Data Figure 2) as well as predictions of the E. coli FtsW:FtsI interface by others12,18, both of which were identified using evolution sequence covariation methods19. A second interface lies above the membrane plane and is exposed to the extracytoplasmic environment where a three-stranded β-sheet within the pedestal domain of PBP2 (residues Glu30-Ala50 and Lys181-Thr205) as well as a small helical loop (residues Asn151-Ser160) lie on top of RodA’s extracellular loop (ECL) 4 (residues Pro189-Gly232) which was partially disordered in the previously determined structure of RodA13. The previously unresolved residues form two α-helices connected by a short ordered loop (Figure 1d), albeit with elevated B-factors relative to the overall complex suggesting it is either conformationally heterogeneous or mobile. The density for the remaining 16 residues (Leu233-Phe248) was too poor to model, suggesting that these residues are still partially disordered in the crystal. The majority of contacts at interface II are between α-helix 10 in RodA ECL4 and the pedestal domain of PBP2 (Extended Data Figure 3). However, very few specific interactions are present in this interface, suggesting that interface I provides the majority of energy required for binding of RodA and PBP2.
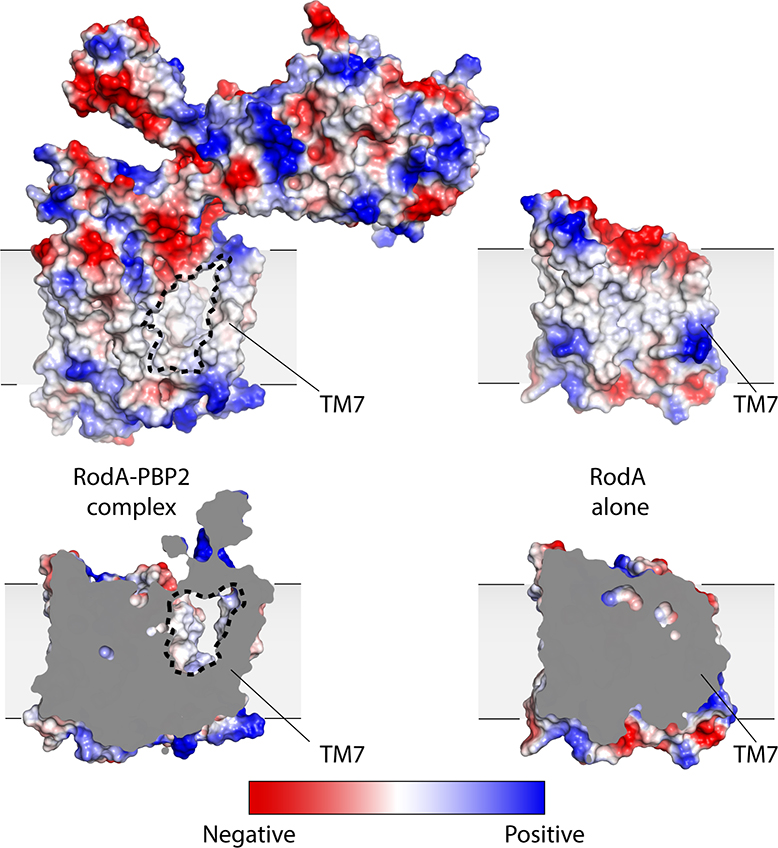
The overall structure of RodA in the complex remains largely unchanged from the structure of RodA in isolation (Cα RMSD of 0.5 Å; PDB code 6BAR) with the exception of a very large outward deflection of TM7 by ~10 Å. TM7 directly precedes ECL4, and in the more ordered configuration adopted in the presence of PBP2 the N-terminal portion of ECL4 is oriented away from the core of RodA and appears to drag the C-terminal region of TM7 outward, resulting in an observed tilt of TM7 by approximately 20°. Intriguingly, the shift in TM7 exposes a large membrane-acessible cavity that was occluded in the structure of RodA alone (Figure 1e and Extended Data Figure 4). This cavity is ~15 Å wide by ~30 Å tall and is large enough to accommodate a lipid II molecule and therefore could be a substrate entry or exit site.
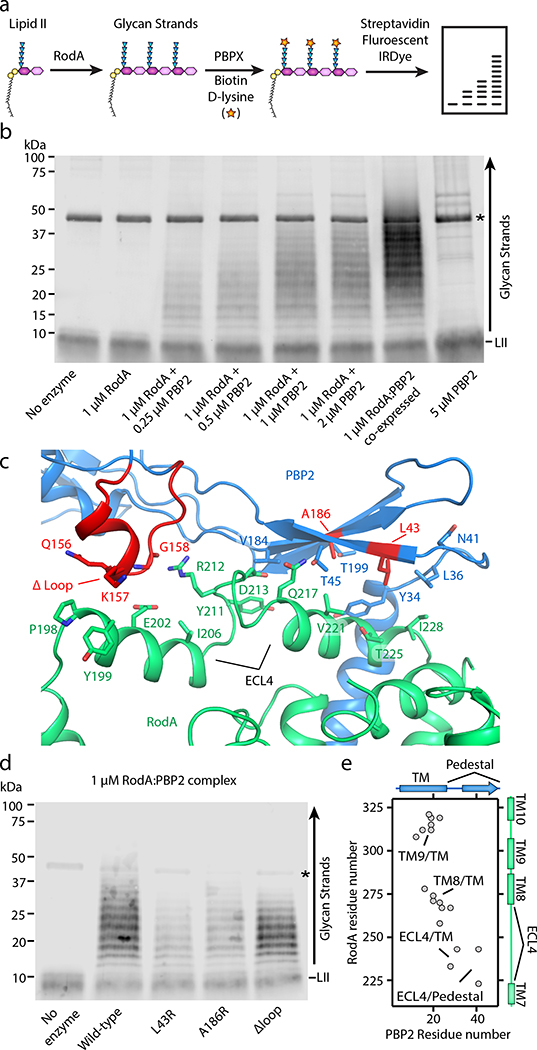
Previous studies on SED:bPBP complexes in E. coli and S. thermophilus have shown that bPBPs allosterically stimulate SEDS GTase activity in vitro11,12. We therefore tested whether T. thermophilus PBP2 could also activate RodA. Indeed, PG polymers were produced only when both RodA and PBP2 were present in the reaction, and there was no detectable GT activity by either RodA or PBP2 alone (Figure 2a–b). Moreover, the GT activity of RodA increased as sub-stoichiometric amounts of PBP2 were added and reached a plateau upon addition of an equimolar amount of PBP2, in agreement with the 1:1 stoichiometry observed in the crystal structure. The RodA-PBP2 extracytoplasmic interface II seen in our structure includes a large portion of ECL4 of RodA, which was disordered in the structure of RodA alone13. Since ECL4 is known to contain residues that are essential for the function of RodA1, including residues equivalent to Gln200 and Asp255, we hypothesized that the pedestal domain of PBP2 might function in allosteric activation of RodA in part by stabilizing a catalytically competent conformation of ECL4. This would serve to license PG polymerization only when a bPBP is present to crosslink resulting glycan strands, thereby avoiding futile consumption of lipid II20.
Figure 2 |. PBP2 activates RodA GT activity through its pedestal domain.
a, Graphical representation of polyacrylamide gel-based assay to detect RodA GT activity in vitro. The terminal residues in the stem peptide of the polymerized glycan strands and the lipid II percursor are exchanged with biotin-D-lysine via E. faecalis PBPX transpeptidase enzyme, transferred to a PVDF membrane, and then detected by fluorescently labeled streptadivin (Streptavidin-IRDye-800CW). b, RodA polymerizes lipid II only in the presence of PBP2. Asterisk represents the PBPX biotinylating enzyme. Note that complexes purified following co-expression are more active than when they are reconsitituted from individual preparations. Representative image of 1 of 3 experiments. c, Close up view of RodA-PBP2 extracytoplasmic interface II. Amino-acid substitutions are indicated in red. d, Substitutions in the PBP2 pedestal domain impair RodA GT activity in vitro. Representative image of 1 of 2 experiements. e, Evolutionary covariation map showing 19 evolutionary couplings between RodA and PBP2, generated from previously published data13.
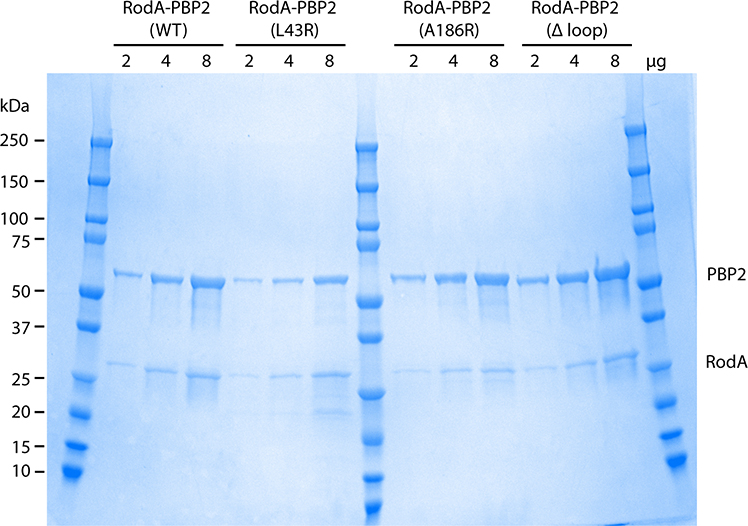
To test this hypothesis, we introduced amino-acid substitutions in the PBP2 pedestal domain at the interface with RodA ECL4 and tested their effect on wild-type RodA GT activity in vitro (Figure 2c). We sought to disrupt this interface by mutating hydrophobic residues on β1 and β6 of PBP2 to arginine in order to introduce a bulky, charged side chain in the center of this binding interface (Extended Data Figure 3). As shown in Figure 2d, GT activity was reduced when an arginine residue was introduced at residue Leu43 or Ala186 within the PBP2 pedestal domain (PBP2L43R and PBP2A186R). These PBP2 variants still efficiently co-purified with RodA (Extended Data Figure 5), suggesting that while they can still form a complex with RodA they are imparied in their ability to promote its GT activity. Interestingly, RodA GT activity was largely maintained when residues Ala150-Pro161 were deleted from PBP2 (PBP2Δloop), indicating that this region does not play a significat role in activating RodA or stimulating RodA activity. This result is not entirely surprising as the evolutionary couplings between RodA and PBP2 were mainly localized to PBP2’s TM and the N-terminal region of the pedestal domain (Figure 2e13), indicating that these regions are subject to stronger evolutionary selection pressure than the Ala150-Pro161 loop. Taken together with the evolutionary couplings, our results suggest that the PBP2 pedestal domain is critical for stimulating RodA GT activity. This is consistent with previous data that has suggested a similar role for the pedestal domain of PBP2a of S. aureus, suggesting that this may be a common feature of class B PBPs21.
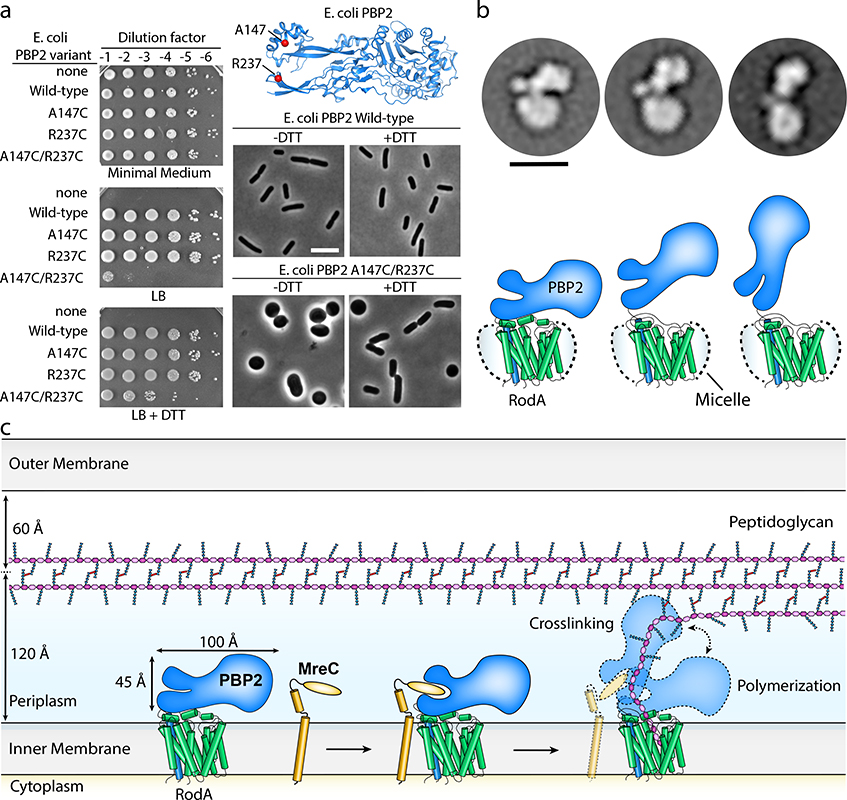
In view of the importance of the PBP2 pedestal domain, it is interesting to note that this region is also important for interactions with another Rod system protein, MreC, which is essential in vivo. Although the effect of MreC in vitro has not yet been measured, mutations in MreC can be rescued by compensatory mutations in either RodA or PBP211. Interestingly, these same mutations of RodA-PBP2 display higher GTase activity than wild-type controls, suggesting that MreC functions normally by stimulating RodA GTase activity. This protein may promote RodA GT activity through interactions with the pedestal domain of PBP211. In our structure of the RodA:PBP2 complex, the pedestal domain of PBP2 adopts an open V-shaped architecture reminiscent of MreC-bound PBP216 (Extended Data Figure 6). To test if pedestal domain opening is important for RodA activity in vivo, we introduced two cysteine substitutions in PBP2 that could form a disulfide bond if the pedestal adopts a closed conformation similar to the one observed in the H. pylori PBP2 structure without MreC16. For these studies, we utilized the E. coli PBP2 (EcPBP2) so that the effects of these variants could be measured in vivo. As described above (Supplementary Figure 2), the structure of the T. thermophilus PBP2 is highly similar to the PBP2 of both E. coli and H. pylori, indicating that structural features observed in T. thermophilus are likely to translate well to other organisms. At the time, the structure of E. coli PBP2 had not yet been published and the H. pylori PBP2 structure was used to design these variants.
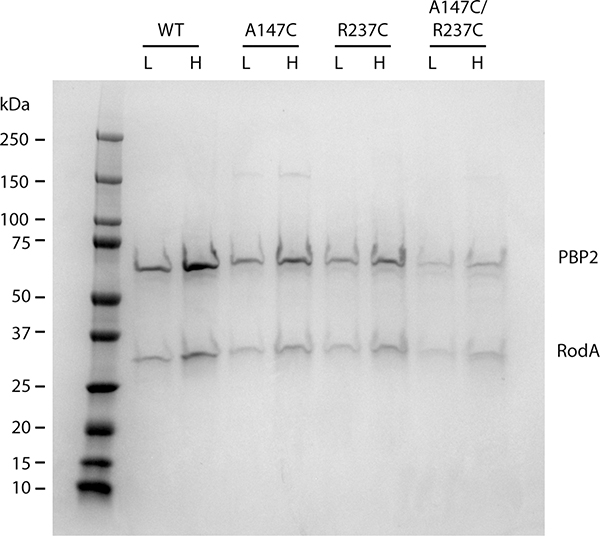
E. coli cells in which the pbpA-rodA locus had been deleted were transformed with vectors encoding RodA and different variants of PBP2. These cells were capable of growth on minimal media, on which the Rod system is not required, but could only grow on LB media when RodA and PBP2 were complemented, consistent with the long-standing observation that the Rod system is required for growth on LB (Figure 3a). Strains harboring the double cysteine substitution (EcPBP2A147C/R237C) were impaired in their ability to grow on LB and displayed severe morphological defects. Quantification of the cell morphologies revealed a significantly different aspect ratio for wild-type and EcPBP2A147C/R237C cells (3.58 ± 0.77 and 1.47 ± 0.58, respectively for n = 650 cells). These effects were partially rescued upon addition of the reducing agent DTT to the growth medium, with a corresponding increase in aspect ratio only for the mutant cells (3.38 ± 0.83 and 2.54 ± 1.2, for wild-type and mutant cells, respectively, in the presence of DTT n = 650). Importantly, these PBP2 variants retained the ability to co-purify RodA, indicating that these defects are not the result of reduced binding to RodA (Extended Data Figure 7). Given that similar disulfide locking of H. pylori PBP2 reduces binding to MreC in vitro16, it seems likely that the effect we observe is the result of reduced interaction with MreC. Taken together, our results indicate that the pedestal domain is important for proper function of the cell elongation machinery formed by RodA-PBP2 and its partners both in vitro and in vivo.
Figure 3 |. RodA:PBP2 complex adopts a broad range of conformations to facilitate cell wall synthesis.
a, Locking PBP2’s pedestal domain is lethal in E. coli. The top right panel shows the E. coli PBP2 structure15 (PDB code: 6G9P) highlighting the cysteine substitutions as red spheres. Overnight cultures of the E. coli strains in which PBP2-RodA had been deleted and complemented with a plasmid encoding RodA without PBP2 (“none”) or RodA with the PBP2 variants listed were serially diluted and spotted on either M9 Minimal Medium agar (Rod non-essential) or LB agar (Rod essential) in the presence or absence of 10 mM DTT (left panel). The bottom right panels show micrographs of E. coli cells inactivated for native PBP2 expressing either PBP2 (WT) or the cysteine variant from a plasmid. Scale bar, 5 μm. Results shown are derived from one experiment with n = 650 cells analyzed per group but are representative of two experiments. b, Representative negative-stain electron microscopy 2D class averages of RodA-PBP2 complex (top panel) depicting different conformations, which are schematically represented in the bottom panel. The images were collected on a Tecnai-T12 microscope and the resulting class averages were calculated from a total of 32,152 particles. Scale bar represents 10 nm. c, Model of RodA:PBP2-mediated peptidoglycan cell wall synthesis. The dimensions of the RodA:PBP2 complex structure are shown in relation to the Gram-negative bacterial cell envelope.
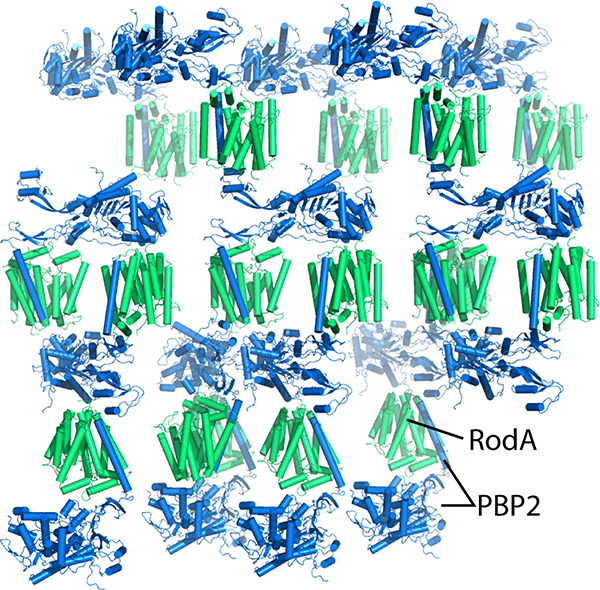
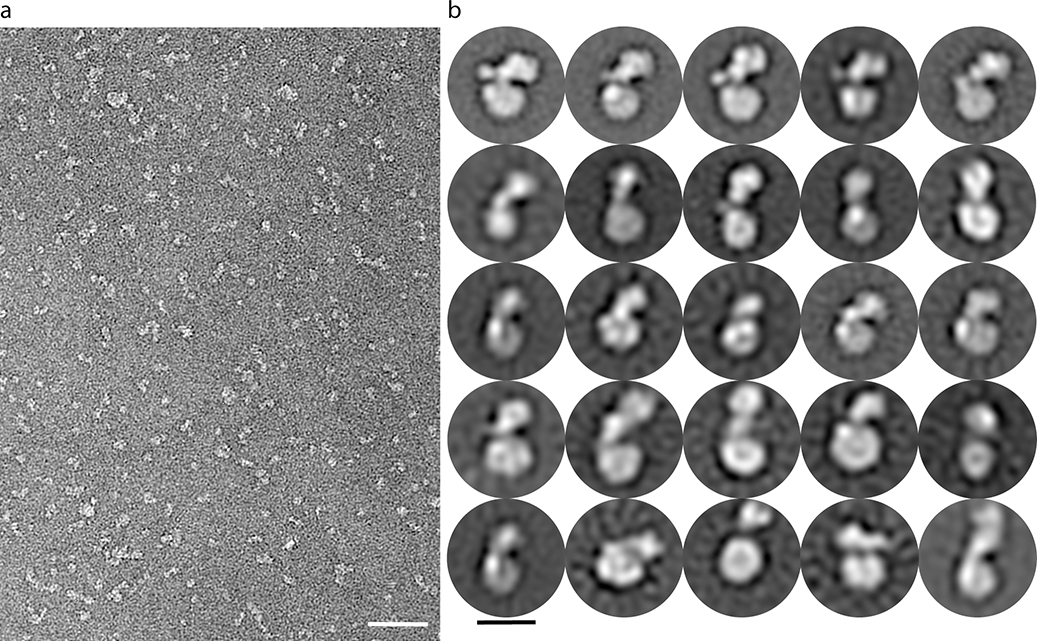
In addition to the extensive interactions between RodA and the PBP2 pedestal domain, a second surprising feature of the structure is the compact architecture of the complex, which extends only ~45 Å above the membrane plane (Figure 3b–c). It is estimated that the peptidogylcan layer lies approximately 120 Å above the inner membrane in Gram-negative bacteria7, raising the question of how the bPBP can reach the existing PG mesh to crosslink newly synthesized glycan strands to it. Since the relative orientations of RodA and PBP2 could be influenced by crystal packing effects (Extended Data Figure 8), we used negative-stain electron microscopy to investigate the complex in the absence of crystallographic constraints. The resulting 2D class averages indicate that the RodA:PBP2 complex can adopt a range of conformations, including compact configurations similar to that seen in the crystal structure as well as more open, extended conformations (Figure 3b; Extended Data Figure 9). In the extended conformation PBP2 may be able to reach ~100 Å above the membrane plane, positioning its active site near the existing peptidoglycan layer.
Genetic and biochemical studies on SEDS and bPBPs have suggested that these two proteins form a functional synthase that can both polymerize and crosslink peptidoglycan to form the bacterial cell wall1–3,11–13,22,23. The RodA:PBP2 crystal structure and negative-stain EM analysis now provide molecular views of this complex, showing how SEDS proteins and bPBPs work together. In bacteria, this complex must be tightly regulated, as inactivation of PBPs by β-lactams and/or of SEDS PG activity leads to un-crosslinked glycan strands that result in a toxic cycle of PG synthesis and degradation in Gram-negative bacteria20. Our data define the bPBP pedestal domain as a central allosteric hub to regulate and coordinate PG polymerization and crosslinking activities (Figure 3c). By adopting both extended and compact conformations we suggest that the bPBP can either promote PG polymerization via allosteric modulation of RodA or favor crosslinking of newly synthesized PG by positioning the TPase domain in proximity to the existing cell wall. The equilibrium between extended and compact conformations may be influenced by MreC or other proteins in the elongasome complex. Although its exact role remains incompletely defined, it seems likely that MreC serves as an additional regulator that structurally communicates with other Rod system proteins including MreD, RodZ, and the cytoskeletal protein, MreB, to ensure that PG synthesis occurs only at the right time and location during growth of rod-shaped bacterial cells. Future work is necessary to decipher additional layers of regulation that allow tight spatiotemporal control of PG synthesis. The structure of the RodA:PBP2 complex provides a molecular view of how such regulation can be achieved, and will facilitate detailed understanding of PG synthesis and its regulation.
Methods
Protein expression and purification
The expression plasmids for Thermus thermophilus RodA and PBP2 (pMS235, pMS239, pMS292, pMS293, and pMS294) were transformed into E. coli C43 derivative of BL21 (DE3) harboring an arabinose-inducible Ulp1 protease plasmid (pAM174) under the selection for both plasmids. Ten fresh transformants from each were inoculated into 5 mL Terrific Broth (TB), medium supplemented with 35 μg mL−1 chloramphenicol and 50 μg mL−1 kanamycin and allowed to grow overnight at 37˚C in a rolling shaker. The 5 mL overnight culture was then diluted in 1 L of TB supplemented with 0.1% glucose, 2 mM MgCl2, 50 μg mL−1 kanamycin, and 35 μg mL−1 chloramphenicol. Cultures were grown at 37˚C until an OD600 of 0.6 and allowed to cool down to 20˚C. At an OD600 of ~0.8, protein expression was induced by addition of IPTG (1 mM final) and arabinose (0.2% final) for PBP2/RodA and ULP1, respectively. After a 16 h induction, cells were harvested and frozen at −80˚C. The same procedure was performed for TtRodA alone (pMS211) except 100 μg mL−1 ampicillin was used instead of kanamycin. Expression of the E. coli PBP2-RodA complex was performed using the same method, except that expression was carried out using the CAM333 strain of the E. coli C43 derivative of BL21(DE3)1.
Cells were thawed and resuspended in lysis buffer (50 mM HEPES pH 7.5, 150 mM NaCl, 20 mM MgCl2, 1:100,000 (v:v) benzonase nuclease), lysed by sonication, and membranes were collected by ultracentrifugation at 50,000×g for 1 h at 4°C. Co-expressed FLAG-3C-RodA and PBP2–3C-PrtC were extracted using a glass dounce tissue grinder in a solubilization buffer containing 20 mM HEPES pH 7.5, 500 mM NaCl, 20% (v/v) glycerol, and 1% (w/v) n-Dodecyl β-D-maltoside (DDM; Anatrace). Samples were stirred for 2 h at 4°C, then centrifuged as before for 1 h. The supernatant containing solubilized FLAG-3C-RodA and PBP2–3C-PrtC was supplemented with 2 mM CaCl2 and loaded by gravity flow onto 5 mL anti-FLAG antibody affinity resin. The resin was washed extensively with 20x column volumes of buffer containing 20 mM HEPES pH 7.0, 500 mM NaCl, 20% glycerol, 0.1% DDM. The protein complex was eluted by the addition of 5 mM EDTA and 0.2 mg ml−1 Flag peptide. PBP2-PrtC coeluted with FLAG-RodA as analyzed by SDS-PAGE. A similar procedure was performed for RodA in isolation (pMS211). For purification of PBP2 in isolation (pMS235), the same procedure was performed except the solubilized fraction was loaded onto 6 mL anti-Protein C antibody affinity resin, pre-equilibrated with 20 mM HEPES pH 7.0, 500 mM NaCl, 20% glycerol, 0.1% DDM, washed as above, and then eluted with addition of 5 mM EDTA and 0.2 mg ml−1 Protein C peptide. Each sample was further purified by size exclusion chromatography (SEC) on a Sephadex S200 column (GE Healthcare) in buffer containing 20 mM HEPES pH 7.5, 500 mM NaCl, and 0.1% DDM. After preparative SEC, proteins to be subjected to crystallization trials were concentrated to 40–60 mg ml−1 using a Vivaspin centrifugal concentrator with a 100 kDa molecular weight cut off (Viva Products) and flash frozen with liquid nitrogen in aliquots of 8 μl. For enzymatic assays and electron microscopy experiments, proteins were frozen at 1–2 mg ml−1 and flash frozen with liquid nitrogen in aliquots of 2 μl. Samples were stored at −80°C until use for crystallography, electron microscopy, or enzymatic assays. Purity and monodispersity of each sample were evaluated by SDS–PAGE and analytical SEC, respectively.
Expression of His-tagged E. faealis PBPX was performed as stated above and purification was performed as previously described24. Briefly, cells were harvested by centrifugation and the pellet suspended in 50 mL lysis buffer (20 mM Tris pH 7.5, 20 mM MgCl2, 400 mM NaCl) supplemented with 1 mM phenylmethylsulfonylfluoride (PMSF), and 1:100,000 (v:v) benzonase nuclease). Cells were lysed by sonication and the cell lysate was pelleted by centrifugation at 50,000×g for 45 min at 4°C. The resulting supernatant was supplemented with 10 mM imidazole, added to 3 mL Ni-sepharose Excel resin (GE Healthcare) equilibrated with 20 mM Tris pH 7.5, 400 mM NaCl, 10 mM imidazole. After loading the gravity column, the resin was washed with 20x column volumes wash buffer (20 mM Tris pH 7.5, 400 mM NaCl, 20 mM imidazole). The protein was eluted in 20 mL of elution buffer (20 mM Tris pH 7.5, 400 mM NaCl, 200 mM imidazole), concentrated to ~2 mL and dialyzed against 4 L of 20 mM Tris pH 7.5, 400 mM NaCl overnight at 4°C. The purity was evaluated by SDS–PAGE and the protein was aliquoted, flash frozen in liquid nitrogen, and stored at −80°C.
Crystallography and data collection
Purified T. thermophilus wild-type RodA:PBP2 and RodAD255A:PBP2 complexes in which tags had not been removed were diluted to a concentration of 35 mg ml−1 and reconstituted into lipidic cubic phase by mixing monoolein (Hampton Research) using the coupled syringe reconstitution method25. All samples were mixed at least 100 times prior to dispensing. The resulting phase was dispensed in 30 – 40 nL drops onto a glass plate and overlaid with 650 nL of precipitant solution using a Gryphon LCP robot (Art Robbins Instruments). Crystals for wild-type RodA:PBP2 complex grew in precipitant solution containing 40–50% PEG 300, 100 mM lithium sulfate, and 100 mM MES pH 5.7–6.4. The RodAD255A:PBP2 complex was incubated with 5 mM ampicillin for one hour on ice prior to reconstitution and crystals grew in precipitant solution containing 35 – 45% PEG 300, 100 mM sodium sulfate, and 100 mM MES pH 5.8–6.8, and 10 mM strontium chloride. Initial crystallization hits grew within 24 h, with diffraction-quality crystals reaching full size over the course of 1–4 weeks. Crystals were harvested using mesh loops and stored in liquid nitrogen until data collection. Data collection was carried out at Advanced Photon Source GM/CA beamline 23ID-B and 23ID-D. An initial grid raster with 80 μm × 30 μm beam dimensions was performed to locate crystals within the loop. Additional fine-tuning rasters were performed using a 10 μm beam diameter to optimize the position of the crystal for data collection. Data were collected using a 10 μm beam and 0.2° oscillation per frame at a wavelength of 1.033 Å and a 5-fold attenuation factor for beamline 23ID-B and no attenuation for 23ID-D. For wild-type RodA:PBP2 and RodAD255A:PBP2 complex, a complete data set was obtained from two and five crystals, respectively. Diffraction data were indexed and processed using XDS26. Both wild-type RodA:PBP2 and RodAD255A:PBP2 complex crystallized in the P3221 space group with one molecule in the asymmetric unit with a solvent content of approximately 75%.
Phasing and refinement
The structure of T. thermophilus RodA (PDB code: 6BAR) was used as a single search template for molecular replacement in Phaser27. The top scoring solution (as judged by both TF-Z and LLG metrics) was used as a fixed partial solution for a second round of molecular replacement that used the transpeptidase domain (residues Ala137-Leu487) of M. tuberculosis PBPA28 (PDB code: 3LO7) as a search model for PBP2. The final model was solved by manual building using COOT29 and reciprocal space refinement using phenix.refine30. The RodA-PBP2 crystals for both wild type and D255A displayed diffraction anisotropy. For the D255A dataset, two of the three principal axes diffracted to 3.3 Å and the other diffracted to 2.8 Å. For the WT dataset, two axes diffracted to 3.5 Å and the other diffracted to 3.1 Å. The Diffraction Anisotropy Server31 was used to perform ellipsoidal truncation, followed by anisotropic scaling and isotropic B-factor correction. Attempts were made to use the corrected structure factors during initial model building, however the electron density maps were of similar quality compared to the non-scaled datasets, so we chose to use the original dataset (i.e. without ellipsoidal truncation) during refinement.
Verification of sequence register for the TM portion of PBP2 was straightforward and unambiguous due to the frequency of bulky amino acid side chains and available evolutionary coupling data13. The 2Fo−Fc electron density map is shown in Extended Data Figure 10. The structure of RodAD255A:PBP2 complex was solved using wild-type RodA:PBP2 complex as the molecular replacement search model and the resulting refined structure is nearly identical to that of wild-type RodA (0.13 Å RSMD between all Cα atoms). In both wild-type and D255A datasets, an ambiguous density was observed between the anchor and head region of the pedestal domain of PBP2. This region was modeled as a poly-alanine peptide and may reflect a trace amount of MreC or a different peptide fragment from E. coli that co-purified with the complex. The B-factors for the complex were the lowest in the transpepidase domain of PBP2 and at the interface between the TM portion of PBP2 and TM8 and TM9 of RodA. The highest B-factors were observed for TM7 and ECL4 of RodA. After refinement, the quality of both structures was assessed using MolProbity32 to calculate Ramachandran statistics and other parameters. In the wild-type RodA:PBP2 structure, 93.7% of residues were in Ramachandran-favored regions and 6.4% were in Ramachandran-allowed regions. For the RodA (D255A):PBP2 structures, these values were 92.6% and 7.4%, respectively. No Ramachandran outliers were present in either structure. Figures were prepared in PyMOL33. All crystallographic data processing, refinement, and analysis software was compiled and supported by the SBGrid Consortium34. The sequence conservation analysis shown in Figure 1e was computed using the Consurf server35. Briefly, a multiple sequence alignment of T. thermophilus RodA to 150 of its closest homologs was calculated using the HHMER algorithm provided by the Consurf server. A similar analysis was performed with T. thermophilus PBP2. The resulting Consurf conservation scores were visualized using PyMOL. Conservation scores were divided into nine equally sized categories of conservation ranging from slowly evolving (i.e. conserved) to rapidly evolving (i.e. variable) sites. The coloring reflects the relative degree of conservation of each amino acid position.
Electron microscopy
For negative staining, 2.5 μl protein solution consisting of RodA:PBP2 complex at a concentration of 0.005 mg ml−1 in 0.01% DDM (w/v) was added to a glow-discharged carbon-coated copper grid (Electron Microscopy Science) and allowed to adsorb for 30 s. Grids were then washed twice with deionized water and stained twice with freshly prepared 1.5% (w/v) uranyl formate. Filter paper was applied to the grid to absorb residual liquid between each step. Samples were then allowed to dry for approximately 2 min. Images used to generate the 2D classes shown in Figure 3 were collected at room temperature using a Philips Tecnai T12 electron microscope equipped with an LaB6 filament and operated at 120 kV. Images were collected at a magnification of 67,000-fold, corresponding to a pixel size of 1.68 Å, and a defocus value of −1.5 μm on a Gatan 4K CCD camera using a low-dose collection procedure. Approximately 1000 particles were manually picked in Relion36, then an auto-picking routine picked the remaining particles for a total of 32,152. Two-dimensional class averages were calculated with Relion. Similar class averages were observed when calculated with EMAN237.
GT activity assay
For assessment of enzymatic activity, lipid II substrate was purified from E. faecalis as described24. Peptidoglycan polymerization reactions were adapted from previously described methods12,24,38. In brief, 1 μM purified T. thermophilus RodA:PBP2 complex or variants thereof were incubated with 20 μM lipid II in reaction buffer containing 50 mM Tris pH 7.5, 20 μM MnCl2, and 30% DMSO. All proteins were purified in 0.1% DDM, therefore the working concentration of DDM in the assay was 0.02%. All reactions were incubated at 25°C for 5–30 min and quenched by incubation at 98°C for 5 min. Peptidoglycan biotinylation of each reaction mixture was performed by addition of biotinylated d-lysine (2 mM, working concentration) and purified E. faecalis PBPX (10 μM, working concentration) followed by incubation at 25°C for 30 min. The biotinylation reaction was then quenched by addition of 11 μL 2x SDS loading dye. The samples were then loaded into a 4–20% gradient polyacrylamide gel and run at 180 V for 35 min. The products were transferred onto a PVDF membrane (BioRad) and fixed in 0.4% paraformaldehyde diluted in PBS for 30 min at room temperature. The membrane was blocked with SuperBlock TBS blocking buffer (Thermo Fisher Scientific) for 1 h at room temperature and the biotinylated products were detected by incubation with fluorescently tagged streptavidin (IRDye 800-CW streptavidin (Li-Cor Biosciences, 1:5,000 in SuperBlock)) for an additional 1 h at room temperature. Membranes were washed 3× 10 min with TBST (0.01% Tween 20) and then 2× 10 min washes in PBS. Blots were then visualized using an Odyssey CLx imaging system (LI-COR Biosciences).
E. coli strain construction
All plasmids were initially transformed into TB28 chemically competent cells and plated on LB medium supplemented with 25 μg/mL chloramphenicol. The pbpA rodA::aph mutation was then introduced by P1-mediated transduction, using FB38(λFB190)/pFB19439 as a donor. Transductants were selected on M9 minimal medium40 supplemented with 0.2% casamino acids, 0.2% glucose, and 50 μg/mL kanamycin.
E. coli spot titers
Overnight cultures of cells deleted for the pbpA-rodA locus [FB38], harboring vectors producing the indicated alleles of pbp-rodA from a Plac regulated plasmid [pRY47, pHC857, pPR148, pPR151, pPR152, and pPR190] were serially diluted and spotted on either M9 agar supplemented with 0.2% casamino acids and 0.2% glucose, LB agar containing 100 μM IPTG, or LB agar containing 100 μM IPTG and 10 mM DTT. Plates were incubated at 30°C for 16 h (LB) or 40 h (M9).
Microscopy
Overnight cultures of the above strains were diluted to OD600 of 0.05 in 3 mL of M9 medium supplemented with 0.2% casamino acids, 0.2% maltose, and 25 μM IPTG. Cells were grown at 30°C until the OD600 reached 0.2, at which point the cells were spotted onto filter discs placed on LB agar medium supplemented with 100 μM IPTG, with or without 10 mM DTT. After 6 hours growth at 30°C, cells were suspended in liquid LB medium, fixed, and imaged using phase contrast microscopy. Scale bar, 5 μm. Where indicated, cells were fixed in 2.6% formaldehyde with 0.04% glutaraldehyde at room temperature for 1 h, followed by storage at 4°C for 24 hours. Prior to imaging, cells were immobilized on 2% agarose pads and covered with #1.5 coverslips.
Imaging was performed on a Nikon Ti inverted microscope equipped with a 100x Plan Apo 1.4 NA phase contrast objective, Andor Zyla 4.2 sCMOS camera, and Nikon motorized stage. Acquisition software was NIS Elements 4.30. The purchase of this microscope was funded in part by grant S10 RR027344–01. Microscopy was performed with the support of Microscopy Resources on the North Quad (MicRoN) at Harvard Medical School. The ImageJ plugin MicrobeJ41 was used segment cells and measure cell dimensions. Statistical significance was determined using a two-way ANOVA followed by Tukey’s Multiple Comparisons Test.
Plasmid construction
pMS235 [ColA-PT7-TtPBP2–3C-PrtC] was generated in a two-piece isothermal assembly reaction with TtPBP2–3C-PrtC (amplified from T. thermophilus PBP2 gBlock (IDT) using primers oMS235f (5’-ATTTTGTTTAACTTTAATAAGGAGATATACCATGGGTACAGGCCGCATTCACGCC-3’) and oMS235r (5’-GCATTATGCGGCCGCAAGCTTTTATTTGCCATCAATCAGGCG-3’)) and pCOLADuet-1 (Novagen) digested with Nco1 and HindIII.
pMS239 [ColA-PT7-TtPBP2–3C-PrtC; PT7-His6-SUMO-Flag-3C-TtRodA] was generated in a two-piece isothermal assembly reaction with His6-SUMO-Flag-3C-TtRodA (amplified from pMS211) using oligonucleotide primers oMS239f (5’-CACGCGATCGCTGACGTCGGTACCCTCGAGATGCGTGGTTCTCACCACC-3’) and oMS239r (5’-GTTATTGCTCAGCGGTGGCAGCAGCCTAGGTTAGTCTTGGTAGCGGTCACGATGCACAAG-3’) and pMS235 digested with Xho1 and AvrII.
pMS244 [ColA-PT7-TtPBP2–3C-PrtC; PT7-His6-SUMO-Flag-3C-TtRodA(D255A)] was generated by site-directed mutagenesis on pMS239.
pMS292 [ColA-PT7-TtPBP2–3C-PrtC; PT7-His6-SUMO-Flag-3C-TtRodA(L43R)] was generated by site-directed mutagenesis on pMS239.
pMS293 [ColA-PT7-TtPBP2–3C-PrtC; PT7-His6-SUMO-Flag-3C-TtRodA(A186R)] was generated by site-directed mutagenesis on pMS239.
pMS294 [ColA-PT7-TtPBP2–3C-PrtC; PT7-His6-SUMO-Flag-3C-TtRodA(R149-GS-E162] was generated in a three-piece isothermal assembly reaction with PBP2 fragment 1 (amplified from pMS239 using oligonucleotide primers oMS235f and oMS294ar (5’- CCTCTTCAGATCCACGTAATACGTATCCCATAACAGGCCC-3’)) and PBP2 fragment 2 (amplified from pMS239 with oMS294bf (5’- CGTATTACGTGGATCTGAAGAGGAAGTGGGCCAGG-3’) and oMS235r) and pMS239 digested with Nco1 and HindIII.
pPR148 [colE1 cat lacIq Plac::pbpA(A147C)-rodA]
The QuikChange method (Stratagene) of site-directed mutagenesis was performed to introduce the pbpA(A147C) substitution into template pHC85720, using primer o147QC(GACCGAAGTACAAGTAGCTCGCTTTTGCGTCAATCAGTACCGTTTTCCGGGTGTCGAAG).
pPR151 [colE1 cat lacIq Plac::pbpA(R237C)-rodA]
The QuikChange method (Stratagene) of site-directed mutagenesis was performed to introduce the pbpA(R237C) substitution into template pHC857 20,using primer o237QC(GTTAACAACCGTGGGCGTGTTATTTGCCAGTTAAAAGAAGTACCACCGCAAGC).
pPR152 [colE1 cat lacIq Plac::pbpA(A147C/R237C)-rodA]
Primers o761 (CCCGCGAAATTAATACGACTCACTATAGGG), o147C_R (CTGATTGACGCAAAAGCGAGCTACTTGTACTTCGG), o147C_QC (GACCGAAGTACAAGTAGCTCGCTTTTGCGTCAATCAGTACCGTTTTCCGGGTGTCGAAG), and o1320 (TTAATGGTCCTCCGCTGCGG) were used to introduce the A147C substitution into the pPR151 (pbpA-R237C) template using overlap-extension PCR. The product was PCR purified, digested with XbaI/KpnI, and cloned into similarly digested pHC85720.
pPR190 [colE1 cat lacIq Plac::pbpA(L61R/A147C/R237C)-rodA]
A 5’ fragment of the pbpA(L61R) gene was amplified from genomic DNA of a pbpA(L61R) mutant strain11, using primers o761 (CCCGCGAAATTAATACGACTCACTATAGGG) and o147C_R (CTGATTGACGCAAAAGCGAGCTACTTGTACTTCGG). A 3’ fragment of pbpA(A147C/R237C) was amplified from pPR152 using primers o147C_QC (GACCGAAGTACAAGTAGCTCGCTTTTGCGTCAATCAGTACCGTTTTCCGGGTGTCGAAG), and o1320 (TTAATGGTCCTCCGCTGCGG). Overlap extension PCR was then performed to combine and amplify these two fragments using primers o761 and o1320. The resulting product was PCR purified, digested with XbaI/KpnI, and cloned into similarly digested pHC85720.
Data availability
Structure factors and refined atomic coordinates for wild type RodA:PBP2 complex and the RodA(D255A):PBP2 variant complex are deposited in the RCSB Protein Data Bank under accession codes 6PL5 and 6PL6, respectively. All other data that support the findings of this study are available from the corresponding author upon request. Source data for Figs. 2b and 2d are provided with the paper.
Extended Data
Extended Data Fig. 1: RodA:PBP2 complex interface within the membrane plane.
The transmembrane helix of PBP2 is shown as blue ribbons and transparent molecular surfaces to highlight its interaction with a, RodA transmembrane helix 8 and b, RodA transmembrane helix 9.
Extended Data Fig. 2: Evolutionary covariation analysis of RodA-PBP2 interface.
Graphical representation of 19 evolutionary couplings between RodA-PBP2.
Extended Data Fig. 3: RodA:PBP2 complex interface II.
PBP2 is shown as ribbons colored blue and RodA is shown as molecular surfaces and colored green. The insets show two views of interface II. Side chains of PBP2 residues at the RodA interface are shown as sticks with hydrophobic residues also shown as transparent molecular surface to highlight surface complementarity. Two PBP2 residues that disrupted RodA function when substituted with arginine are labeled.
Extended Data Fig. 4: Shift of TM7 of RodA in complex with PBP2 results in a large membrane-accessible cavity.
Surface view of RodA:PBP2 complex (left) and RodA (right) representing electrostatic potential (top panel) and a cross section (bottom panel). The large surface-exposed cavity is outlined in black dotted lines.
Extended Data Fig. 5: PBP2 mutants co-purify with RodA.
PBP2 variants were co-expressed with FLAG-tagged RodA and purified using anti-FLAG affinity resin. SDS-PAGE gel showing the elution from the anti-FLAG affinity resin demonstrates that PBP2 remains associated with RodA throughout the purification. Results are derived from one experiment.
Extended Data Fig. 6: Structural comparison of extracytoplasmic domains of PBP2 from T. thermophilus and H. pylori.
The catalytic serine in each transpeptidase in shown as a red sphere.
Extended Data Fig. 7: E. coli PBP2 variants co-purify with E. coli RodA.
PBP2 variants were co-expressed with FLAG-tagged RodA and purified using anti-FLAG affinity resin. SDS-PAGE gel showing the elution from the anti-FLAG affinity resin demonstrates that PBP2 remains associated with RodA throughout the purification. Low (L) and high (H) correspond to approximately 2 μg and 4 μg as measured by A280. Results are derived from one experiment.
Extended Data Fig. 8: RodA:PBP2 complex crystal lattice.
The TtRodA:PBP2 complex adopts type 1 lipid cubic phase crystal packing. RodA and PBP2 are shown in green and blue, respectively.
Extended Data Fig. 9: EM analysis of TtRodA:PBP2 complex.
a, Representative EM micrograph of negatively stained RodA:PBP2 complex solubilized in DDM detergent micelles. Scale bar denotes 50 nm. b, Representative two-dimensional class averages from a total of 32,152 particles. Scale bar represents 10 nm. Results are derived from one experiment.
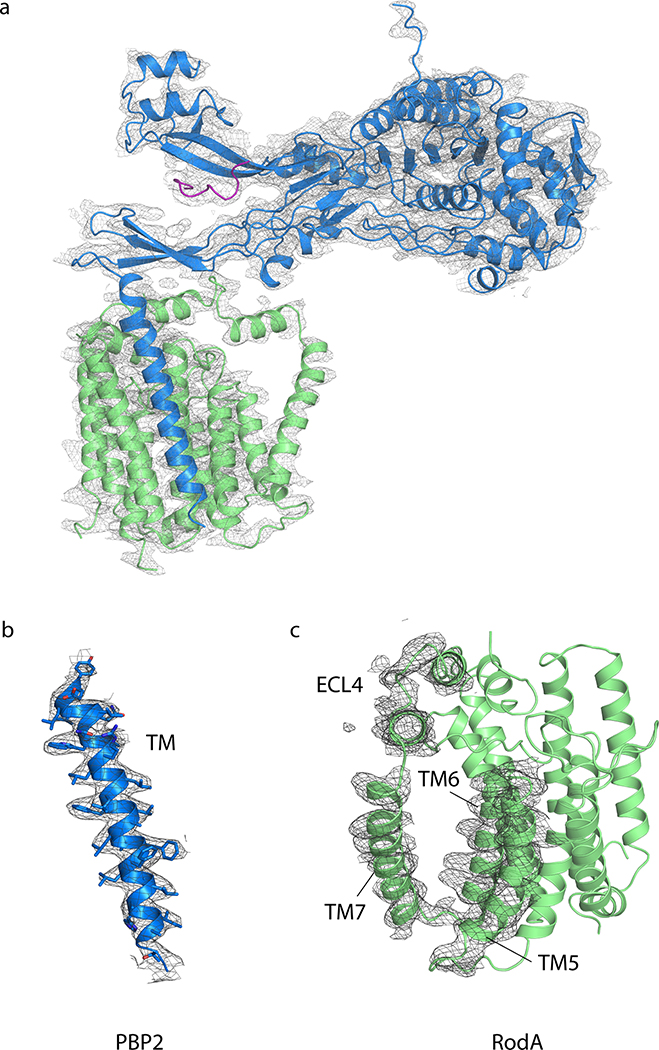
Extended Data Fig. 10: Electron density map.
2Fo−Fc electron density map contoured at 1.0 σ within a 2.3 Å radius of atoms shown for a, the entire T. thermophilus RodA:PBP2 complex b, the transmembrane helix of PBP2 and c, transmembrane helices 5–7 and extracellular loop 4 of RodA.
Supplementary Material
Acknowledgments
Financial support for the work was provided by NIH grant U19AI109764 (A.C.K., D.Z.R., T.G.B., S.W. and D. K.), NIH grant R01GM106303 (D.S.M.), the Howard Hughes Medical Institute (T.G.B), NIH grant 5F31GM128233-02 (S.C.E), and a CIHR doctoral research award to P.D.A.R. We thank Advanced Photon Source GM/CA beamline staff for excellent facilities and technical assistance during X-ray data collection and M. Welsh for the generous gift of purified lipid II substrate.
Footnotes
Competing interests
Authors declare no competing interests.
References
- 1.Meeske AJ et al. SEDS proteins are a widespread family of bacterial cell wall polymerases. Nature 537, 634–638 (2016). [DOI] [PMC free article] [PubMed] [Google Scholar]
- 2.Emami K et al. RodA as the missing glycosyltransferase in Bacillus subtilis and antibiotic discovery for the peptidoglycan polymerase pathway. Nat. Microbiol 2, 16253 (2017). [DOI] [PMC free article] [PubMed] [Google Scholar]
- 3.Cho H et al. Bacterial cell wall biogenesis is mediated by SEDS and PBP polymerase families functioning semi-autonomously. Nat. Microbiol 1, 16172 (2016). [DOI] [PMC free article] [PubMed] [Google Scholar]
- 4.Rohs PAD et al. An activation pathway governs cell wall polymerization by a bacterial morphogenic machine. bioRxiv (2018). [Google Scholar]
- 5.Taguchi A et al. FtsW is a peptidoglycan polymerase that is activated by its cognate penicillin-binding proteins. Nat. Microbiol (2019). doi: 10.1101/358663 [DOI] [PMC free article] [PubMed] [Google Scholar]
- 6.Reichmann NT et al. SEDS–bPBP pairs direct lateral and septal peptidoglycan synthesis in Staphylococcus aureus. Nat. Microbiol (2019). doi: 10.1038/s41564-019-0437-2 [DOI] [PubMed] [Google Scholar]
- 7.Silhavy TJ, Kahne D & Walker S The bacterial cell envelope. Cold Spring Harb. Perspect. Biol 2, a000414 (2010). [DOI] [PMC free article] [PubMed] [Google Scholar]
- 8.Scheffers D-J & Tol MB LipidII: Just Another Brick in the Wall? PLOS Pathog. 11, e1005213 (2015). [DOI] [PMC free article] [PubMed] [Google Scholar]
- 9.Otten C, Brilli M, Vollmer W, Viollier PH & Salje J Peptidoglycan in obligate intracellular bacteria. Mol. Microbiol 107, 142–163 (2018). [DOI] [PMC free article] [PubMed] [Google Scholar]
- 10.Ruiz N Lipid Flippases for Bacterial Peptidoglycan Biosynthesis. Lipid Insights 8, 21–31 (2015). [DOI] [PMC free article] [PubMed] [Google Scholar]
- 11.Rohs PDA et al. A central role for PBP2 in the activation of peptidoglycan polymerization by the bacterial cell elongation machinery. PLOS Genet. 14, e1007726 (2018). [DOI] [PMC free article] [PubMed] [Google Scholar]
- 12.Taguchi A et al. FtsW is a peptidoglycan polymerase that is functional only in complex with its cognate penicillin-binding protein. Nat. Microbiol 1 (2019). doi: 10.1038/s41564-018-0345-x [DOI] [PMC free article] [PubMed] [Google Scholar]
- 13.Sjodt M et al. Structure of the peptidoglycan polymerase RodA resolved by evolutionary coupling analysis. Nature 556, 118–121 (2018). [DOI] [PMC free article] [PubMed] [Google Scholar]
- 14.Caffrey M A comprehensive review of the lipid cubic phase or in meso method for crystallizing membrane and soluble proteins and complexes. Acta Crystallogr. Sect. F Struct. Biol. Commun 71, 3–18 (2015). [DOI] [PMC free article] [PubMed] [Google Scholar]
- 15.Levy N et al. Structural Basis for E. coli Penicillin Binding Protein (PBP) 2 Inhibition, a Platform for Drug Design. J. Med. Chem (2019). doi: 10.1021/acs.jmedchem.9b00338 [DOI] [PubMed] [Google Scholar]
- 16.Contreras-Martel C et al. Molecular architecture of the PBP2–MreC core bacterial cell wall synthesis complex. Nat. Commun 8, 776 (2017). [DOI] [PMC free article] [PubMed] [Google Scholar]
- 17.Mravic M et al. Packing of apolar side chains enables accurate design of highly stable membrane proteins. Science 363, 1418–1423 (2019). [DOI] [PMC free article] [PubMed] [Google Scholar]
- 18.Ovchinnikov S, Kamisetty H & Baker D Robust and accurate prediction of residue–residue interactions across protein interfaces using evolutionary information. Elife 3, (2014). [DOI] [PMC free article] [PubMed] [Google Scholar]
- 19.Hopf TA et al. Sequence co-evolution gives 3D contacts and structures of protein complexes. Elife 3, e03430 (2014). [DOI] [PMC free article] [PubMed] [Google Scholar]
- 20.Cho H, Uehara T & Bernhardt TG Beta-Lactam Antibiotics Induce a Lethal Malfunctioning of the Bacterial Cell Wall Synthesis Machinery. Cell 159, 1300–1311 (2014). [DOI] [PMC free article] [PubMed] [Google Scholar]
- 21.Otero LH et al. How allosteric control of Staphylococcus aureus penicillin binding protein 2a enables methicillin resistance and physiological function. Proc. Natl. Acad. Sci. U. S. A 110, 16808–16813 (2013). [DOI] [PMC free article] [PubMed] [Google Scholar]
- 22.Fay A, Meyer P & Dworkin J Interactions between late-acting proteins required for peptidoglycan synthesis during sporulation. J. Mol. Biol 399, 547–61 (2010). [DOI] [PMC free article] [PubMed] [Google Scholar]
- 23.Fraipont C et al. The integral membrane FtsW protein and peptidoglycan synthase PBP3 form a subcomplex in Escherichia coli. Microbiology 157, 251–259 (2011). [DOI] [PubMed] [Google Scholar]
- 24.Welsh MA et al. Identification of a Functionally Unique Family of Penicillin-Binding Proteins. J. Am. Chem. Soc 139, 17727–17730 (2017). [DOI] [PMC free article] [PubMed] [Google Scholar]
- 25.Caffrey M & Cherezov V Crystallizing membrane proteins using lipidic mesophases. Nat. Protoc 4, 706–731 (2009). [DOI] [PMC free article] [PubMed] [Google Scholar]
- 26.Kabsch W XDS. Acta Crystallogr. Sect. D Biol. Crystallogr 66, 125–132 (2010). [DOI] [PMC free article] [PubMed] [Google Scholar]
- 27.McCoy AJ et al. Phaser crystallographic software. J. Appl. Crystallogr (2007). doi: 10.1107/s0021889807021206 [DOI] [PMC free article] [PubMed] [Google Scholar]
- 28.Fedarovich A, Nicholas RA & Davies C Unusual Conformation of the SxN Motif in the Crystal Structure of Penicillin-Binding Protein A from Mycobacterium tuberculosis. J. Mol. Biol 398, 54–65 (2010). [DOI] [PMC free article] [PubMed] [Google Scholar]
- 29.Emsley P & Cowtan K Coot: model-building tools for molecular graphics. Acta Crystallogr. D. Biol. Crystallogr 60, 2126–32 (2004). [DOI] [PubMed] [Google Scholar]
- 30.Afonine PV et al. Towards automated crystallographic structure refinement with phenix.refine. Acta Crystallogr. Sect. D Biol. Crystallogr (2012). doi: 10.1107/S0907444912001308 [DOI] [PMC free article] [PubMed] [Google Scholar]
- 31.Strong M et al. Toward the structural genomics of complexes: Crystal structure of a PE/PPE protein complex from Mycobacterium tuberculosis. Proc. Natl. Acad. Sci. U. S. A 103, 8060–8065 (2006). [DOI] [PMC free article] [PubMed] [Google Scholar]
- 32.Chen VB et al. MolProbity: all-atom structure validation for macromolecular crystallography. Acta Crystallogr. D. Biol. Crystallogr 66, 12–21 (2010). [DOI] [PMC free article] [PubMed] [Google Scholar]
- 33.The PyMOL molecular graphics system, version 2.0. Schrödinger, LLC [Google Scholar]
- 34.Morin A et al. Collaboration gets the most out of software. Elife (2013). doi: 10.7554/eLife.01456 [DOI] [PMC free article] [PubMed] [Google Scholar]
- 35.Ashkenazy H et al. ConSurf 2016: an improved methodology to estimate and visualize evolutionary conservation in macromolecules. Nucleic Acids Res. 44, W344–W350 (2016). [DOI] [PMC free article] [PubMed] [Google Scholar]
- 36.Scheres SHW RELION: Implementation of a Bayesian approach to cryo-EM structure determination. J. Struct. Biol 180, 519–530 (2012). [DOI] [PMC free article] [PubMed] [Google Scholar]
- 37.Tang G et al. EMAN2: An extensible image processing suite for electron microscopy. J. Struct. Biol 157, 38–46 (2007). [DOI] [PubMed] [Google Scholar]
- 38.Qiao Y et al. Detection of lipid-linked peptidoglycan precursors by exploiting an unexpected transpeptidase reaction. J. Am. Chem. Soc (2014). doi: 10.1021/ja508147s [DOI] [PMC free article] [PubMed] [Google Scholar]
- 39.Bendezu FO & de Boer PAJ Conditional Lethality, Division Defects, Membrane Involution, and Endocytosis in mre and mrd Shape Mutants of Escherichia coli. J. Bacteriol 190, 1792–1811 (2008). [DOI] [PMC free article] [PubMed] [Google Scholar]
- 40.Smale ST -Galactosidase Assay. Cold Spring Harb. Protoc 2010, pdb.prot5423-pdb.prot5423 (2010). [DOI] [PubMed] [Google Scholar]
- 41.Ducret A, Quardokus EM & Brun YV MicrobeJ, a tool for high throughput bacterial cell detection and quantitative analysis. Nat. Microbiol 1, (2016). [DOI] [PMC free article] [PubMed] [Google Scholar]
Associated Data
This section collects any data citations, data availability statements, or supplementary materials included in this article.
Supplementary Materials
Data Availability Statement
Structure factors and refined atomic coordinates for wild type RodA:PBP2 complex and the RodA(D255A):PBP2 variant complex are deposited in the RCSB Protein Data Bank under accession codes 6PL5 and 6PL6, respectively. All other data that support the findings of this study are available from the corresponding author upon request. Source data for Figs. 2b and 2d are provided with the paper.


