Figure 2.
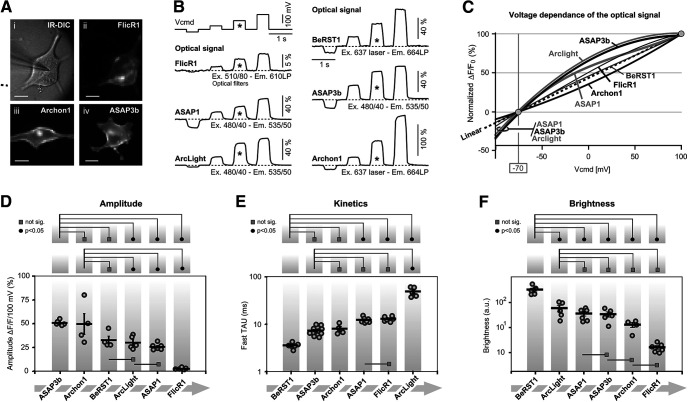
Optical signal amplitude, voltage sensitivity, and kinetics. A, Microphotographs of HEK cells used for characterization of the GEVIs. i, Infrared image of a cell transfected with FlickR1, with patch pipette attached. ii, FlicR1 fluorescence captured by a fast (low-resolution) camera. iii, iv, same as ii, except Archon1 or ASAP3b plasmids were used. B, Each cell was voltage clamped at four command potentials (Vcmd). An asterisk marks a 100-mV-large voltage transient (from −70 to +30), which was used for reporting ΔF/F in D and Fast TAU in E. Each optical trace is a product of four temporal averaging from the same cell. The best cell is displayed. Light power is reported in mW/mm2: FlicR1 = 1.4; ASAP1 = 2.0; ArcLight = 1.3; BeRST1 = 0.43; ASAP3b = 2.0; and Archon1 = 4.69. C, Voltage sensitivity trends of six voltage indicators are superimposed. Trends are polynomial fits of the third order through the mean value of each voltage step. Each mean value is an average of four to six cells. Marker points and error bars are omitted for clarity. D, Graph within borders: amplitudes of the optical signals in response to a standard 100-mV-large change in membrane potential. Each circle marker represents averaged data from one HEK cell. Thick horizontal dash is the group mean ± SEM. In this and all remaining figure panels, above the graph are displayed the results of one-way ANOVA with post hoc Tukey’s test. Black full circles indicate p < 0.05. Gray rectangles indicate no significant difference (p > 0.05). E, Optical transient was fitted with double exponential. These Fast TAU values are plotted in the graph. Each circle marker represents averaged data from one HEK cell. F, Cell body resting light intensity (basal fluorescence) in arbitrary units (a.u.).

