

Abstract
Objective.
The ability to monitor anesthetic states using automated approaches is expected to reduce inaccurate drug dosing and side-effects. Commercially available anesthetic state monitors perform poorly when ketamine is administered as an anesthetic-analgesic adjunct. Poor performance is likely because the models underlying these monitors are not optimized for the electroencephalogram (EEG) oscillations that are unique to the co-administration of ketamine.
Approach.
In this work, we designed two k-nearest neighbors algorithms for anesthetic state prediction.
Main results.
The first algorithm was trained only on sevoflurane EEG data, making it sevoflurane-specific. This algorithm enabled discrimination of the sevoflurane general anesthesia (GA) state from sedated and awake states (true positive rate = 0.87, [95% CI, 0.76, 0.97]). However, it did not enable discrimination of the sevoflurane-plus-ketamine GA state from sedated and awake states (true positive rate = 0.43, [0.19, 0.67]). In our second algorithm, we implemented a cross drug training paradigm by including both sevoflurane and sevoflurane-plus-ketamine EEG data in our training set. This algorithm enabled discrimination of the sevoflurane-plus-ketamine GA state from sedated and awake states (true positive rate = 0.91, [0.84, 0.98]).
Significance.
Instead of a one-algorithm-fits-all-drugs approach to anesthetic state monitoring, our results suggest that drug-specific models are necessary to improve the performance of automated anesthetic state monitors.
Keywords: anesthesia, electroencephalogram, ketamine, machine learning, sevoflurane
1. Introduction
General anesthesia (GA) is a drug-induced reversible state of unconsciousness, amnesia, analgesia, immobility, and stability of autonomic, cardiovascular, respiratory, and thermoregulatory systems [1]. Anesthetic drugs are routinely administered empirically based on pharmacokinetic and pharmacodynamic principles, and physiological variables such as changes in heart rate or blood pressure [2]. However, since the 1990s, anesthetic states have also been tracked using indices (0–100) computed from the electroencephalogram (EEG) and displayed on anesthetic state monitoring devices [3]. With the induction of general anesthesia, these indices usually change from high values that indicate the awake state to lower values that indicate anesthetic states [3]. The algorithms and EEG-derived features that are used to calculate these indices are largely proprietary [4, 5]. Thus, their assumptions and oversights are inaccessible to clinicians for real-time decision making, and their reliability has been called into question in numerous clinical scenarios [5–9].
Clinicians routinely administer the combination of a hypnotic anesthetic drug such sevoflurane or propofol, to maintain unconsciousness, and ketamine, for analgesia, as part of a balanced general anesthetic technique [10]. Index-based anesthetic state monitoring devices typically function as designed in representative patients receiving sevoflurane or propofol [4, 5]. However, during the balanced GA state with ketamine, index-based anesthetic monitoring devices do not typically function as designed (i.e. high indices that indicate the patient is awake are outputted) [4–6]. We note that neurophysiological oscillations associated with sevoflurane or propofol GA include alpha (8–12 Hz) and slow-delta (0.1–4 Hz) oscillations [1, 10–13]. During sevoflurane (propofol)-plus-ketamine general anesthesia, the alpha and slow-delta oscillations are reduced in power, and there is an increase in beta oscillation power [14, 15]. Thus, we conjecture that the poor performance of commercially available index-based anesthetic monitoring devices arises from the models underlying these algorithms catering to the unique EEG dynamics of sevoflurane or propofol: a ‘one-algorithm-fits-all-drugs’ paradigm for monitoring anesthetic states. This conjecture is supported by scientific literature [5–9]. For example, Hans et al showed that an infusion of ketamine in patients receiving propofol anesthesia is associated with an increase in BIS indices [6].
In this work, we developed two EEG-based automated anesthetic state prediction systems using the k-nearest neighbors (KNN) algorithm to classify the awake, sedated, and sevoflurane GA anesthetic states. The first algorithm was trained only on sevoflurane EEG data, making it sevoflurane-specific. In the second algorithm, we implemented a cross drug training paradigm by including both sevoflurane and sevoflurane-plus-ketamine EEG data in our training set. While the algorithms underlying commercially available index-based anesthetic monitoring systems are proprietary, our results show that their poor performance on sevoflurane-plus-ketamine may be due to a one-algorithm-fits-all-drugs training paradigm for monitoring anesthetic states.
2. Materials and methods
2.1. Volunteer selection and experimental protocol
This research study was reviewed by and received ethical clearance from the Partners Human Research Committee and was conducted at the Massachusetts General Hospital (NCT03503578). Details of the study design have previously been reported [12]. We obtained written informed consent from a total of 12 healthy volunteers (7 males; 5 females). Criteria for inclusion were normal body weight and habitus (BMI 30), age between 18 and 50, non-smoker, and American Society of Anesthesiologist physical status class 1. Volunteers were excluded if they had any chronic health conditions, were on any non-prescription medications expected to affect the central nervous system function or had allergies to any medications required for safe conduct of the study. Volunteers also underwent medical examination including a standardized pre-anesthesia assessment, a urine toxicology screen, and urine pregnancy testing. Mean weight was 69.9 kg (SD, ± 11.7) and mean BMI was 24.1 kg m−2 (±3.0). Subject ages ranged from 20–34 years with a mean age of 25 (±4.8). Each volunteer underwent both sevoflurane-induced general anesthesia and sevoflurane-plus-ketamine-induced general anesthesia, but on separate study days, ranging 2–7 days apart. A schematic of our study is provided in figure 1.
Figure 1.

Study schematic depicting the concentrations and durations of anesthetic-drugs delivered during (A) sevoflurane study visit and (B) sevoflurane-plus-ketamine study visit. Note that the ‘sedated’ state does not occur during the sevoflurane-plus-ketamine visit and the duration of sevoflurane administration in both the visit was approximately similar (i.e. 45 min).
We administered sevoflurane using the Dräger Fabius Tiro (Telford, PA, USA) machine. Sevoflurane was administered via a tight-fitting face-mask. For the sevoflurane GA visit, we increased the end-tidal sevoflurane concentration in a stepwise fashion from baseline (awake) to 1.1% (sedated), 2.1% (GA), and 2.8% (GA). Each concentration was maintained for 15 min. For the sevoflurane-plus-ketamine GA visit, after the baseline (awake) state, we increased the sevoflurane end-tidal concentration to 2.1% (GA) and maintained it for 15 min. Next, we administered a bolus of ketamine (0.75 mg kg−1) while maintaining the sevoflurane concentration for an additional 30 min (GA). Two board-certified anesthesiologists were present during all study procedures.
We recorded high-density EG signals using the Waveguard system with a standard EEG cap (64 channels, ANT Neuro, Netherlands) and electrode impedances of <5 kΩ. The mean recording durations for the sevoflurane and sevoflurane-plus-ketamine visits were 88.21 min (± 4.73) and 87.94 min (± 9.13) respectively. Thus, anesthetic duration on both study visits were approximately the same. EEG data were down-sampled to an EEG sampling frequency of 250 Hz and spline-interpolated (for corrupted channels) using ASA-Lab software (ANT Neuro, Netherlands). A standard nearest-neighbor Laplacian reference was applied. EEG features were obtained from five frontal electrodes [16]. We used the median of each feature across the five electrodes for downstream analyses.
2.2. Algorithm selection
An initial feature set of 100 time-domain, spectraldomain, and entropy-domain features were analyzed to determine the machine learning algorithm best suited to distinguish anesthetic states in our study. The spectral-domain EEG dynamics were statistical features of the distribution of a band-passed EEG epoch’s spectral power. We considered a wide array of frequency bands: slow (0.1–2 Hz), delta (2.1–4 Hz), slow-delta (0.1–4 Hz), theta (4.1–8 Hz), alpha (8.1–12 Hz), low-beta (12.5–15 Hz), high-beta (15.1–30 Hz), and total (0.1–30 Hz). The time-domain EEG dynamics were statistical features of the distribution of a raw EEG epoch. The entropy-domain EEG dynamics were entropic features of the distribution of a band-passed epoch’s spectral power, the distribution of the raw EEG, and other entropy measures that have proven informative in the context of EEG analysis. These include permutation entropy [17], Shannon entropy [18],Ŕenyi entropy [19], sample entropy [20], approximate entropy [21], and the Higuchi fractal dimension [22].
Following an exhaustive analysis of feature sub-sets of this original 100-feature set, algorithms, and hyperparameters, the KNN algorithm, endowed with the city-block metric, outperformed all other multiclass classification algorithms within the Matlab® Classification Learner toolbox (decision trees, nearest neighbor classifiers, and ensemble classifiers). For a given query point q, KNN finds the k data points in its training set closest to q, where distance is measured by its endowed metric [18]. It then uses the classifications of these points to find the most probable class. The city-block metric—also known as the ℓ1 metric— emphasizes small component-wise differences in data [18]. To find the optimal hyperparameter choice k for our KNN models, we performed a grid-search and found the optimum value to be k = 6. This optimization occurred before any testing, and there was no further inner loop to vary k when testing on different subjects.
2.3. Training data and prediction classes
All models were trained on the five-minute EEG epochs. For the sevoflurane visit, we selected EEG epochs 10 min after the sevoflurane concentration reached the desired steady-state concentrations of 1.1, 2.1, and 2.8%. For the sevoflurane-plus-ketamine visit, the EEG epochs were selected 10 min after sevoflurane reached the desired steady-state concentration of 2.1% and 2 min after the ketamine bolus was administered. We selected five-minute EEG epochs during baseline 10 min after the start of each visit’s recording. We selected the last 5 min EEG epochs of each subjects’ recording as emergence epochs. Each 5 min segment was then partitioned into seventy-five 4 s epochs. We combined similar anesthetic states for model training: awake (pre- and post-anesthesia), sedation (1.1% sevoflurane), and GA (2.1% sevoflurane and 2.8% sevoflurane). We justify the grouping of broad anesthetic-states for our prediction systems in Appendix A.
2.4. Feature selection
In general, the KNN algorithm performs best when data from each class exist in mutually exclusive clusters that can be separated by hyperplanes in the feature space [23]. We defined this separation of clusters as linear separation. Linear separation of our classes would give a Bayes error close to zero such that data can be optimally separated with few disconnected components [23]. From our original 100-feature space, we extracted two sets of features. The first set contained the 17 features that linearly separated our a priori defined anesthetic states for the sevoflurane visit. The second set contained the 14 features that linearly separated our a priori defined states for the sevoflurane-plus-ketamine visit. We selected the 8 features that overlapped both lists as our feature set (table 1). We visually inspected each of these eight features to ensure that the linear separation of our classes was preserved across both study visits. A moving window of 40 s was applied to all spectral features. A moving window of 1 min was applied to all time and entropy features. In appendix B, we use a different feature space—the union of the two aforementioned sets of features—for validation testing. Thus, this alternative feature space is the set of features that linearly separate a priori defined anesthetic state classes in either the sevoflurane visit or the sevoflurane-plus-ketamine visit.
Table 1.
Feature space of variables that linearly separate our anesthetic state classes for both sevoflurane and sevoflurane-plus-ketamine visits.
| Domain | Features |
|---|---|
| Spectral | Mean power of slow (0.1–2 Hz) Mean power of theta (4.1–8 Hz) Mean power of low-beta (12.5–15 Hz) |
| Time | Mean instantaneous frequency Kurtosis of instantaneous frequency Hjorth mobility |
| Entropy | Permutation entropy Higuchi fractal dimension |
| Total | 8 |
The multitaper approach for spectral analysis was used to obtain spectral features [24]. The multitaper parameters were as follows: window length T = 4 s with no overlap, time-bandwidth product TW = 3, number of tapers K = 5, and spectral resolution = 1.5 Hz. Spectral features were normalized, at the subject level, by the baseline median slow power (0.1–2 Hz).
The instantaneous frequency (IFE) was extracted from the raw EEG signal by computing the numerical derivative of its Hilbert transform [25]. To derive the IFE mean of a given 4 s epoch, we computed the average instantaneous frequency across each value in that 4 s epoch [25]. Similarly, to find the IFE kurtosis, we computed the kurtosis of instantaneous frequency across that 4 s epoch [25]. The Hjorth mobility parameter is the square root of the ratio between the variance of the first derivative of the raw EEG and the variance of its amplitude [26]. This provides a normalized average slope and can be viewed as another estimate of the mean frequency of the EEG [26].
Permutation entropy is an entropic measure of the monotonicity of a signal [17]. For example, a predictable signal that is monotonically non-decreasing (or non-increasing) will have a permutation entropy of 0. Conversely, an irregular, non-monotone signal like an EEG will have a large, positive permutation entropy [17]. We used an amplitude sampling length of 4 and a permutation length of 5 when computing the permutation entropy of an EEG epoch. The Higuchi fractal dimension measures the fractal dimension of irregular time-series data like raw EEG signals [22]. The Higuchi fractal dimension ranges from 1 to 2 in EEG analysis, where a fractal dimension of 1 indicates regularity in a signal and a fractal dimension of 2 indicates extreme complexity [22]. For example, a signal filtered using a Butterworth low pass filter will have a Higuchi fractal dimension close to 1. Conversely, randomly generated data with a large noise component will have a Higuchi fractal dimension close to 2. We used a maximum number of sub-channels of 3 when computing the Higuchi fractal dimension.
2.5. Hidden Markov model filtering
In isolation, KNN classifies each epoch independently from its preceding epochs. However, earlier predictions could provide important insight into what states are likely or unlikely. A noisy epoch could be correctly classified if prior predictions imply an unchanging anesthetic state. The hidden Markov model (HMM) decoding algorithm allows a model to incorporate the contextual information associated with prior predictions [27, 28]. HMMs are a class of probabilistic models that attempt to uncover the ‘true’ state from a sequence of observed ones [27, 28]. In the context of this work, hidden states were the true anesthetic states associated with a given drug-class or drug-class combination, while observed states were the ‘noisy’ predictions made by the algorithm [27, 28]. The HMM decoding algorithm finds the most probable sequence of hidden states using the transition and emission matrices. The transition matrix describes the probability of transitioning from one state to another and is extracted from the true anesthetic states given by the labeled training data. The emission matrix describes the probability distribution of stages assigned by KNN as a function of the underlying hidden state and is derived by counting the pairs of correct predictions of KNN for each epoch in the full-length data of the subjects in the training set. We applied the HMM decoding algorithm to our models’ predictions.
2.6. Experimental design and cross-validation
We created an experimental design consisting of two models that were tested on data from both the study visits. All models were trained on the clean five-minute epochs referenced in section 2.3 and tested on the full-length EEG recordings. Table 2 summarizes our models and their respective training and testing sets.
Table 2.
Experimental design consisting of four models with varying training and testing sets. Sevo. indicates sevoflurane.
| Training set | Testing set | |
|---|---|---|
| Model 1a | Sevo. visit | Sevo. visit |
| Model 1b | Sevo. visit | Sevo.-plus-ketamine visit |
| Model 2a | Both visits | Sevo. visit |
| Model 2b | Both visits | Sevo.-plus-ketamine visit |
Model 1a, the sevoflurane-specific model, was trained and tested on data from the sevoflurane visit only. Model 1b, our cross-test model, was trained on data from the sevoflurane visit but tested on data from the sevoflurane-plus-ketamine visit. Hence, through model 1b, we investigated how a sevoflurane-specific model performed when applied to a different drug-class combination than that which is in its training set.
In model 2, we expanded the training dataset to include the 5 min epochs from both the sevoflurane and the sevoflurane-plus-ketamine visits in order to study the effect of a broader training set on model performance in sevoflurane-plus-ketamine GA. Model 2a was tested on data from the sevoflurane visit and model 2b was tested on data from the sevoflurane-plus-ketamine visit.
We implemented a leave-one-subject-out cross-validation (figure 2), which ensured that models were tested on ‘unseen’ subjects [18]. We trained each model on N − 1 subjects and tested on the remaining subject. This process was repeated until each subject was tested once, resulting in N iterations of training and testing [18].
Figure 2.

Schematic of model training.
2.7. Performance metric and statistical analysis
The GA-specific F1 score was used to measure the performance of our models [18, 29]. The GA-specific (either sevoflurane or sevoflurane-plus-ketamine) F1 score was defined to be the harmonic mean of GA specificity (true-negative rate) and GA sensitivity (true-positive rate). To measure whether performance differed significantly across testing sets, we compared the GA-specific F1 score associated with the sevoflurane visit to the GA-specific F1 score associated with the sevoflurane-plus-ketamine visit. For statistical inference, we performed ANOVA testing with post-hoc comparisons for all model pairs using the Tukey-Kramer Honest Significance Test (Matlab, Natick, MA, USA). Threshold for statistical significance, p < 0.05.
3. Results
Our sevoflurane-specific model exhibited a GA-specific F1 score of 0.84, [95% CI, 0.77, 0.92] when tested on sevoflurane GA (model 1a). Our sevoflurane-specific model exhibited a GA-specific F1 score of to 0.66, [0.49, 0.83] when tested on sevoflurane-plus-ketamine GA (model 1b). This decrease in performance was due to misclassifications of sevoflurane-plus-ketamine GA epochs as awake and sedated states. Our cross drug model, exhibited a GA-specific F1 score of 0.91, [0.87, 0.94] when tested on sevoflurane GA (model 2a). In contrast to our sevoflurane-specific model (model 1b), our cross drug model (model 2) exhibited a GA-specific F1 score of 0.94, [0.91, 0.96] when tested on sevoflurane-plus-ketamine GA (model 2b). These data are summarized in table 3, and the average confusion matrices for all four models are provided in figure 3. The improvement associated with predicting sevoflurane-plus-ketamine GA-specific F1 score in our cross-drug training paradigm of 0.27, [0.08, 0.47] met our threshold for statistical significance (p = 0.002).
Table 3.
Class-specific F1 scores of models 1 and 2.
| Training set | Testing set | Awake F1 score [95% CI] | GA F1 score [95% CI] | |
|---|---|---|---|---|
| Model 1a | Sevoflurane visit | Sevoflurane visit | 0.91, [0.88, 0.95] | 0.84, [0.77, 0.92] |
| Model 1b | Sevoflurane visit | Sevoflurane-plus-ketamine visit | 0.84, [0.78, 0.91] | 0.66, [0.49, 0.83] |
| Model 2a | Both visits | Sevoflurane visit | 0.92, [0.88, 0.95] | 0.91, [0.87, 0.94] |
| Model 2b | Both visits | Sevoflurane-plus-ketamine visit | 0.90, [0.87, 0.93] | 0.94, [0.91, 0.96] |
Figure 3.
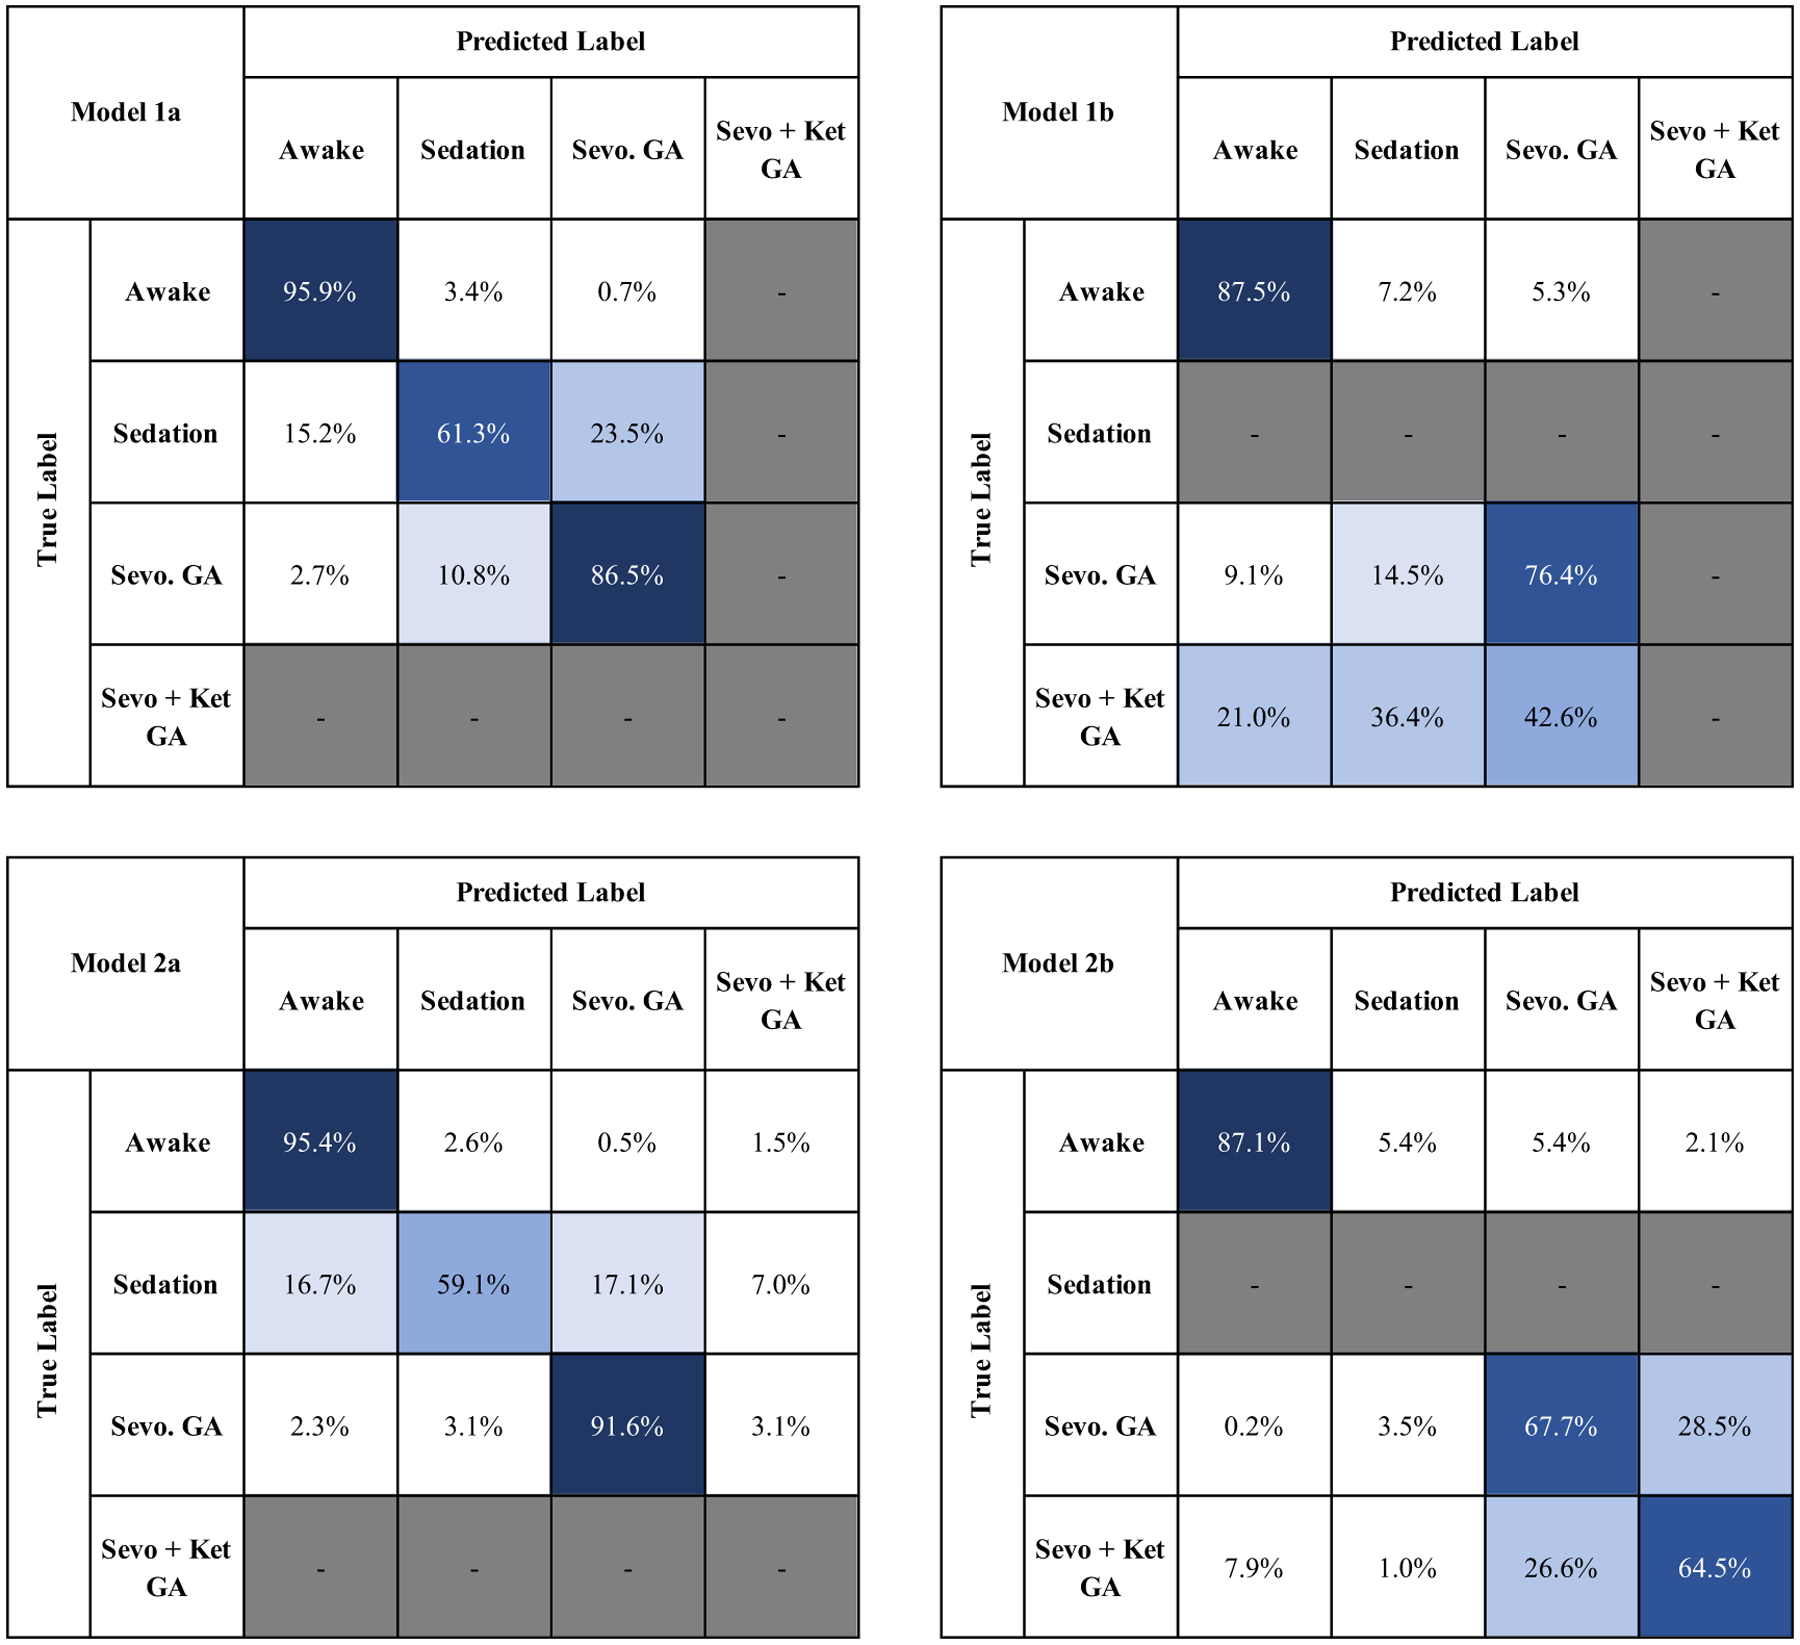
The average confusion matrices of models 1 and 2. Model 1b predicted 57.4% of sevoflurane-plus-ketamine GA epochs as awake or sedated. Model 2b predicted only 8.9% of sevoflurane-plus-ketamine GA epochs as awake or sedated. Integrity on the sevoflurane drug-class is maintained through the broader training set. (Sevo. = Sevoflurane, Sevo + Ket = sevoflurane-plus-ketamine).
The results in figure 3 illustrate that the decreased performance of the cross-test model (model 1b) is due to misclassifications of sevoflurane-plus-ketamine GA as either awake or sedation. In the cross drug model tested on sevoflurane-plus-ketamine (model 2b), this misclassification is largely corrected, with only 1% of sevoflurane-plus-ketamine being classified as sedation as opposed to 36.4% in model 1b. All models obtained high performance (awake-specific F1 score ⩾0.84) during the awake state.
In appendix B, we present the results of the same experiment performed on a different feature space. This feature space consists of EEG dynamics that linearly separate a priori defined anesthetic state classes in either the sevoflurane visit or the sevoflurane-plus-ketamine visit. We found that the performance of models 1a and 2a decreased sharply when trained on this new feature set. This result emphasizes the importance of feature selection.
4. Discussion
4.1. The role of drug-specificity in anesthetic state prediction
In this work, we showed that an anesthetic state prediction system that was trained on sevoflurane GA epochs (sevoflurane-specific) was able to discriminate sevoflurane GA epochs from sedated and awake states. However, this system poorly discriminated sevoflurane-plus-ketamine GA epochs from sedated and awake epochs. This result is consistent with the performance of commercially available anesthetic state prediction systems [5–9, 29]. For example, the BIS (Medtronic, Minneapolis, Minnesota) has been observed to increase significantly in patients receiving sevoflurane (propofol) -plus-ketamine GA compared to patients receiving sevoflurane (propofol) GA [6, 9]. In this work, we showed that the inclusion of sevoflurane-plus-ketamine GA epochs in an anesthetic state prediction system’s training set mitigated the poor discrimination of sevoflurane-plus-ketamine GA epochs from sedation and awake epochs. This improvement was feature-independent, as we employed a uniform set of eight features across both of the models tested.
Neural oscillations are the most prominent feature of the EEG [1, 10, 12, 13]. Each anesthetic drug class produces distinct oscillations that can be related to the circuit mechanisms of drug action [1, 10, 12, 13]. A growing body of evidence suggests that anesthetic-induced neural oscillations can be used to infer anesthetic states [1, 3]. Sevoflurane can be titrated to achieve a sedated state. During the sevoflurane sedated state, the frontal EEG shows increased beta oscillation (~13–23 Hz) power and an increase in slow-delta oscillation (0.1–4 Hz) power [11, 14]. During the sevoflurane GA state, the EEG instead shows increased alpha (8–12 Hz), theta (4–8 Hz), and slow-delta oscillation power [11, 12, 14]. However, during sevoflurane-plus-ketamine GA, the alpha oscillations typically associated with sevoflurane GA are reduced in power, and there is an increase in beta oscillation power [10]. This finding is also conserved for propofol-plus-ketamine anesthesia [15]. Thus, beta oscillations are synonymous with the awake state, sevoflurane sedation and sevoflurane-plus-ketamine GA [10, 11]. We conjecture that current EEG-based anesthetic state prediction systems routinely misclassify sevoflurane (propofol) -plus-ketamine GA states as sedation or awake states because they ascribe high sedation/awake states prediction weights to beta oscillations.
Schuller et al recently showed that BIS (Medtronic, Minneapolis, Minnesota) indices decreased to levels that are consistent with GA in awake and cognitively intact volunteers that received only muscle relaxants to achieve surgical paralysis [8]. Similarly, in 2018, Scheuler et al showed that index assignments given by three other monitors—NeuroSENSE (NeuroWave Systems), BIS (Medtronic) and Entropy (GE Healthcare)— were unreliable with ketamine [30]. These findings are consistent with our conjecture that EEG-based anesthetic state prediction systems ascribe high sedation/awake states prediction weights to beta oscillations. During the awake state, normal muscle activity contaminates the EEG in beta frequency ranges [3]. However, during surgical paralysis in awake and cognitively intact humans, there is an absence of spontaneous muscle activity and by proxy beta oscillation [3]. The absence of beta oscillations in awake and cognitively intact patients that received a muscle relaxant resulted in indices that were consistent with GA suggesting that the BIS algorithm ascribes high ‘awake’ prediction weights to EEG beta oscillations [3]. This finding is particularly important given that current indices may imprecisely suggest unconsciousness in patients that have been pharmacologically paralyzed but remain conscious [3]. Thus, given the limitations inherent to current index-based anesthetic state monitoring strategies, principled strategies that significantly improve upon the one-algorithm-fits-all-drugs approach to anesthetic state monitoring are necessary.
4.2. Study limitations
We have previously shown that the EEG dynamics of the anesthetized brain changes systematically as a function of age [31, 32] and perhaps, critical illness. Thus, limitations of our study include the small sample size and relatively uniform study population (i.e. young and healthy). Future studies that account for age differences and patient comorbidities are necessary for generalizability. However, our results provide context to explain why the reliability of index-based anesthetic monitoring devices have been called into question in numerous clinical scenarios. Also, we studied a limited set of EEG features. Therefore, a more expansive feature set or with feature-independent models may result in improved performance.
5. Conclusion
We conclude that a principled approach to automated anesthetic state targeting is feasible. However, instead of a one-algorithm-fits-all-drugs approach, we suggest that indices should be constructed to account for patient age, anesthetic drug or drug-class combinations, and perhaps, comorbidities.
Figure 4.

A comparison of the predictions of model 1b (cross-test model) and model 2b (cross drug model), the end-tidal sevoflurane concentration during the sevoflurane-plus-ketamine visit, and the spectrogram during the sevoflurane-plus-ketamine visit for an illustrative subject.
Acknowledgments
This work was supported by the National Institutes of Health, National Institute of Aging Grant R01AG053582 to O.A. O.A. has received speaker’s honoraria from Masimo Corporation and is listed as an inventor on pending patents on EEG monitoring and oral dexmedetomidine that are assigned to Massachusetts General Hospital. All other autors declare no competing interests.
Appendix A: Preliminary work
We also attempted this problem with a 5-class training paradigm. The model in this section was a KNN algorithm, trained on each unique anesthetic state during the sevoflurane visit: pre-anesthesia (awake), 1.1% sevoflurane (sedation), 2.1% sevoflurane (GA), 2.8% sevoflurane (GA) and post-anesthesia (awake). We trained our algorithm on the features listed in table 1 that linearly separated our a priori state classes during the sevoflurane visit. The confusion matrix detailing the performance of model A1 is provided in figure A1. Model A1 discriminated sedation with accuracy comparable to that of models in the literature [29]. However, model A1 often confused the baseline and emergence stages. Similarly, model A1 often confused different states of sevoflurane-induced GA (2.1% sevoflurane and 2.8% sevoflurane).
Figure A1.

The average confusion matrix of model A1. Baseline is often confused with emergence. 2.1% sevoflurane is often confused with 2.8% sevoflurane. (Sevo. = Sevoflurane, Anes. = Anesthesia).
Appendix B: Validation testing on an alternative feature set
In this appendix, we present the results of models trained on an alternative feature space–the union of tables B1 and B2 rather than the intersection. Thus, our feature set in this appendix is the set of features that linearly separate a priori defined state classes in either the sevoflurane visit or the sevoflurane-plus-ketamine visit (table B3). We applied the same KNN algorithm (city-block metric, k = 6) so that any differences in model performance are only a result of different feature spaces. Differences in performance across models are provided in table B4.
Table B1.
Features that linearly separate states during the sevoflurane visit. (RMS = root mean square).
| Domain | Feature |
|---|---|
| Spectral | Mean power of slow (0.1–2 Hz) Mean power of theta (4.1–8 Hz) Mean power of alpha (8.1–11.9 Hz) Mean power of low-beta (12–15 Hz) Mean power of high-beta (15.1–20 Hz) RMS of slow power (0.1–2 Hz) RMS of theta power (4.1–8 Hz) RMS of alpha power (8.1–11.9 Hz) RMS of low-beta power (12.5–15 Hz) RMS of high-beta power (15.1–20 Hz) |
| Time | Kurtosis of EEG Mean instantaneous frequency Kurtosis of instantaneous frequency Hjorth mobility |
| Entropy | Permutation entropy Higuchi fractal dimension Sample entropy |
| Total | 17 |
Table B2.
Features that linearly separate anesthetic states during the sevoflurane-plus-ketamine visit.
| Domain | Feature |
|---|---|
| Spectral | Mean power of slow band (0.1–2 Hz) Mean power of theta (4.1–8 Hz) Mean power of low-beta (12.5–15 Hz) Mean power of all-bands (0–30 Hz) SD of slow power (0.1–2 Hz) SD of theta power (4.1–8 Hz) SD of low-beta power (12.5–15 Hz) SD of total power (0–30 Hz) |
| Time | Mean instantaneous frequency Kurtosis of instantaneous frequency Hjorth mobility |
| Entropy | Permutation entropy Higuchi fractal dimension Renyi entropy |
| Total | 14 |
Table B3.
The superset of the union of features which linearly separated our a priori defined anesthetic state classes during the sevoflurane visit and the sevoflurane-plus-ketamine visit. For consistency, this table includes the root mean square (RMS) and Standard Deviation for each band, making it a superset of the union of tables B1 and B2. (SD = standard deviation, RMS = root mean square).
| Domain | Feature |
|---|---|
| Spectral | Mean, standard deviation, and root-mean square of slow-delta power (0–2 Hz) Mean, standard deviation, and root-mean square of theta power (4.1–8 Hz) Mean, standard deviation, and root-mean square of alpha power (8.1–11.8 Hz) Mean, standard deviation, and root-mean square of low-beta power (12–15 Hz) Mean, standard deviation, and root-mean square of high-beta power (15.1–20 Hz) Mean, standard deviation, and root-mean square of total power (0–30 Hz) |
| Time | Kurtosis of EEG Hjorth mobility Mean of instantaneous frequency Kurtosis of instantaneous frequency |
| Entropy | Permutation entropy Higuchi fractal dimension Renyi entropy Sample entropy |
| Total | 26 |
Table B4.
Comparison of two feature selection methods using the KNN algorithm with HMM-filtered predictions, tested on full-length data. (SD = standard deviation).
| Trained using features from the intersection from tables 1 and 2 | Trained using features from the union of from tables 1 and 2 | |
|---|---|---|
| GA performance (± SD) | GA performance (± SD) | |
| Model 1a | 0.865 (0.187) | 0.695 (0.401) |
| Model 1b | 0.598 (0.350) | 0.629 (0.324) |
| Model 2a | 0.934 (0.061) | 0.794 (0.373) |
| Model 2b | 0.946 (0.058) | 0.920 (0.081) |
References
- [1].Akeju O and Brown EN 2017. Neural oscillations demonstrate that general anesthesia and sedative states are neurophysiologically distinct from sleep Curr. Opin. Neurobiol 44 178–85 [DOI] [PMC free article] [PubMed] [Google Scholar]
- [2].Campagna JA, Miller KW and Forman S A 2003. Mechanisms of actions of inhaled anesthetics New Engl. J. Med 348 2110–24 [DOI] [PubMed] [Google Scholar]
- [3].Purdon PL, Sampson A, Pavone KJ and Brown EN 2015. Clinical electroencephalography for anesthesiologistspart I: background and basic signatures Anesthesiology 123 937–60 [DOI] [PMC free article] [PubMed] [Google Scholar]
- [4].Kreuzer M. EEG based monitoring of general anesthesia: taking the next steps. Front. Comput. Neurosci. 2017;11:56. doi: 10.3389/fncom.2017.00056. [DOI] [PMC free article] [PubMed] [Google Scholar]
- [5].Sandler NA 2000. Additional clinical observations utilizing bispectral analysis Anesth. Prog 47 84–86 [PMC free article] [PubMed] [Google Scholar]
- [6].Hans P, Dewandre PY, Brichant JF and Bonhomme V 2005. Comparative effects of ketamine on bispectral index and spectral entropy of the electroencephalogram under sevoflurane anaesthesia Br. J. Anaesth 94 336–40 [DOI] [PubMed] [Google Scholar]
- [7].Hirota K, Kubota T, Ishihara H and Matsuki A 1999. The effects of nitrous oxide and ketamine on the bispectral index and 95% spectral edge frequency during propofol-fentanyl anaesthesia Eur. J. Anaesthesiol 16 779–83 [DOI] [PubMed] [Google Scholar]
- [8].Schuller P, Newell S, Strickland P and Barry J 2015. Response of bispectral index to neuromuscular block in awake volunteers Br. J. Anaesth 115 i95–103 [DOI] [PubMed] [Google Scholar]
- [9].Sengupta S, Ghosh S, Rudra A, Kumar P, Maitra G and Das T 2011. Effect of ketamine on bispectral index during propofol–fentanyl anesthesia: a randomized controlled study Middle East J. Anaesthesiol 21 391–5 [PubMed] [Google Scholar]
- [10].Akeju O, Song AH, Hamilos AE, Pavone KJ, Flores FJ, Brown EN and Purdon PL 2016. Electroencephalogram signatures of ketamine anesthesia-induced unconsciousness Clin. Neurophysiol 127 2414–22 [DOI] [PMC free article] [PubMed] [Google Scholar]
- [11].Akeju O, Westover MB, Pavone KJ, Sampson AL, Hartnack KE, Brown EN and Purdon PL 2014. Effects of sevoflurane and propofol on frontal electroencephalogram power and coherence Anesthesiology 121 990–8 [DOI] [PMC free article] [PubMed] [Google Scholar]
- [12].Chamadia S. et al. Delta oscillations phase limit neural activity during sevoflurane anesthesia. Commun. Biol. 2019;2:415. doi: 10.1038/s42003-019-0664-3. [DOI] [PMC free article] [PubMed] [Google Scholar]
- [13].Pavone KJ, Akeju O, Sampson AL, Ling K, Purdon PL and Brown EN 2016. Nitrous oxide-induced slow and delta oscillations Clin. Neurophysiol 127 556–64 [DOI] [PMC free article] [PubMed] [Google Scholar]
- [14].Akeju O, Hamilos AE, Song AH, Pavone KJ, Purdon PL and Brown EN 2016. GABAA circuit mechanisms are associated with ether anesthesia-induced unconsciousness Clin. Neurophysiol 127 2472–81 [DOI] [PMC free article] [PubMed] [Google Scholar]
- [15].Hayashi K, Tsuda N, Sawa T and Hagihira S 2007. Ketamine increases the frequency of electroencephalographic bicoherence peak on the α spindle area induced with propofol Br. J. Anaesth 99 389–95 [DOI] [PubMed] [Google Scholar]
- [16].Nunez PL and Westdorp AF 1994. The surface Laplacian, high resolution EEG and controversies Brain Topogr. 6 221–6 [DOI] [PubMed] [Google Scholar]
- [17].Bandt C and Pompe B 2002. Permutation entropy: a natural complexity measure for time series Phys. Rev. Lett 88 174102. [DOI] [PubMed] [Google Scholar]
- [18].Friedman J, Hastie T and Tibshirani R 2001. The Elements of Statistical Learning Vol 1: Springer Series in Statistics (Cambridge: Cambridge University Press; ) [Google Scholar]
- [19].Ŕenyi A 1961. On measures of entropy and information Proc. Fourth Berkeley Symp. on Mathematical Statistics and Probability, Volume 1: Contributions to the Theory of Statistics (Berkeley, CA: University of California Press; ) [Google Scholar]
- [20].Richman JS and Moorman JR 2000. Physiological time-series analysis using approximate entropy and sample entropy Am. J. Physiol. Heart Circ. Physiol 278 H2039–49 [DOI] [PubMed] [Google Scholar]
- [21].Pincus SM 1991. Approximate entropy as a measure of system complexity Proc. Natl. Acad. Sci 88 2297–301 [DOI] [PMC free article] [PubMed] [Google Scholar]
- [22].Higuchi T 1988. Approach to an irregular time series on the basis of the fractal theory Physica D 31 277–83 [Google Scholar]
- [23].Vincent P and Bengio Y 2002. K-local hyperplane and convex distance nearest neighbor algorithms Adv. in Neural Inf. Proc. Syst. (NIPS) pp 985–92 [Google Scholar]
- [24].Prerau MJ, Brown RE, Bianchi MT, Ellenbogen JM and Purdon PL 2016. Sleep neurophysiological dynamics through the lens of multitaper spectral analysis Physiology 32 60–92 [DOI] [PMC free article] [PubMed] [Google Scholar]
- [25].Malarvili MB, Mesbah M and Boashash B 2006. Time-frequency analysis of heart rate variability for neonatal seizure detection Australas. Phys. Eng. Sci. Med 29 67–72 [PubMed] [Google Scholar]
- [26].Hjorth B 1970. EEG analysis based on time domain properties Electroencephalogr. Clin. Neurophysiol 29 306–10 [DOI] [PubMed] [Google Scholar]
- [27].Durbin R, Eddy SR, Krogh A and Mitchison G 1998. Biological Sequence Analysis: Probabilistic Models of Proteins and Nucleic Acids (Cambridge: Cambridge University Press; ) [Google Scholar]
- [28].Sun H, Jia J, Goparaju B, Huang GB, Sourina O, Bianchi MT and Westover MB 2017. Large-scale automated sleep staging Sleep 40 zsx139. [DOI] [PMC free article] [PubMed] [Google Scholar]
- [29].Kashkooli K, Polk SL, Chamadia S, Hahm E, Ethridge B, Gitlin J, Ibala R, Mekonnen J, Pedemonte J and Murphy JM 2019. Drug-specific models improve the performance of an EEG-based automated brain-state prediction system 2019 41st Annual Int. Conf. IEEE Eng. Med. Biol. Soc pp 5808–11 [DOI] [PMC free article] [PubMed] [Google Scholar]
- [30].Schueler S, Petersen CL, Ansermino JM, Merchant R and Gorges M 2018. The effect of ketamine on depth of hypnosis indices during total intravenous anesthesia–a comparative study using a novel case replay system Anesthesia and Analgesia (Philadelphia: Lippincott Williams & Wilkins; ) pp 107–8 [DOI] [PubMed] [Google Scholar]
- [31].Akeju O, Pavone K, Thum J, Firth P, Westover M, Puglia M, Shank E, Brown E and Purdon P 2015. Age-dependency of sevoflurane-induced electroencephalogram dynamics in children Br. J. Anaesth 115 i66–76 [DOI] [PMC free article] [PubMed] [Google Scholar]
- [32].Lee JM, Akeju O, Terzakis K, Pavone KJ, Deng H, Houle TT, Firth PG, Shank ES, Brown EN and Purdon PL 2017. A prospective study of age-dependent changes in propofol-induced electroencephalogram oscillations in children Anesthesiology 127 293–306 [DOI] [PubMed] [Google Scholar]