

Abstract
Bone loss and heightened fracture risk are common conditions associated with ageing in modern human populations and have been attributed to both hormonal and other metabolic and behavioural changes. To what extent these age-related trends are specific to modern humans or generally characteristic of natural populations of other taxa is not clear. In this study, we use computed tomography to examine age changes in long bone and vertebral structural properties of 34 wild-adult Virunga mountain gorillas (Gorilla beringei beringei) whose skeletons were recovered from natural accumulations. Chronological ages were known or estimated from sample-specific dental wear formulae and ranged between 11 and 43 years. Gorillas show some of the same characteristics of skeletal ageing as modern humans, including endosteal and some periosteal expansion. However, unlike in humans, there is no decline in cortical or trabecular bone density, or in combined geometric-density measures of strength, nor do females show accelerated bone loss later in life. We attribute these differences to the lack of an extended post-reproductive period in gorillas, which provides protection against bone resorption. Increases in age-related fractures (osteoporosis) in modern humans may be a combined effect of an extended lifespan and lower activity levels earlier in life.
This article is part of the theme issue ‘Evolution of the primate ageing process'.
Keywords: osteoporosis, skeletal ageing, bone strength, bone mineral density, gorilla
1. Introduction
Bone loss and remodelling with ageing are well-documented phenomena in modern human populations [1–6]. In long bone diaphyses, endosteal expansion, partially offset by subperiosteal expansion, leads to cortical thinning, while trabecular bone apparent (bulk) density decreases in epiphyseal regions and vertebrae. There is also some decline in compact bone density. These trends begin by the fourth or fifth decade of life for compact cortical bone and in the third or fourth decade for trabecular bone, and progress more rapidly in post-menopausal females (see the electronic supplementary material, figures S1 and S2). Bone loss with ageing leads to increased risk of fracture, particularly in the hip and vertebral regions, with a higher risk in females and in modern industrial populations [7,8].
These age patterns and the difference between the sexes have been related to two underlying physiological mechanisms, referred to as Type I (Post-menopausal) and Type II (Senile) Osteoporosis [7]. Type I Osteoporosis, usually present only among females, is caused by a sharp reduction in estrogen levels following menopause, resulting in relatively rapid bone loss due to the restraining effects of estrogen on bone resorption and its positive effects on bone formation [9]. Type II Osteoporosis is a more gradual cumulative process characteristic of both sexes that occurs throughout adulthood and may be attributed to reduced calcium absorption due to impaired production of vitamin D, among other factors [1]. The combined result of the two phenomena results in the observed rapid loss of bone among middle-aged females superimposed on more gradual losses in both sexes.
How these observations relate to broader evolutionary trends within hominins, including the evolution of an increased lifespan, a longer post-reproductive period, changes in lifestyle (especially activity level) and changes in diet, have been the subject of much discussion [10–14]. Comparisons of humans with our closest phylogenetic relatives—nonhuman primates—may shed light on the evolutionary timing and significance of these patterns.
Skeletal ageing in nonhuman primates has been examined by a number of investigators (for reviews, see [15–17]), most often in Old World monkeys, primarily macaques (e.g. [18–22]). Many of these investigations have demonstrated some age-related declines in bone mineral density (BMD) or relative cortical thickness that in some ways parallel those observed in humans. A potential limitation of most such studies is that they have been conducted on captive animals, where dietary supplementation as well as non-natural locomotor behaviour may affect patterns of skeletal ageing relative to those of wild populations [20,23,24]. Even in studies of macaques in more naturalistic environments [19,22], subjects were provisioned on commercial diets and had reduced home ranges compared to wild conspecifics [25].
Similar ageing studies of great apes have been much more limited. Several reports of skeletal age changes in wild chimpanzees (Pan troglodytes schweinfurthii) from Gombe, Tanzania have been presented [26–28]. Sample sizes were small (4–6 adult females, 2–5 adult males) and age estimates were approximate (to within about ±5 years) [27]. Old females had reduced diaphyseal bone mineral content (BMC), bone mineral index (BMC/bone width) and per cent cortical area. A study of BMD of the femoral neck and lumbar vertebrae of four P. t. schweinfurthii skeletons from Mahale, Tanzania showed much-reduced values in one old female [29]. A preliminary study of museum specimens aged qualitatively from dental wear found only slight age-related changes among chimpanzees and gorillas in trabecular density measured at several skeletal locations and cross-sectional geometric properties of the femur and humerus, although some medullary and periosteal expansion were noted among gorillas [30]. This is one of the only studies of skeletal ageing in nonhuman primates (also see [31]) that included geometric estimates of bone strength. Another limitation of almost all previous studies of bone density changes with ageing in nonhuman primates is that they have included only non-volumetric BMD measures, i.e. bone BMC divided by either bone width or two-dimensional area rather than volume, thus precluding estimates of true volumetric density (although see [21] for an exception).
In this study, we report the results of our analyses of 34 wild-adult Virunga mountain gorilla (Gorilla beringei beringei) skeletons with known ages or ages estimated using within-population dental wear or developmental standards. Age trends in diaphyseal cross-sectional geometric properties and volumetric bone mineral density (vBMD) of all of the major long bones are assessed. We also evaluate age-related changes in lumbar vBMD in 21 individuals. These data are used to address the following questions: (i) Do wild mountain gorillas show patterns of bone loss and remodelling with age that are similar to those of humans? (ii) Are the sex differences in these patterns observed in humans also characteristic of gorillas? (iii) How do these results inform our understanding of the biological mechanisms underlying skeletal ageing in gorillas, and the evolution of the modern human pattern of skeletal ageing?
2. Material and methods
(a). Study sample
All specimens were obtained from collections of the mountain gorilla skeletal project (MGSP), a multidisciplinary collaboration to assist the Rwanda Development Board's Department of Tourism and Conservation (RDB) in the recovery and preservation of skeletal remains from deceased gorillas from Volcanoes National Park in Rwanda [32]. Most individuals in the collection were members of habituated groups monitored in life by RDB or Dian Fossey Gorilla Fund International's Karisoke Research Center; health monitoring and postmortem examinations following their natural deaths were conducted by Gorilla Doctors.
Sixteen females and 17 males were included in long bone structural analyses. All individuals had fully erupted third molars. Sexes for all individuals and ages for 23 individuals were known to the exact day or month from records of the Rwanda Development Board and Dian Fossey Gorilla Fund International's Karisoke Research Center (Musanze, Rwanda). In three cases, uncertainty in birth date (and thus age) ranged between ±1.5 and ±4 years (see electronic supplementary material, table S1 for details). Ages for 10 other individuals were estimated from incisor tooth wear using population-specific formulae developed for the MGSP sample [33] and for one individual from dental developmental maturity [34]. One additional individual was included in lumbar vertebral but not long bone analyses; its age was estimated from tooth wear [33]. Age distributions by sex are shown in figure 1. Known or estimated ages ranged from 10.7 to 43.0 years. The lower end of this range corresponds to the age of sexual maturity and attainment of greater than 92–95% of the final adult body or arm length in females [35], while the upper end is at the maximum lifespan observed for Virunga mountain gorillas [17,36].
Figure 1.
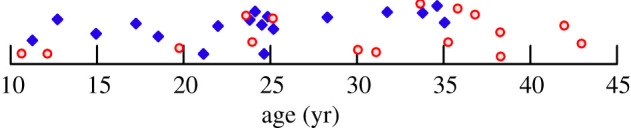
Age distribution of the Virunga sample. Red circles: females; blue diamonds: males. (Online version in colour.)
(b). Bone structural properties
Bone structural data were obtained using peripheral quantitative computed tomography (pQCT) [37] (Stratec XCT Research SA or SA+, 50 kVp, 13–45 mAs). The manufacturer's phantom was scanned prior to each session to establish calibration factors. After orientation in standardized anatomical planes [38], sections perpendicular to the long axis of the diaphysis were scanned at 50% of length' (interarticular length—see [38]) in the femur, tibia, radius and ulna, and 40% of length' from the distal end in the humerus (to avoid the deltoid tuberosity). L3 lumbar vertebrae were scanned through the vertebral body in a coronal plane, at the anteroposterior midpoint of the body. Scan resolutions ranged from 0.20 to 0.30 mm (0.35 mm for vertebrae), and slice thickness was a constant 1.0 mm. A bone-air threshold of 500 mg cm−3 was used for diaphyseal sections [39]. For vertebrae, a bone-air threshold of 0 mg cm−3 was used. Peripheral osteophytes and regions of periarticular sclerotic bone were manually trimmed. Trabecular bone was then isolated using the pQCT ‘Concentric Peel' method to remove the outer 20% of the total bone area, i.e. the cortical bone shell. Examples of vertebral sections are shown in electronic supplementary material, figure S3.
Diaphyseal structural properties examined here included total subperiosteal area (TA), medullary area (MA), cortical area (CA) and polar section modulus (Zp). Zp is a measure of torsional and (twice) average bending strength [40], and is therefore the most appropriate geometric parameter for assessing overall diaphyseal strength. In addition to analyses of Zp in individual sections, age changes in the ratio of femoral/humeral Zp were also assessed, as this index has been shown to relate to behaviour (degree of terrestriality/arboreality) in gorillas [39,41]. The ratio was logged, following previous protocols [38]. Volumetric cortical bone mineral density (vBMD, g/cm3: BMC/volume of cortical bone in the section) was also assessed. Finally, a pQCT parameter that combines Zp with bone mineral density distribution in the section, referred to as the polar ‘strength-strain index', or SSIp [37], was included in comparisons.
The vertebral parameter extracted from pQCT scans was volumetric trabecular BMD (vBMD), determined for the inner 80% of the vertebral body (see above and electronic supplementary material, figure S3). Vertebral BMD is highly correlated with vertebral strength [42]. All properties were calculated by internal pQCT software.
(c). Analyses
Least-squares regressions of structural parameter values against age were run for each property within sex. Both linear and quadratic models were tested, with the best fitting model chosen on the basis of improvement in adjusted squared multiple r and AIC (Akaike information criterion) values. A significance level of 0.05 was used in all analyses. Analysis of covariance was also used to assess whether there were any significant differences in the rate of change with age (regression slope) between sexes.
To test whether any secular effects or nonrandom sampling by age of body size characterized the sample, regressions of bone lengths and articular breadths on age were also carried out within sex. No significant (p < 0.05) or near-significant (p < 0.10) relationships with age were detected. Thus, there was no need to correct for body size in ageing analyses. All statistical analyses were carried out in SYSTAT [43]. All study data are included in electronic supplementary material, table S1.
3. Results
Results of the regressions of structural properties on age are given in table 1. (For a full listing of results for all sections, see electronic supplementary material, table S2.) All properties are better fit by linear regressions, except for MA of the ulna, which is better fit by a quadratic regression in both sexes. There are no significant differences in regression slopes between the sexes.
Table 1.
Age changes in bone structural properties.
| propertya | element | females |
males |
||||
|---|---|---|---|---|---|---|---|
| r | p | slope | r | p | slope | ||
| TA | femur | 0.592 | 0.016 | 3.95 | 0.258 | n.s. | |
| tibia | 0.573 | 0.020 | 2.05 | 0.318 | n.s. | ||
| humerus | n.s. | n.s. | |||||
| radius | n.s. | 0.535 | 0.027 | 1.33 | |||
| ulna | n.s. | n.s. | |||||
| MA | femur | 0.654 | 0.006 | 2.72 | 0.619 | 0.008 | 4.06 |
| tibia | 0.697 | 0.003 | 1.43 | 0.476 | 0.053 | 1.45 | |
| humerus | n.s. | n.s. | |||||
| radius | 0.535 | 0.027 | 0.85 | 0.556 | 0.020 | 1.33 | |
| ulnab | 0.754 | 0.002 | 0.597 | 0.018 | |||
| CA | all | n.s. | n.s. | ||||
| Zp | femur | 0.517 | 0.040 | 27.0 | n.s. | ||
| tibia | 0.522 | 0.038 | 10.7 | n.s. | |||
| humerus | n.s | n.s. | |||||
| radius | n.s. | n.s. | |||||
| ulna | n.s | n.s | |||||
| fem/humc | 0.758 | 0.001 | 0.006 | n.s. | |||
| SSIp | all | n.s. | n.s. | ||||
| Cort. vBMD | all | n.s | n.s. | ||||
| Trab. vBMD | L3 | n.s. | n.s. | ||||
aTA, subperiosteal area; MA, medullary area; CA, cortical area; Zp, polar section modulus; SSI, strength-strain index. Areas in mm2, Zp and SSIp in mm3. Cort., cortical; Trab., trabecular; vBMD, volumetric bone mineral density (g/cm3).
bQuadratic fit. R is adjusted for multiple predictor variables. Regression coefficients: females: 2.26 (age), 0.10 (age2); males: 1.70 (age), 0.16 (age2).
cLn(femur Zp/humerus Zp).
All diaphyseal sections except in the humerus show a significant increase with age in MA, i.e. endosteal expansion, in both sexes. Total subperiosteal area (TA) increases significantly with age in the femur and tibia among females and in the radius among males. Cortical area (CA) shows no significant age changes in any section. Plots of TA, MA and CA against age are shown in figure 2 for the femoral midshaft (50%) section.
Figure 2.

Age changes in femoral midshaft areas in: (a) females and (b) males. TA (orange squares), total subperiosteal area; MA (purple triangles), medullary area; CA (green circles), cortical area. Least-squares regression lines plotted for significant regressions (table 1). (Online version in colour.)
The polar section modulus, Zp, increases significantly with age in the femur and tibia among females, paralleling age changes in TA. Males show no significant age change in Zp for any section. A plot of femoral Zp versus age is shown in figure 3a. There is no significant age change in the SSIp parameter, which combines geometric and density properties, in any section in either sex.
Figure 3.

Age changes in section moduli and mineral densities. Red circles, females; blue diamonds, males. Least-squares regression lines plotted for significant regressions (table 1). (a) Femoral midshaft polar section modulus. (b) Log-transformed ratio of femoral to humeral polar section modulus. (c) Femoral midshaft cortical volumetric bone mineral density. (d) L3 vertebra trabecular volumetric bone mineral density. (Online version in colour.)
Among females, the log ratio of femoral to humeral Zp increases significantly with age (figure 3b), i.e. femoral to humeral strength increases in older females. The regression on age is strongly affected by low values for the two youngest (10–11 years old) females; however, the age trend is still significant (p < 0.03) if these individuals are removed. No similar age trend is apparent in males.
Neither cortical vBMD in diaphyseal sections nor trabecular vBMD in the L3 vertebral body shows any significant change with age in either sex (table 1 and figure 3c,d). There are two high outliers—one male and one female—for vertebral vBMD at approximately 25 years of age (figure 3d). Although peripheral osteophytes and periarticular sclerotic bone were removed prior to analysis, as described above (also see electronic supplementary material, figure S3b), these two specimens exhibit some areas of sclerotic (hypermineralized) trabecular bone within the vertebral body. Removal of these individuals does not appreciably affect regression statistics.
4. Discussion
A qualitative summary of ageing trends for different bone structural properties in humans and mountain gorillas is given in table 2. Results for humans are based on references given in the text and for mountain gorillas from the present study (table 1 and electronic supplementary material, table S3). This simplified presentation glosses over differences in the timing of events (e.g. the earlier initiation of trabecular versus a compact cortical bone loss in humans) as well as between the sexes (e.g. human females show more medullary expansion than males), but encapsulates general contrasts between the two taxa.
Table 2.
Qualitative comparison of skeletal ageing trends in humans and gorillas.
| propertya | humansb | gorillasb |
|---|---|---|
| TA | +/0 | +/0 |
| MA | + | + |
| CA | 0/– | 0 |
| %CA | – | – |
| Zp | +/0 | +/0 |
| SSIp | – | 0 |
| Cort. vBMD | – | 0 |
| Trab. vBMD | – | 0 |
aSee table 1 for property definitions. %CA, CA/TA (see electronic supplementary material, table S3).
b+ increases with age; 0 no change with age; − decreases with age. Dual trends = mixed results in different studies or skeletal locations.
As shown in table 2, Virunga mountain gorillas exhibit some features of skeletal ageing that are similar to those observed in humans. Endosteal resorption leads to a medullary expansion in long bone diaphyses. Some concurrent subperiosteal expansion also takes place, reaching statistical significance in some sections. Together the two trends lead to relative cortical thinning, i.e. reductions in cortical area and thickness relative to external dimensions, especially in females (see electronic supplementary material, table S3). All of these trends have been observed in many living and recent archaeological human samples [1,4–6,44–50]. Reported age trends in diaphyseal cortical area and section moduli (or second moments of area, closely related to section moduli [40]) in humans have been more variable, with both declines and no change or increases observed, varying by skeletal region and potentially related to the degree of mechanical loading [2,44,45,47]. Mountain gorillas show no change in cortical area and no change or an increase in section moduli with ageing, so fall within the continuum of modern humans in terms of geometric remodelling of the diaphysis.
However, mountain gorillas also exhibit some marked differences in patterns of skeletal ageing compared to modern humans. First, mountain gorillas do not decline in bone cortical or trabecular density with ageing, whereas humans consistently do [1–5,44,51,52]. Subperiosteal expansion, leading to stable or increasing geometric parameters of bone strength and rigidity (section moduli and second moments of an area) despite endosteal resorption and cortical thinning, has been seen as partially compensatory to declines in cortical density in humans [4,5,44]. However, combined measures of diaphyseal strength incorporating both geometry and bone mineral density (the ‘strength-strain index', SSI, or equivalent) still decline with age in older human females (and to a lesser extent in males) [2,4,5,44]. By contrast, gorillas show no change in SSIp throughout life in any long bone. Trabecular bone density, strongly related to strength [42], also consistently declines in humans (males and females) in both lumbar vertebrae [1,53] and peripheral bone sites [2,4], whereas it is again stable throughout life in gorillas (in vertebrae). Thus, mountain gorillas show no evidence for a decline in bone strength with ageing.
Second, unlike in humans, there is no evidence that gorilla females suffer greater loss of bone with ageing than gorilla males. Where the sexes have been compared, human females consistently decline more in cortical area and cortical and trabecular bone density than males, with accelerating losses after menopause ([1,4], also see electronic supplementary material, figures S1 and S2). Gorillas show no sex differences in bone loss with ageing, and female gorillas actually exhibit more evidence for positive trends in subperiosteal areas and section moduli.
Differences in hormonal changes with age likely provide the primary explanation for observed differences in skeletal ageing patterns between humans and gorillas. A reduction in estrogen levels following menopause is the predominant factor leading to accelerated bone loss in older human females (Type I Osteoporosis, [9]). While changes in estrogen levels with ageing have not been directly assessed in mountain gorillas, the post-reproductive period in mountain gorillas, as in other nonhuman primates [54], is very short relative to total lifespan [54,55], although fecundity does decline with age [55,56]. Six of the eight gorilla females in the present study over 30 years of age with available reproductive data had given birth within 5.5 years of death, including the oldest female in the sample (43 years). Data for captive Western lowland gorillas are similar, where all observed females up to 37 years of age had menstrual cycles and most older individuals continued cycling [57]. Thus, it is likely that the protective effects of estrogen against bone loss are maintained in most gorilla females into very old age. Type II Osteoporosis, the slow cumulative loss of bone throughout much of adult life in humans of both sexes [1,9], also does not appear to characterize mountain gorillas. Type II Osteoporosis may be attributable to reduced efficiency of calcium absorption (also see below) as well as hormonal and other factors, including reduced activity level [9]. Variation in activity level and mechanical loading has been suggested to account for at least some of the variation in the geometric remodelling of bone with age observed in human populations [47]. Although overall activity level may decline with ageing in gorillas, as in chimpanzees [26], it is likely that mechanical loading of the skeleton remains above that of more sedentary older modern humans, helping to maintain bone strength.
The observed increase in femoral to humeral strength in mountain gorilla females, but not males, does suggest a sex-specific change in behaviour with ageing, however. Broader comparisons among gorillas indicate that a higher femoral/humeral strength ratio is associated with greater terrestriality, i.e. less use of the trees and thus reduced mechanical loading of the forelimb [41]. Ontogenetic studies also show an increase in this ratio after about 2 years of age in mountain gorillas, when they begin to spend more time on the ground [41,58]. Our current results thus suggest that older adult female mountain gorillas may climb trees less often than younger adult females. A preliminary study of substrate use in Virunga gorillas [59] shows a decline in arboreal bouts after age 8 in females, but not males (electronic supplementary material, figure S4), consistent with this interpretation. This also implies that a sex difference in behaviour previously observed among adult Virunga gorillas, whereby females were more arboreal [58], is characteristic only of young adults (and late adolescents), not older adults, i.e. that locomotor/positional behaviour in the sexes converges towards greater terrestriality with ageing. Avoidance of climbing has also been noted for older chimpanzees from Gombe [26].
The increase in femoral/humeral strength with ageing in female gorillas can be attributed to more positive age changes in the femur in subperiosteal area and section modulus (table 1). This raises the broader question of whether mode of locomotion, for example, bipedality versus quadrupedality, may affect patterns of bone loss and remodelling. One long-term longitudinal study of modern human females found more positive geometric remodelling with ageing in the lower than the upper limb [45], suggesting that there may be a role of weight-bearing in preserving and enhancing bone structural properties. However, another longitudinal study of the radius in post-menopausal women found significant increases in geometric properties, indicating that human upper limb bones may also remodel to (partially) preserve bone strength [44]. Mode of locomotion does affect limb bone strength proportions among primates, both phylogenetically and across ontogeny [38,60–62]. That is, whether weight-bearing or not, bones are adapted to their customary mechanical loadings. Thus, changes in these loadings are likely to influence patterns of bone remodelling, as appears to be the case in adult female mountain gorillas.
Our general ageing results are somewhat at variance with two previous studies of chimpanzees, which reported reduced values for cortical area, BMC and BMD in old females [26–29]. However, as noted earlier, sample sizes in these studies were quite small (1–2 old females in each) and ages were estimated within broad limits. Our results are more similar to a preliminary museum study of larger samples of both chimpanzees and gorillas [30], which found modest if any age-related reductions in bone density or area. No previous study of nonhuman primates has included combined geometric-density measurements of bone strength.
The differences in skeletal ageing patterns between mountain gorillas and humans and their relationship to reproductive strategies raise some interesting broader evolutionary issues. Osteoporosis in humans is one of a number of traits that has been suggested to possibly result from differing physiological trade-offs among younger and older adults, with adaptations that are favourable during the reproductive period becoming unfavourable post-reproductively when selection pressures are reduced (a form of antagonistic pleiotropy) [12,63]. In the case of bone loss from the skeleton, available mechanisms for activating the release of calcium are critical during pregnancy and lactation to supply the growing fetus and infant, but may be maladaptive later in life with the changing hormonal environment and loss of the protective effects of estrogen [64]. Because of their very short post-reproductive period, gorilla females are not exposed to this environment and are thus largely protected from Type I Osteoporosis. During pregnancy in humans, levels of 1,25-dihydroxyvitamin D increase, enhancing intestinal absorption of calcium [64]. Because reduced levels of vitamin D and impaired calcium absorption with ageing contribute to Type II Osteoporosis [7], continued reproduction into old age in gorillas may also help protect against this mechanism of bone loss, if they undergo the same physiological changes.
Calcium bioavailability is another factor that could influence bone loss or maintenance during the adult lifespan [65]. A study of mountain gorillas in Bwindi Impenetrable National Park, Uganda, found that levels of calcium in the diet were well over those considered to be nutritionally adequate [66], although another study in the same area found that calcium/phosphorus ratios were unbalanced, possibly inhibiting the absorption of phosphorus [67] (but not calcium—see [65]). It is generally believed that levels of calcium in the diet were much higher in early (pre-agricultural) humans than in most modern populations [11,65]. The role of relatively low levels of dietary calcium in promoting osteoporosis in modern humans is contentious [68], but this may also contribute to the observed differences (e.g. in bone mineral density ageing patterns) between gorillas and modern humans, if gorillas are better nourished in this respect. More studies of dietary interactions in wild gorillas and other primates are needed to further evaluate this possibility.
In terms of increased fracture prevalence in older modern humans, the greater lifespan of humans relative to gorillas and other nonhuman primates may also be a factor by providing more absolute time for age-related fractures to accumulate. However, as noted earlier, declines in some bone structural parameters begin in the third and fourth decades in humans [2,3], well within the lifespan of mountain gorillas, while gorillas show no evidence of any such declines. A combination of both living longer and more negative changes in bone structure during that process likely accounts for the increased prevalence of osteoporotic fractures in humans.
The evolution of an increased lifespan and post-reproductive period thus involved some increased skeletal risks for humans, compared to some of our closest phylogenetic relatives. However, in terms of fracture incidence in old age, the risk may have been lower in earlier human populations than in modern, more sedentary populations. Bone loss with ageing is well documented in early historic and archaeological human skeletal samples [48–52]; however, evidence for age-related fractures in samples prior to the past few 100 years is relatively rare [10,49,69,70] (although see [50]). This may be partly a function of difficulty in recognizing such fractures, along with reduced average lifespans [10,69], but it may also result from the development of more advantageous bone structural properties prior to middle and old age (e.g. see [70]). The importance of achieving a high peak bone mass (or strength) early in adulthood, in order to prepare for losses later in life, has been emphasized by many researchers (e.g. [9,71]). Declines in skeletal structural parameters related to bone strength occurred with the adoption of more sedentary lifestyles during the Holocene [72,73]. Even today, geographic variation in age-related fractures parallels variation in activity level [8]. Greater vulnerability to age-related fractures among many modern human populations may be the combined result of both an unusual life history involving a long post-reproductive period during which bone is lost, and a less active lifestyle that stimulates less bone apposition earlier in life.
5. Conclusion
Wild Virunga mountain gorilla adults demonstrate some of the same age-related trends in long bone diaphyseal structure observed among humans, including endosteal resorption coupled with some periosteal apposition. However, unlike humans, mountain gorillas do not decline with age in either cortical or vertebral trabecular bone density, thereby preserving bone strength into old age. There is also no sex difference in patterns of skeletal ageing in gorillas (except for a more positive change in bending strength in some sections in females), in contrast with humans. The difference in skeletal ageing trajectories between the taxa is likely attributable to the lack of a significant post-reproductive period in gorillas, possibly also in combination with an active lifestyle. Studies such as this one of phylogenetically and physiologically close taxa living under natural conditions are valuable in highlighting the distinctiveness of the modern human ageing pattern and its evolutionary context.
Supplementary Material
Supplementary Material
Supplementary Material
Acknowledgements
We gratefully acknowledge the Rwandan government for permission to study skeletal remains curated by the Mountain Gorilla Skeletal Project, and the continuous efforts of researchers, staff and students from the Rwanda Development Board's Department of Tourism and Conservation, Gorilla Doctors, Dian Fossey Gorilla Fund International, the George Washington University, New York University College of Dentistry, Institute of National Museums of Rwanda and other universities in Rwanda and the USA and Europe who have contributed towards supporting the MGSP skeletal collection. We also thank Nadia Niyonizeye, Jordi Galbany and Beth Kaplan for making available unpublished behavioural data.
Data accessibility
All data used in this study are available in electronic supplementary material, table S1.
Authors' contributions
C.B.R. and S.C.M. designed the study; C.B.R. and J.A.J. collected bone structural data; W.E., K.G. and A.M. collected demographic data; S.C.M. supervised collection and processing of skeletal specimens; C.B.R. carried out statistical analyses and wrote the paper; S.C.M., W.E. and K.G. provided critical comments on the paper.
Competing interests
We declare we have no competing interests.
Funding
Research funding and other support for this project was provided by the National Science Foundation (BCS 0852866, 0964944, 1520221, 1316104 and 1419564), L.S.B. Leakey Foundation, National Geographic Society Committee for Research and Exploration (8486-08), the University of Oulu and the Cleveland Metroparks Zoo.
References
- 1.Riggs BL, et al. 2004. Population-based study of age and sex differences in bone volumetric density, size, geometry, and structure at different skeletal sites. J. Bone Miner. Res. 19, 1945–1954. ( 10.1359/JBMR.040916) [DOI] [PubMed] [Google Scholar]
- 2.Lauretani F, Bandinelli S, Griswold ME, Maggio M, Semba R, Guralnik JM, Ferrucci L. 2008. Longitudinal changes in BMD and bone geometry in a population-based study. J. Bone Miner. Res. 23, 400–408. ( 10.1359/jbmr.071103) [DOI] [PMC free article] [PubMed] [Google Scholar]
- 3.Riggs BL, Melton LJ, Robb RA, Camp JJ, Atkinson EJ, McDaniel L, Amin S, Rouleau PA, Khosla S. 2008. A population-based assessment of rates of bone loss at multiple skeletal sites: evidence for substantial trabecular bone loss in young adult women and men. J. Bone Miner. Res. 23, 205–214. ( 10.1359/jbmr.071020) [DOI] [PMC free article] [PubMed] [Google Scholar]
- 4.Russo CR, Lauretani F, Bandinelli S, Bartali B, Di Iorio A, Volpato S, Guralnik JM, Harris T, Ferrucci L. 2003. Aging bone in men and women: beyond changes in bone mineral density. Osteoporos. Int. 14, 531–538. ( 10.1007/s00198-002-1322-y) [DOI] [PubMed] [Google Scholar]
- 5.Stathopoulos KD, Zoubos AB, Papaioannou NA, Mastrokalos D, Galanos A, Papagelopoulos PJ, Skarantavos G. 2016. Differences of bone mineral mass, volumetric bone mineral density, geometrical and structural parameters and derived strength of the tibia between premenopausal and postmenopausal women of different age groups: a peripheral Quantitative Computed Tomography (pQCT) study. J. Musculoskelet. Neuron. Interact. 16, 113–121. [PMC free article] [PubMed] [Google Scholar]
- 6.Garn SM. 1970. The earlier gain and the later loss of cortical bone. Springfield, MA: Charles C. Thomas. [Google Scholar]
- 7.Riggs BL, Melton LJ III. 1986. Involutional osteoporosis. New Eng. J. Med. 314, 1676–1686. ( 10.1056/NEJM198606263142605) [DOI] [PubMed] [Google Scholar]
- 8.Chalmers J, Ho KC. 1970. Geographical variations in senile osteoporosis. The association with physical activity. J. Bone Joint Surg. 52B, 667–675. [PubMed] [Google Scholar]
- 9.Khosla S. 2013. Pathogenesis of age-related bone loss in humans. J. Gerontol. A Biol. Sci. Med. Sci. 68, 1226–1235. ( 10.1093/gerona/gls163) [DOI] [PMC free article] [PubMed] [Google Scholar]
- 10.Agarwal SC. 2019. Understanding bone aging, loss, and osteoporosis in the past. In Biological anthropology of the human skeleton, 3rd edn (eds Katzenburg MA, Grauer AL), pp. 385–414. New York, NY: John Wiley and Sons, Inc. [Google Scholar]
- 11.Eaton SB, Nelson DA. 1991. Calcium in evolutionary perspective. Am. J. Clin. Nutr. 54, 281S–287S. ( 10.1093/ajcn/54.1.281S) [DOI] [PubMed] [Google Scholar]
- 12.Madimenos FC. 2015. An evolutionary and life-history perspective on osteoporosis. Annu. Rev. Anthropol. 44, 189–206. ( 10.1146/annurev-anthro-102214-013954) [DOI] [Google Scholar]
- 13.Nelson DA, Sauer NJ, Agarwal SC. 2003. Evolutionary aspects of bone health. Clin. Rev. Bone Min. Metabol. 3/4, 169–179. ( 10.1385/BMM:1:3-4:169) [DOI] [Google Scholar]
- 14.Pfeiffer SK, Lazenby RA. 1994. Low bone mass in past and present aboriginal populations. In Advances in nutritional research, vol. 9 (ed. Draper HH.), pp. 35–51. New York, NY: Plenum. [DOI] [PubMed] [Google Scholar]
- 15.Black A, Lane MA. 2002. Nonhuman primate models of skeletal and reproductive aging. Gerontology 48, 72–80. ( 10.1159/000048930) [DOI] [PubMed] [Google Scholar]
- 16.Jerome CP, Peterson PE. 2001. Nonhuman primate models in skeletal research. Bone 29, 1–6. ( 10.1016/s8756-3282(01)00477-x) [DOI] [PubMed] [Google Scholar]
- 17.Lowenstine LJ, McManamon R, Terio KA. 2016. Comparative pathology of aging great apes: bonobos, chimpanzees, gorillas, and orangutans. Vet. Pathol. 53, 250–276. ( 10.1177/0300985815612154) [DOI] [PubMed] [Google Scholar]
- 18.Black A, Tilmont EM, Handy AM, Scott WW, Shapses SA, Ingram DK, Roth GS, Lane MA. 2001. A nonhuman primate model of age-related bone loss: a longitudinal study in male and premenopausal female rhesus monkeys. Bone 28, 295–302. ( 10.1016/s8756-3282(00)00452-x) [DOI] [PubMed] [Google Scholar]
- 19.Cerroni AM, Tomlinson GA, Turnquist JE, Grynpas MD. 2000. Bone mineral density, osteopenia, and osteoporosis in the rhesus macaques of Cayo Santiago. Am. J. Phys. Anthropol. 113, 389–410. () [DOI] [PubMed] [Google Scholar]
- 20.Colman RJ, Kemnitz JW, Lane MA, Abbott DH, Binkley N. 1999. Skeletal effects of aging and menopausal status in female rhesus macaques. J. Clin. Endocrinol. Metab. 84, 4144–4148. ( 10.1210/jcem.84.11.6151) [DOI] [PubMed] [Google Scholar]
- 21.Pomchote P. 2015. Age-related changes in osteometry, bone mineral density and osteophytosis of the lumbar vertebrae in Japanese macaques. Primates 56, 55–70. ( 10.1007/s10329-014-0448-9) [DOI] [PubMed] [Google Scholar]
- 22.DeRousseau CJ. 1985. Aging in the musculoskeletal system of rhesus monkeys: III. Bone loss. Am. J. Phys. Anthropol. 68, 157–167. ( 10.1002/ajpa.1330680203) [DOI] [PubMed] [Google Scholar]
- 23.Champ JE, Binkley N, Havighurst T, Colman RJ, Kemnitz JW, Roecker EB. 1996. The effect of advancing age on bone mineral content of female rhesus monkeys. Bone 19, 485–492. ( 10.1016/s8756-3282(96)00243-8) [DOI] [PubMed] [Google Scholar]
- 24.DeRousseau CJ. 1994. Primate gerontology: an emerging discipline. In Biological anthropology and aging: perspectives on human variation over the life span (eds Crews DE, Garruto RM), pp. 127–153. New York, NY: Oxford University Press. [Google Scholar]
- 25.Maestripieri D, Hoffman CL. 2012. Behavior and social dynamics of rhesus macaques on Cayo Santiago. In Bones, genetics, and behavior of rhesus macaques (ed. Wang Q.), pp. 247–262. New York, NY: Springer. [Google Scholar]
- 26.Morbeck ME, Galloway A, Sumner DR. 2002. Getting old at Gombe: skeletal aging in wild-ranging chimpanzees. In Aging in nonhuman primates (Interdisciplinary topics in gerontology, vol. 31), (eds Erwin JM, Hof PR), pp. 1–21. Basel, Switzerland: Karger. [Google Scholar]
- 27.Sumner DR, Morbeck ME, Lobick JJ. 1989. Apparent age-related bone loss among adult female Gombe chimpanzees. Am. J. Phys. Anthropol. 79, 225–234. ( 10.1002/ajpa.1330790210) [DOI] [PubMed] [Google Scholar]
- 28.Zihlman AL, Morbeck ME, Goodall J. 1990. Skeletal biology and individual life-history of Gombe chimpanzees. J. Zool. 221, 37–61. ( 10.1111/j.1469-7998.1990.tb03773.x) [DOI] [Google Scholar]
- 29.Gunji H, Hosaka K, Huffman MA, Kawanaka K, Matsumoto-Oda A, Hamada Y, Nishida T. 2003. Extraordinarily low bone mineral density in an old female chimpanzee (Pan troglodytes schweinfurthii) from the Mahale Mountains National Park. Primates 44, 145–149. ( 10.1007/s10329-002-0030-8) [DOI] [PubMed] [Google Scholar]
- 30.Ohman JC, Mensforth RP, Latimer B. 1997. Age-related osteoporosis in Gorilla gorilla and Pan troglodytes. Am. J. Phys. Anthrop. 24(Suppl.), 181. [Google Scholar]
- 31.Kimura T. 1994. Age changes of postcranial skeletons in adult Japanese macaques. Anthropol. Sci. 102, 27–41. ( 10.1537/ase.102.Supplement_27) [DOI] [Google Scholar]
- 32.McFarlin SC, et al. 2009. Recovery and preservation of a mountain gorilla skeletal resource in Rwanda. Am. J. Phys. Anthropol. 48, 187–188. [Google Scholar]
- 33.Galbany J, Muhire T, Vecellio V, Mudakikwa A, Nyiramana A, Cranfield MR, Stoinski TS, McFarlin SC. 2018. Incisor tooth wear and age determination in mountain gorillas from Volcanoes National Park, Rwanda. Am. J. Phys. Anthropol. 167, 930–935. ( 10.1002/ajpa.23720) [DOI] [PubMed] [Google Scholar]
- 34.Kralick AE, et al. 2017. A radiographic study of permanent molar development in wild Virunga mountain gorillas of known chronological age from Rwanda. Am. J. Phys. Anthropol. 163, 129–147. ( 10.1002/ajpa.23192) [DOI] [PubMed] [Google Scholar]
- 35.Galbany J, Abavandimwe D, Vakiener M, Eckardt W, Mudakikwa A, Ndagijimana F, Stoinski TS, McFarlin SC. 2017. Body growth and life history in wild mountain gorillas (Gorilla beringei beringei) from Volcanoes National Park, Rwanda. Am. J. Phys. Anthropol. 163, 570–590. ( 10.1002/ajpa.23232) [DOI] [PubMed] [Google Scholar]
- 36.Bronikowski AM, et al. 2011. Aging in the natural world: comparative data reveal similar mortality patterns across primates. Science 331, 1325–1328. ( 10.1126/science.1201571) [DOI] [PMC free article] [PubMed] [Google Scholar]
- 37.Ferretti JL, Capozza RF, Zanchetta JR. 1996. Mechanical validation of a tomographic (pQCT) index for noninvasive estimation of rat femur bending strength. Bone 18, 97–102. ( 10.1016/8756-3282(95)00438-6) [DOI] [PubMed] [Google Scholar]
- 38.Ruff CB. 2002. Long bone articular and diaphyseal structure in Old World monkeys and apes, I: locomotor effects. Am. J. Phys. Anthropol. 119, 305–342. ( 10.1002/ajpa.10117) [DOI] [PubMed] [Google Scholar]
- 39.Ruff CB, Burgess ML, Bromage TG, Mudakikwa A, McFarlin SC. 2013. Ontogenetic changes in limb bone structural proportions in mountain gorillas (Gorilla beringei beringei). J. Hum. Evol. 65, 693–703. ( 10.1016/j.jhevol.2013.06.008) [DOI] [PubMed] [Google Scholar]
- 40.Ruff CB. 2019. Biomechanical analyses of archaeological human skeletal samples. In Biological anthropology of the human skeleton, 3rd edn (eds Katzenburg MA, Grauer AL), pp. 189–224. New York, NY: John Wiley and Sons, Inc. [Google Scholar]
- 41.Ruff CB, Burgess ML, Junno J-A, Mudakikwa A, Zollikofer PE, Ponce de Leon MS, McFarlin SC. 2018. Phylogenetic and environmental effects on limb bone structure in gorillas. Am. J. Phys. Anthropol. 166, 353–372. ( 10.1002/ajpa.23437) [DOI] [PubMed] [Google Scholar]
- 42.Ammann P, Rizzoli R. 2003. Bone strength and its determinants. Osteoporos. Int. 14(Suppl 3), S13–S18. ( 10.1007/s00198-002-1345-4) [DOI] [PubMed] [Google Scholar]
- 43.SYSTAT Software Inc. 2009 SYSTAT 13. Chicago, IL: SYSTAT Software, Inc. [Google Scholar]
- 44.Ahlborg HG, Johnell O, Turner CH, Rannevik G, Karlsson MK. 2003. Bone loss and bone size after menopause. N. Engl. J. Med. 349, 327–334. ( 10.1056/NEJMoa022464) [DOI] [PubMed] [Google Scholar]
- 45.Heaney RP, Barger-Lux MJ, Davies KM, Ryan RA, Johnson ML, Gong G. 1997. Bone dimensional change with age: interactions of genetic, hormonal, and body size variables. Osteoporos. Int. 7, 426–431. ( 10.1007/pl00004150) [DOI] [PubMed] [Google Scholar]
- 46.Ruff CB, Hayes WC. 1983. Cross-sectional geometry of Pecos Pueblo femora and tibiae—a biomechanical investigation. II. Sex, age, and side differences. Am. J. Phys. Anthropol. 60, 383–400. ( 10.1002/ajpa.1330600309) [DOI] [PubMed] [Google Scholar]
- 47.Ruff CB, Hayes WC. 1988. Sex differences in age-related remodeling of the femur and tibia. J. Orthop. Res. 6, 886–896. ( 10.1002/jor.1100060613) [DOI] [PubMed] [Google Scholar]
- 48.Carlson DS, Armelagos GJ, VanGerven DP. 1976. Patterns of age-related cortical bone loss (osteoporosis) within the femoral diaphysis. Hum. Biol. 48, 295–314. [PubMed] [Google Scholar]
- 49.Mays SA. 1999. Osteoporosis in earlier human populations. J. Clin. Densitom. 2, 71–78. [DOI] [PubMed] [Google Scholar]
- 50.Mays SA. 2006. Age-related cortical bone loss in women from a 3rd-4th century AD population from England. Am. J. Phys. Anthropol. 129, 518–528. ( 10.1002/ajpa.20365) [DOI] [PubMed] [Google Scholar]
- 51.Kneissel M, Boyde A, Hahn M, Teschler-Nicola M, Kalchhauser G, Plenk H Jr. 1994. Age- and sex-dependent cancellous bone changes in a 4000y BP population. Bone 15, 539–545. ( 10.1016/8756-3282(94)90278-x) [DOI] [PubMed] [Google Scholar]
- 52.Kneissel M, Roschger P, Steiner W, Schamall D, Kalchhauser G, Boyde A, Teschler-Nicola M. 1997. Cancellous bone structure in the growing and aging lumbar spine in a historic Nubian population. Calcif. Tissue Int. 61, 95–100. ( 10.1007/s002239900302) [DOI] [PubMed] [Google Scholar]
- 53.Agarwal SC, Grynpas MD. 2009. Measuring and interpreting age-related loss of vertebral bone mineral density in a medieval population. Am. J. Phys. Anthropol. 139, 244–252. ( 10.1002/ajpa.20977) [DOI] [PubMed] [Google Scholar]
- 54.Alberts SC, et al. 2013. Reproductive aging patterns in primates reveal that humans are distinct. Proc. Natl Acad. Sci. USA 110, 13 440–13 445. ( 10.1073/pnas.1311857110) [DOI] [PMC free article] [PubMed] [Google Scholar]
- 55.Robbins AM, Robbins MM, Gerald-Steklis N, Steklis HD. 2006. Age-related patterns of reproductive success among female mountain gorillas. Am. J. Phys. Anthropol. 131, 511–521. ( 10.1002/ajpa.20474) [DOI] [PubMed] [Google Scholar]
- 56.Habumuremyi S, Stephens C, Fawcett KA, Deschner T, Robbins MM. 2016. Endocrine assessment of ovarian cycle activity in wild female mountain gorillas (Gorilla beringei beringei). Physiol. Behav. 157, 185–195. ( 10.1016/j.physbeh.2016.02.017) [DOI] [PubMed] [Google Scholar]
- 57.Atsalis S, Margulis SW. 2006. Sexual and hormonal cycles in geriatric Gorilla gorilla gorilla. Int. J. Primatol. 27, 1663–1687. ( 10.1007/s10764-006-9097-1) [DOI] [Google Scholar]
- 58.Doran DM. 1997. Ontogeny of locomotion in mountain gorillas and chimpanzees. J. Hum. Evol. 32, 323–344. ( 10.1006/jhev.1996.0095) [DOI] [PubMed] [Google Scholar]
- 59.Niyonizeye N. 2017. Arboreality in mountain gorillas from the Volcanoes National Park, Rwanda. BA thesis, University of Rwanda, Butare. [Google Scholar]
- 60.Ruff CB. 2003. Ontogenetic adaptation to bipedalism: age changes in femoral to humeral length and strength proportions in humans, with a comparison to baboons. J. Hum. Evol. 45, 317–349. ( 10.1016/j.jhevol.2003.08.006) [DOI] [PubMed] [Google Scholar]
- 61.Ruff CB, Harper CM, Goldstein DM, Daegling DJ, McGraw WS. 2019. Long bone structural proportions and locomotor behavior in Cercopithecidae. J. Hum. Evol. 132, 47–60. ( 10.1016/j.jhevol.2019.04.003) [DOI] [PubMed] [Google Scholar]
- 62.Sarringhaus LA, MacLatchy LM, Mitani JC. 2016. Long bone cross-sectional properties reflect changes in locomotor behavior in developing chimpanzees. Am. J. Phys. Anthropol. 160, 16–29. ( 10.1002/ajpa.22930) [DOI] [PubMed] [Google Scholar]
- 63.Carter AJ, Nguyen AQ. 2011. Antagonistic pleiotropy as a widespread mechanism for the maintenance of polymorphic disease alleles. BMC Med. Genet. 12, 160 ( 10.1186/1471-2350-12-160) [DOI] [PMC free article] [PubMed] [Google Scholar]
- 64.Galloway A. 1997. The cost of reproduction and the evolution of postmenopausal osteoporosis. In The evolving female: a life-history perspective (eds Morbeck ME, Galloway A, Zihlman A), pp. 132–146. Princeton, NJ: Princeton University Press. [Google Scholar]
- 65.Heaney RP. 2013. Nutrition and risk for osteoporosis. In Osteoporosis, 4th edn (eds Marcus R, Feldman D, Dempster DW, Luckey M, Cauley JA), pp. 64–681. Amsterdam, The Netherlands: Elsevier. [Google Scholar]
- 66.Rothman JM, Dierenfeld ES, Hintz HF, Pell AN. 2008. Nutritional quality of gorilla diets: consequences of age, sex, and season. Oecologia 155, 111–122. ( 10.1007/s00442-007-0901-1) [DOI] [PubMed] [Google Scholar]
- 67.Cancelliere EC, DeAngelis N, Nkurunungi JB, Raubenheimer D, Rothman JM. 2014. Minerals in the foods eaten by mountain gorillas (Gorilla beringei). PLoS ONE 9, e112117 ( 10.1371/journal.pone.0112117) [DOI] [PMC free article] [PubMed] [Google Scholar]
- 68.Heaney RP. 2013. Calcium in the treatment of osteoporosis. In Osteoporosis, 4th edn (eds Marcus R, Feldman D, Dempster DW, Luckey M, Cauley JA), pp. 1691–1700. Amsterdam, The Netherlands: Elsevier. [Google Scholar]
- 69.Brickley M. 2002. An investigation of historical and archaeological evidence for age-related bone loss and osteoporosis. Int. Osteoarch. 12, 364–371. ( 10.1002/oa.635) [DOI] [Google Scholar]
- 70.Spinek AE, Lorkiewicz W, Mietlinska J, Sewerynek E, Klys A, Caramelli D, Zadzinska E. 2016. Evaluation of chronological changes in bone fractures and age-related bone loss: a test case from Poland. J. Archaeol. Sci. 72, 117–127. ( 10.1016/j.jas.2016.06.007) [DOI] [Google Scholar]
- 71.Heaney RP, Abrams S, Dawson-Hughes B, Looker A, Marcus R, Matkovic V, Weaver C. 2000. Peak bone mass. Osteoporos. Int. 11, 985–1009. ( 10.1007/s001980070020) [DOI] [PubMed] [Google Scholar]
- 72.Chirchir H, Kivell TL, Ruff CB, Hublin J-J, Carlson KJ, Zipfel B, Richmond BG. 2015. Recent origin of low trabecular bone density in modern humans. Proc. Natl Acad. Sci. 112, 366–371. ( 10.1073/pnas.1411696112) [DOI] [PMC free article] [PubMed] [Google Scholar]
- 73.Ruff CB, et al. 2015. Gradual decline in mobility with the adoption of food production in Europe. Proc. Natl Acad. Sci. 112, 7147–7152. ( 10.1073/pnas.1502932112) [DOI] [PMC free article] [PubMed] [Google Scholar]
Associated Data
This section collects any data citations, data availability statements, or supplementary materials included in this article.
Supplementary Materials
Data Availability Statement
All data used in this study are available in electronic supplementary material, table S1.