Abstract
Transgenic GFP gene mice are widely used. Given the unique advantages of immunodeficient animals in the field of oncology research, we aim to establish a nude mouse inbred strain that stably expresses enhanced GFP (EGFP) for use in transplanted tumor microenvironment (TME) research. Female C57BL/6‐Tg(CAG‐EGFP) mice were backcrossed with male BALB/c nude mice for 11 generations. The genotype and phenotype of novel inbred strain Foxn1nu.B6‐Tg(CAG‐EGFP) were identified by biochemical loci detection, skin transplantation and flow cytometry. PCR and fluorescence spectrophotometry were performed to evaluate the relative expression of EGFP in different parts of the brain. Red fluorescence protein (RFP) gene was stably transfected into human glioma stem cells (GSC), SU3, which were then transplanted intracerebrally or ectopically into Foxn1nu.B6‐Tg(CAG‐EGFP) mice. Cell co–expression of EGFP and RFP in transplanted tissues was further analyzed with the Live Cell Imaging System (Cell’R, Olympus) and FISH. The inbred strain Foxn1nu.B6‐Tg(CAG‐EGFP) shows different levels of EGFP expression in brain tissue. The hematological and immune cells of the inbred strain mice were close to those of nude mice. EGFP was stably expressed in multiple sites of Foxn1nu.B6‐Tg(CAG‐EGFP) mice, including brain tissue. With the dual‐fluorescence tracing transplanted tumor model, we found that SU3 induced host cell malignant transformation in TME, and tumor/host cell fusion. In conclusion, EGFP is differentially and widely expressed in brain tissue of Foxn1nu.B6‐Tg(CAG‐EGFP), which is an ideal model for TME investigation. With Foxn1nu.B6‐Tg(CAG‐EGFP) mice, our research demonstrated that host cell malignant transformation and tumor/host cell fusion play an important role in tumor progression.
Keywords: congenic inbred green fluorescent nude mice, dual‐fluorescence tracing model, glioma stem cells, malignant transformation, tumor microenvironment
We established an inbred line of green fluorescent nude mice using the backcrossing technique, and identified characteristics of green fluorescent nude mice genetic background. Our studies revealed that green fluorescent nude mice stably and ubiquitously expressed green fluorescence, including brain tissue. We also established a dual‐fluorescence tracing intracranial transplantation tumor model, and we observed the phenomena of tumor/host cell fusion and tumor cell‐induced host cell malignant transformation, which also promoted tumor progression.
1. INTRODUCTION
Green fluorescent protein (GFP), derived from the Aequorea victoria jellyfish, has been widely used as a reporter gene for monitoring the promoter activity in specific cell types. 1 As an optimized mutant GFP, enhanced green fluorescent protein (EGFP) exhibits a high degree of stability, strong fluorescence intensity and is harmless to living cells. EGFP is the most widely used molecular marker in biology. 2 , 3 , 4 , 5 Okabe 6 bred transgenic “green mice” harboring an EGFP cDNA under the control of a chicken beta‐actin promoter and cytomegalovirus enhancer. The transgenic construct was introduced into C57BL/6 donor eggs. Founder mice were bred to C57BL/6 mice and were backcrossed to the same for 11 generations. All of the tissues, with the exception of erythrocytes and hair, appeared green under excitation light in the “green mice.” 7
However, the EGFP expression of brain tissue in transgenic mice remains controversial. With the development of imaging techniques, subsequent reports suggested that organs such as cerebrum and cerebellum were EGFP‐negative. 8 , 9 EGFP expression in the brain has also been reported. 10 Our previous study of transplantation of glioma stem cells (GSC) using hybrid mice with mixed background indicated that the brain was EGFP‐positive, although with individual different fluorescence intensity. 11
To further validate the expression of EGFP in brain tissue of transgenic mice and further expand the utility of “green mice,” we established a congenic inbred strain of green fluorescent nude mouse, Foxn1nu.B6‐Tg(CAG‐EGFP), with the backcrossing technique. With the novel inbred strain of mice, we established a dual‐fluorescence tracing tumor transplanted model in green fluorescent nude mice. With this “visual” xenograft model, we can further observe the interactions between tumor cells and host cells in TME.
2. MATERIALS AND METHODS
2.1. Establishment of inbred strain Foxn1nu.B6‐Tg(CAG‐EGFP)
Transgenic C57BL/6‐Tg(CAG‐EGFP) mice (stock number: 006567) and BALB/c nude mice (stock number: 000711) were obtained from the Model Animal Research Center of Nanjing University. Six‐week‐old female C57BL/6‐Tg(CAG‐EGFP) donor mice were inbred with 6‐week‐old BALB/c nude male mice in micro‐isolator cages supplied with water and adequate food at the Laboratory Animal Center of Soochow University. The EGFP phenotype was identified with a blue light‐emitting flashlight with a central peak of 470 nm (Nightsea). After 11 generations of backcrossing to the BALB/c mice, a new congenic inbred strain named Foxn1nu.B6‐Tg(CAG‐EGFP) was established. All animal studies were conducted in Chinese Experimental Animal Association‐approved facilities.
2.2. Phenotype identification of peripheral blood nucleated cells
Immunophenotyping was performed by 6‐color multiparameter flow cytometry on peripheral blood obtained from an EGFP‐expressing nude congenic inbred strain and from an immunocompetent BALB/c strain, respectively. The following markers were assessed: Anti‐Mouse CD3 APC (17‐0032‐82, eBioscience) and Anti‐Mouse CD19 PE‐Cyanine7 (25‐0193‐81, eBioscience). Analyses were performed using a FACS Canto flow cytometer (Becton Dickinson).
2.3. Genetic analysis the profile of Foxn1nu.B6‐Tg(CAG‐EGFP)
To establish and review the genetic profile of the Foxn1nu.B6‐Tg(CAG‐EGFP) inbred strain, three male and three female F11 (the 11th generations) EGFP nude mice were genotyped based on random sampling. We commissioned the National Institutes for Food and Drug Control to identify a total of 14 biochemical marker loci spread on 10 chromosomes. All sampling and experimental procedures were conducted in accordance with National Standard GBT 14927.1‐2008 of China.
2.4. Skin transplantation
Nine Foxn1nu.B6‐Tg(CAG‐EGFP) mice were anesthetized with 10% chloral hydrate. The dorsal skin of the mice was selected for engraftment. The skin was shaved and removed with a surgical blade. The free skin flaps were exchanged in the 9 mice and sutured to adjacent skin using 4‐5 simple interrupted stitches (with 5‐0 Chromic Gut Sutures). All performances were carried out under aseptic conditions. Gauze placed over the grafted skin for 7 days prevented the mice from scratching or chewing the grafts. We assessed engraftment success by visualizing the growth of newborn hair for at least 3 months.
2.5. Tissues
Mice were killed, and the brain tissues were fixed overnight in 4% paraformaldehyde/PBS at 4°C. The tissues were then transferred to a solution of 30% sucrose for 48 hours, and subsequently embedded and quick frozen in optimal cutting temperature compound (Sakura Finetek). After quickly freezing pathologic sections, they were directly observed under a fluorescent microscope.
2.6. RT‐PCR and real‐time PCR
Mice were decapitated. Brain, liver, skin, heart, pancreas, lung, kidney and muscle were harvested immediately. These tissues were homogenized in a diethylpyrocarbonate‐treated mortar and pestle, respectively. Total RNA was extracted with TRIzol. Then, total RNA was transcribed into cDNA with a First Strand cDNA Synthesis Kit (ThermoScientific). PCR was performed with 50 ng RNA. Reaction condition: initial denaturation for 5 minutes and a three‐step cycle consisting of 30 seconds denaturation, 30 seconds annealing at 58°C, and 30 seconds elongation at 72°C, and end after 30 cycles of amplification. Primers for GAPDH and EGFP were as follows: GAPDH (5′‐GCATTGTGGAAGGGCTCA‐3′, 5′‐GGGTAGGAACACGGAAGG‐3′); EGFP (5′‐TGCCGTTCTTCTGCTTGTC‐3′, 5′‐CCAGGAGCGCACCATCTT‐3′). Real‐time PCR was carried out under the following conditions: initial denaturation for 30 seconds and a three‐step cycle consisting of 5 seconds denaturation, 30 seconds annealing at 65°C, and 30 seconds elongation at 60°C. At the end of 40 cycles of amplification, a melting curve program was used to identify any primer dimers or other non–specific amplifications. Each sample was run in triplicate, and the relative mRNA expression was calculated using the ΔΔC t value.
2.7. Immunohistochemistry and immunofluorescence staining
The procedure for immunohistochemistry and immunofluorescence staining for EGFP, Nestin, GFAP, Ki67 and FAP followed the manufacturer’s instructions. Primary antibodies EGFP (ab184601, Abcam), Nestin (ab6142, Abcam), FAP (fibroblast activation protein, ab53066, Abcam), Ki67 (14‐5698‐82, Invitrogen) and GFAP (80788, CST) were applied to detect the expression of relevant markers.
2.8. Fluorescence spectrophotometry
Fluorescence spectrophotometry was designed to quantitatively analyze the EGFP level. Different parts of mouse brain were lysed with RIPA Lysis Buffer. We measured the EGFP fluorescent intensity of each sample using an LS55 fuorescence spectrophotometer (PerkinElmer). The excitation wavelength was 470 nm and the emission wavelength was 509 nm.
2.9. Establishment of fluorescence tracing orthotopic or ectopic transplantation tumor models
Red fluorescence protein retroviral vector pLNCX2 and PT67 packing cells were all from Genechen. RFP gene was transfected into SU3 and GL261 cells following the manufacturer’s manual. Cells with transfection efficiency more than 90% were collected. Foxn1nu.B6‐Tg(CAG‐EGFP) mice were generally anesthetized, then were drilled at the frontal bone 2.0 mm lateral to the sagittal suture, 0.5 mm anterior to the cranial coronal suture. Then 1 × 10⁴/10 μL SU3/RFP or GL261/RFP cells were injected smoothly into the caudate nucleus with a mice stereotactic instrument. The subcutaneous and abdominal cavity inoculation required 1 × 10⁶/100 μL and 1 × 10⁵/100 μL SU3/RFP cells, respectively. Then 1 × 10⁴/4 μL 91‐2 uveal melanoma cells were injected into the subretinal space of Foxn1nu.B6‐Tg(CAG‐EGFP) mice eyes. The In‐vivo Imaging System (Kodak) was used to determine whether the models were tumorigenic. Then 1 × 10³/20 μL SU3 cells were slowly injected subcutaneously in the root of foxn1nu.B6‐Tg(CAG‐EGFP) mouse auricle, with an insulin hypodermic needle. Tumor‐associated blood vessel blood flow was observed with a two‐photon fluorescence microscope (LotosScan 1.0, Suzhou Institute of Biomedical Engineering and Technology, Chinese Academy of Sciences).
2.10. Cloning of EGFP+/RFP‐ and EGFP+/RFP+ cells from orthotopic or ectopic transplanted tumor
Tumor‐bearing mice were killed. Tumor tissues were dissected smoothly. Single cells were suspended in DMEM/F12 medium and screened by high‐speed cell sorter (MoFlo XD). The green (EGFP+/RFP−) and yellow (EGFP+/RFP+) cells were harvested, respectively. Single green and yellow cells were cultured in 96‐well plates with limiting dilution analysis. Cells with high proliferative ability and clonal formation ability were obtained.
2.11. Colony formation assay
Each cell line was seeded with 500 cells in six‐well plates, cultured at 37°C for 10 days. Each well was washed with PBS, prefixed in 4% paraformaldehyde. Finally, cells were stained with 1% crystal violet for 15 minutes.
2.12. Preliminary genetic identification of yellow cells
A gender‐specific FISH assay was used to identify whether these “yellow cells” were fusion cells between transplanted tumor cells and host cells, which was based on the knowledge that tumor cells were from a male patient of glioblastoma multiforme, and tumor‐bearing mice were all female.
2.13. Statistical analysis
All data were processed with SPSS 18.0 software (IBM Corp), while measurement data were expressed as mean ± SD. The mean differences of two samples were compared by t‐test. The sample averages were compared by analysis of variance (ANOVA). A P‐value <0.05 suggested statistical significance.
3. RESULTS
3.1. Characterization of EGFP congenic inbred strain
Penetrance of EGFP in adult Foxn1nu.B6‐Tg(CAG‐EGFP) mice was 100%, half were homozygotes and half were heterozygotes. The congenic mouse line with an “enhanced” GFP (EGFP) cDNA under the control of a chicken beta‐actin promoter and cytomegalovirus enhancer in all of the tissues, with the exception of erythrocytes and hair, glowed green under excitation of a simple blue‐light‐emitting flashlight (Nightsea) with a central peak of 470 nm (Figure 1A‐F).
Figure 1.
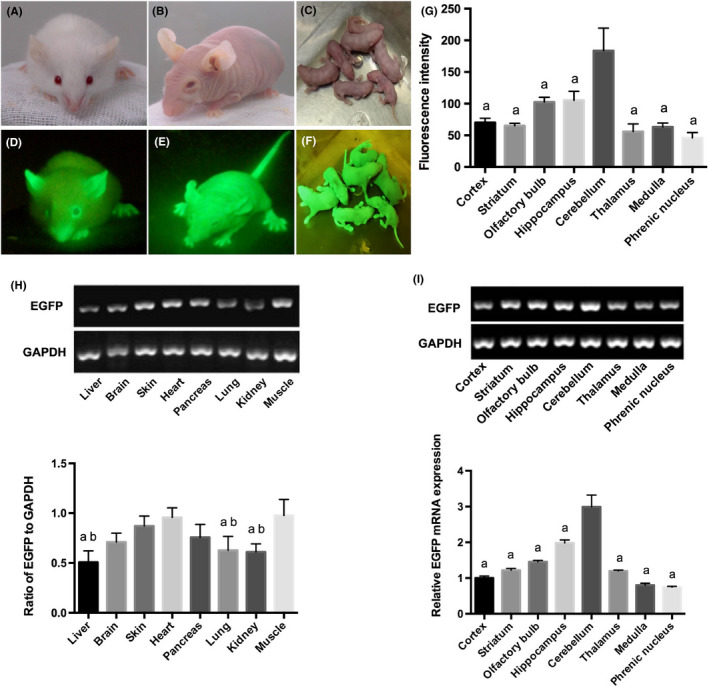
A‐C, A hairy green fluorescent mouse (A), a hairless green fluorescent mouse (B) and a newborn hairless green fluorescent mouse (C) under light, respectively. D, For the hairy mouse, only the auricle, the claw and tip of the nose presented green, as their white hair covered most of their body surface. E, F, Green fluorescence could be detected under illumination of a blue‐light‐emitting flashlight with a central peak of 480 nm, in which the whole body of the hairless mice emitted green fluorescence. G, Relative fluorescent value in different locations of the brain was detected by fluorescence spectrophotometer. The differences between groups were considered significant at P < 0.001 and were analyzed with one‐way ANOVA followed by Student‐Newman‐Keuls tests. aDifferences with cerebellum. H, RT‐PCR analysis of enhanced green fluorescent protein (EGFP) expression in different organs. Relative expression of EGFP in muscle and heart were significantly higher than in other organs. The differences between groups were considered significant at P < 0.05 and were analyzed with one‐way ANOVA followed by Student‐Newman‐Keuls tests. aDifferences with heart; bdifferences with muscle. I, EGFP expression in different locations of the brain was detected by RT‐PCR. The differences between groups were considered significant at P < 0.001 and were analyzed with one‐way ANOVA followed by Student‐Newman‐Keuls tests. aDifferences with cerebellum
3.2. EGFP expression and fluorescence intensity
Estimation of EGFP transcripts by RT‐PCR and quantitative PCR analysis illustrates a varied degree of EGFP expression in different organs. EGFP expression in heart and muscle was comparatively high. Brain, skin and pancreas showed moderate expression level of EGFP expression, while liver, lung and kidney showed a low expression level (Figure 1H). There was no EGFP expression in the corresponding organs in control BALB/c nude mice (data not shown).
3.3. Location of EGFP‐positive cells in brain
Direct observation of the brain sections indicated EGFP‐positive Foxn1nu.B6‐Tg(CAG‐EGFP) strain (Figure 2,A,B), as C57BL/6‐Tg (CAG‐EGFP) mice (Figure S1). In addition, we estimated EGFP transcripts of different parts of the brain by RT‐PCR and quantitative PCR analysis. The results indicated a varied intensity of EGFP expression. Among them, the cerebellum showed the highest expression level of EGFP (Figure 1I). The fluorescence intensity of the corresponding positions of brain using a fluorescence spectrophotometer was consistent with quantitative PCR analysis (Figure 1G).
Figure 2.
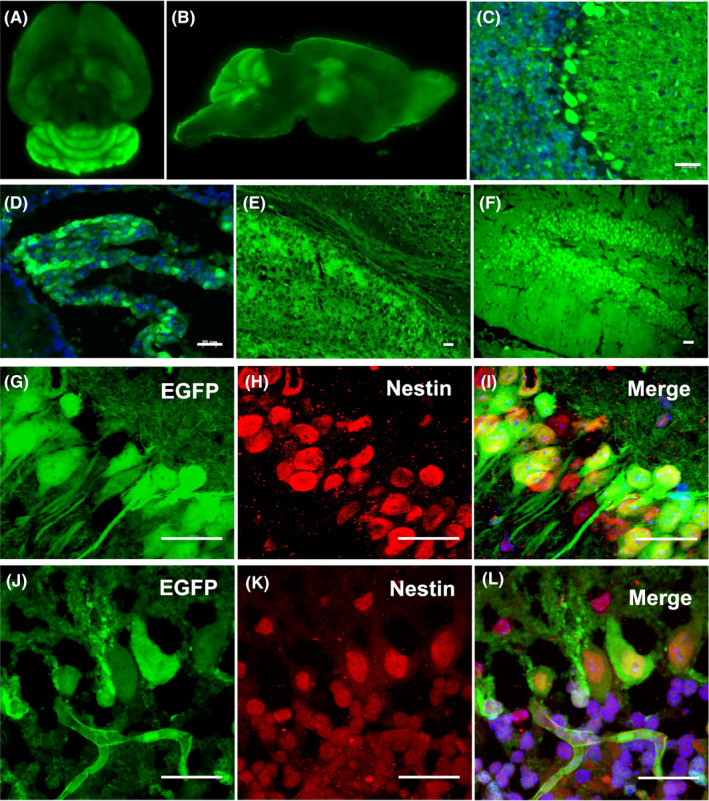
Direct observation of Foxn1nu.B6‐Tg(CAG‐EGFP) mice under fluorescence microscope (480 nm): (A) horizontal position of brain; (B) sagittal position of brain; (C) cerebellar cortex; (D) lateral ventricle choroid plexus; (E) corpus callosum; and (F) hippocampus. G‐L, Immunofluorescence staining of EGFP and Nestin in hippocampal dentate gyrus (upper panels) and cerebellar Purkinje cells (lower panels). Confocal laser scanning microscopy revealed that a few cells were EGFP/Nestin double positive. Scale bar = 50 µm
Further analysis of cerebellar, choroid plexus, corpus callosum and hippocampus of 8‐week‐old mice showed the same pattern of EGFP expression in all the tissues tested using immunofluorescence staining. The EGFP expression was diffusely positive in the tissues mentioned above, of which cerebellar Purkinje cells, choroid plexus epithelial cells, corpus callosum and hippocampal pyramidal cells were intensely positivity (Figure 2C‐F). The green fluorescence of cerebellar Purkinje cells and the hippocampus tissue is particularly strong, with some expressing Nestin, a neural stem/progenitor cells marker (Figure 2G‐L).
3.4. Immunodeficiency of Foxn1nu.B6‐Tg(CAG‐EGFP) mice
We next investigated whether EGFP‐positive nude mice showed similar immunological deficits and immunophenotype as the parental BALB/c nude mice. There was no significant difference in immune status between the EGFP nude line and their non–EGFP counterparts. Quantification analysis revealed a strong and stable reduction of T lymphocytes. The hematological and immune cells of the novel strain were within the range of nude mice (Table 1) (Figure 3A).
Table 1.
Comparison of peripheral blood between Foxn1nu.B6‐Tg (CAG‐EGFP) and BALB/c
|
RBC (1012/L) |
HGB (g/L) |
PLT (109/L) |
WBC (109/L) |
WBC (%) | |||||
|---|---|---|---|---|---|---|---|---|---|
| L | N | M | E | B | |||||
| Foxn1nu.B6‐Tg(CAG‐EGFP) | 9.23 ± 0.488 | 154 ± 7.41 | 854 ± 56.3 | 3.80 ± 0.280 | 13.8 ± 2.55 | 41.2 ± 5.64 | 43.8 ± 6.43 | 0.467 ± 0.249 | 0.767 ± 0.249 |
| BALB/c | 10.4 ± 1.46 | 156 ± 11.0 | 711 ± 150 | 4.20 ± 0.130 | 59.2 ± 9.49 | 35.4 ± 6.90 | 3.57 ± 1.96 | 0.433 ± 0.170 | 1.43 ± 0.519 |
| P‐value | 0.358 | .816 | .275 | .141 | .00284 | .412 | .00107 | .883 | 0.177 |
A P‐value <0.05 suggested statistical significance.
Abbreviations: B, basophils; E, eosinophils; HGB, hemoglobin; L, lymphocytes; M, monocytes; N, neutrophils; PLT, platelets; RBC, red blood cells; WBC, white blood cells.
Figure 3.
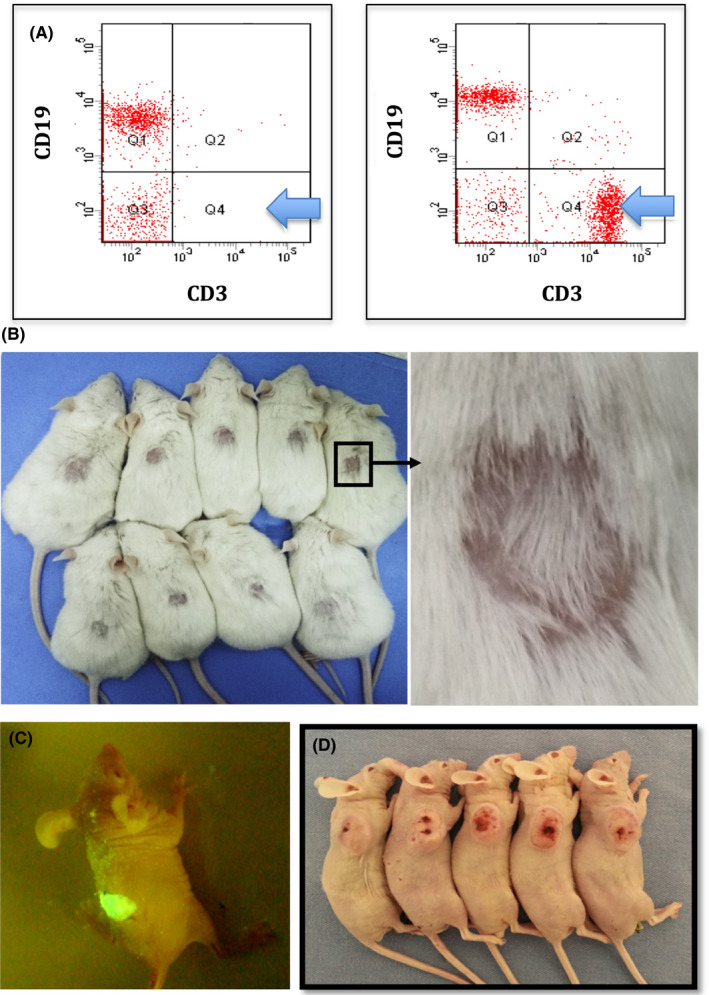
A, Flow cytometric immunophenotyping of blood of Foxn1nu.B6‐Tg(CAG‐EGFP) (left panel) and immunocompetent mice (right panel), showing almost complete absence of CD3+ T cells in Foxn1nu.B6‐Tg(CAG‐EGFP) mouse (light blue arrow). B, Skin transplantation assay indicated, during 3‐mo observation, that there was no significant immune repulsion among individuals, and the length of newborn hair may vary. C, EGFP+ skin from Foxn1nu.B6‐Tg(CAG‐EGFP) mouse was transplanted into EGFP− BALB/c nude mouse, which still emits intense green light after 3 mo. D, U87 cells showed 100% (5/5) tumorigenic rate in Foxn1nu.B6‐Tg(CAG‐EGFP) mice
For skin transplantation, no significant immune rejection existed among individuals after 100 days of observation. Newborn hair emerged on transplanted skin, and the length of the newborn hair was varied (Figure 3B). Transplantation of EGFP+ skin into EGFP– mice still emits intense green light (Figure 3C). U87 cells inoculated with Foxn1nu.B6‐Tg(CAG‐EGFP) were all tumorigenic (Figure 3D).
3.5. Genetic profile of the inbred strain
The genetic profile of the Foxn1nu.B6‐Tg(CAG‐EGFP) congenic inbred strain was assessed with genotyping of six F11 (the 11th generation) homozygous mice. The results indicated that all 14 biochemical loci of six mice were homozygous. However, when compared with the BALB/c strain, all biochemical loci in the Foxn1nu.B6‐Tg(CAG‐EGFP) congenic inbred strain were consistent except for one biochemical locus “Pep3” (“b” type instead “a” type) (Table 2).
Table 2.
Comparison of biochemical loci between Foxn1nu.B6‐Tg (CAG‐EGFP) and BALB/c
|
Biochemical Loci |
Chromosome | Foxn1nu.B6‐Tg(CAG‐EGFP) | BALB/c |
|---|---|---|---|
| Akp1 | 1 | b | b |
| Car2 | 3 | b | b |
| Ce2 | 17 | a | a |
| Es1 | 8 | b | b |
| Es3 | 11 | a | a |
| Es10 | 14 | a | a |
| Gpd1 | 4 | b | b |
| Gpi1 | 7 | a | a |
| Hbb | 7 | d | d |
| Idh1 | 1 | a | a |
| Mod1 | 9 | a | a |
| Pgm1 | 5 | a | a |
| Pep3 | 1 | b | a |
| Trf | 9 | b | b |
3.6. Establishment of fluorescent tracing xenograft model
SU3/RFP cells were intracranial or intraperitoneal inoculated into Foxn1nu.B6‐Tg(CAG‐EGFP) mice, and 92‐1 uveal melanoma cells were injected into the subretinal space of Foxn1nu.B6‐Tg(CAG‐EGFP) mice eyes. With the In‐vivo Imaging System, we could observe the progression of red tumors without sacrificing tumor‐bearing mice (Figure S2). We could also clearly find the relationship between red tumor cells and green host cells in the TEM under fluorescence and confocal microscopy (Figure 4). Tumor‐associated blood vessels in transplantation mouse auricle could be observed directly (Figure S3A‐C). Under the two‐photon fluorescence microscope, it was evident that the EGFP+ nucleated cells flow freely in the living body (Figure S3D) (Video S1), while the red blood cells do not express EGFP.
Figure 4.
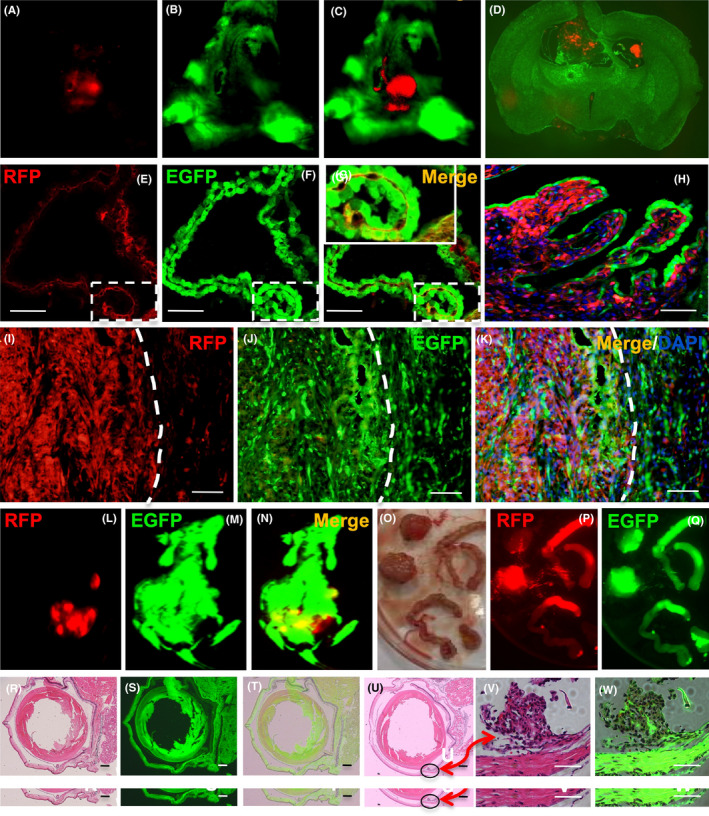
Dual‐fluorescence tracing intracranial xenograft model of human glioma cell line SU3/RFP in Foxn1nu.B6‐Tg(CAG‐EGFP) mice. A‐C, Under the In‐vivo Imaging System, a red‐colored lesion in the green cerebral hemisphere of the living tumor‐bearing mice can be observed directly; D, Brain tissue biopsy, dissected from tumor‐bearing mouse, showed that xenografts expressing red fluorescence invaded the lateral ventricle of green fluorescent nude mice. E‐G, Tumor cell growth along the choroid plexus. A magnified image of the frame indicated that a portion of cells o–expressed RFP and EGFP, termed “yellow cells”. H, Tumor cells grew along the choroid plexus and gradually spread, in the advanced stage of transplanted tumor. I‐K, Under a confocal microscope, it is easy to observe the tumor microenvironment (TME) of the junction area of the transplanted tumor, where a considerable number of yellow cells that co–expressed red fluorescence protein (RFP) and enhanced green fluorescent protein (EGFP) can be seen. The white dotted line represents the tumor boundary. L‐Q, SU3/RFP in the abdominal cavity formed a huge occupying lesion, and extensive infiltration of the small intestine. R‐W, The orthotopic transplantation model of the 92‐1 cell subretinal space injection of Foxn1nu.B6‐Tg(CAG‐EGFP) mice eye. R, Normal mouse eye H&E staining. S, Normal mouse eye image under fluorescence image. T, The merge image of R and S. U, Tumor cells (black circles) were settled in uvea and surrounding area in H&E staining section, after 3 days of 92‐1 cells injection. V, W, Tumor cells were surrounded by host stroma, which was red under white light and green under fluorescence microscope, respectively. Scale bar = 100 µm
3.7. SU3 induced murine fibrosarcoma in the tumor microenvironment
In the subcutaneous tumor transplantation model, in addition to the same performance as described above, an interesting phenomenon was discovered. SU3/RFP cells subcutaneously transplanted with tumor tissues were transplanted subcutaneously into the next generation of Foxn1nu.B6‐Tg(CAG‐EGFP) mice, which was repeated for nine generations. In the case of fluorescent flashlight irradiation, the tumor tissue of the mouse living body was actually green (Figure 5A). The tumor tissue expressed green fluorescence strongly, after incision (Figure 5B,C). H&E staining of tumor tissue slice showed the characteristic of fibrosarcoma (Figure 5D). Tumor cells isolated from transplanted tumor tissue expressed EGFP (Figure 5H,I). Immunohistochemical staining indicated that the green fluorescent tumor cells expressed the mouse fibroblast tumor marker fibroblast activation protein (FAP) but did not express the human astrocytoma marker GFAP (Figure 5J,K); while SU3/RFP expressed GFAP (Figure 5G). The chromosome is telochromosome and flow cytometry indicates that the DNA content of the tumor cells is polyploid (Figure 5E,F). The green fluorescent cells also strongly expressed Ki67 (Figure 5L). As well as the verification of tumorigenesis in immunocompetent mice and immunodeficient mice (Figure 5M,N), it has been confirmed that the transplanted tumor is no longer a human glioma, but a murine fibrosarcoma.
Figure 5.
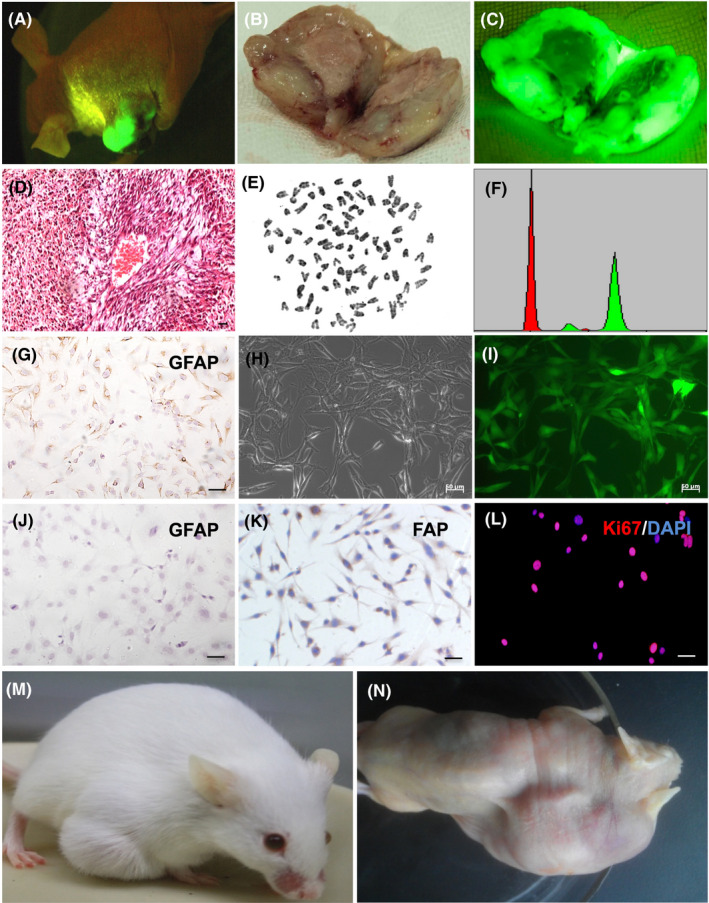
SU3/RFP‐induced murine fibrosarcoma in tumor microenvironment. A, The subcutaneous xenograft tumor of a tumor‐bearing mouse was green under the irradiation of fluorescent flashlight. B, C, Subcutaneous transplanted tumor was dissected and observed under white light and fluorescence, respectively. (D) Transplanted tumor tissue section was stained with H&E. E, Chromosome of green fluorescent cells, which were isolated from subcutaneous transplanted tumor, showed mouse characteristic of telocentric chromosome. F, Red peak represents normal mouse lymphocyte DNA content, DNA content of green peak represents green fluorescent cells, and the DNA content of green fluorescent tumor cells measured by flow cytometry is polyploid. G, Immunohistochemistry revealed that SU3/RFP expressed GFAP; (H, I) Green fluorescent cells were isolated from subcutaneous transplanted tumor, and cultured in vitro, which all expressed green fluorescence. J‐L, Immunohistochemical staining revealed that the above green fluorescent cells were positive for FAP but negative for GFAP; immunofluorescence staining showed that the green fluorescent cells were strongly positive for Ki67. M, N, The green fluorescent cells in C57BL/6 mice and BALB/c mice were all tumorigenic, M and N respectively. Scale bar = 50 µm
3.8. Glioma stem cells induced host cells malignant transformation in tumor microenvironment
SU3/RFP cells were transplanted intracranial or intraperitoneal into Foxn1nu.B6‐Tg(CAG‐EGFP) mice or co–cultured with its bone marrow‐derived cells in vitro. After monoclonal acquisition of green fluorescent cells, seven cell lines were obtained, which have been confirmed by cell molecular biological and genetic methods to have the necessary characteristics of cancer cells (Figure S4). These were: ihCTC (SU3/RFP‐induced host coeliac malignant transformed cells in intraperitoneal xenograft); C12 (SU3/RFP co–cultured with peritoneal washing cells in vitro, malignant transformation of peritoneal macrophages); B4 (SU3/RFP‐induced dendritic cells malignant transformation in liver transplanted tumor tissue); ihDCTC (SU3/RFP‐induced bone marrow‐derived dendritic cells malignant transformation in vitro within co–culture system); ihSTC (SU3/RFP‐induced host subcutaneous cells malignant transformation in subcutaneous xenograft); ihSTBMC 12 (SU3/RFP‐induced host subcutaneous malignant transformed cells, bone marrow‐derived cells); ihBTC (SU3/RFP‐induced host brain cells malignant transformation in intracranial xenograft). All malignant transformed cell chromosomes were terminal centromeric aneuploid (Figure 6A). ihSTC, ihDCTC and B4 were selected for further analysis. Immunohistochemistry or immunofluorescence staining demonstrated that the above‐described malignant transformed host cells had common molecular phenotypes with the original (Figure 6B). A tumorigenicity test of ihDCTC showed tumorigenic properties in Foxn1nu.B6‐Tg(CAG‐EGFP) mice, with lung, mediastinum, esophagus and lymph node metastasis (Figure 6C).
Figure 6.
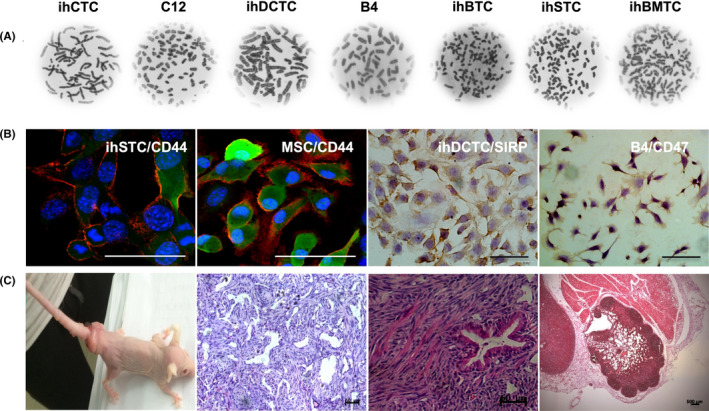
Malignant transformed cells in tumor microenvironment (TME) tumor microenvironment (TME). A, Chromosome imaging of seven malignant transformed cells. B, Immunohistochemistry and immunofluorescence staining of some malignant host cells indicated that those malignant transformed cells might derive from bone marrow mesenchymal stem cells or macrophages. C, Tumorigenicity test was assessed by tail vein injection of ihDCTC into Foxn1nu.B6‐Tg(CAG‐EGFP) mice; from panels left to right are tumor‐bearing mouse, H&E staining of lung metastasis, H&E staining of Mediastinal and lymph node metastasis, respectively. Scale bar = 50 µm
3.9. Isolation of fusion cells from RFP/EGFP dual‐fluorescence tracing models
In the present study, RFP/EGFP double positive yellow cells were observed in which SU3/RFP cells co–cultured with peritoneal lavage cells from Foxn1nu.B6‐Tg(CAG‐EGFP) mice in vitro (Figure 7A‐D). To prove that these yellow cells were fused cells, with the help of the Live Cell Imaging System, we observed that the RFP and EGFP cells were in contact with each other and became yellow cells after mutual swallowing (Figure 7E‐G). This fusion has various outcomes: continuing to split into yellow cells (Figure 7H‐J) or fusion cells initiating the apoptosis procedure (Video S2).
Figure 7.
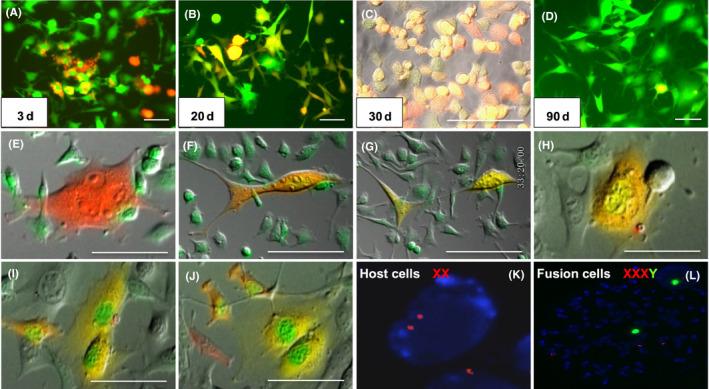
Observation of SU3/RFP co–cultured with peritoneal lavage cells under fluorescence microscope and Live Cell Imaging System in vitro. A‐D, Yellow co–localized cells at different time points of red fluorescence protein (RFP) enhanced green fluorescent protein(EGFP) merged images, wherein “yellow cells” in image C are monoclonal cells from image B, and image D is long‐term subcultured cells of image C, in which the co–localized yellow cells were gradually rare. E‐G, An RFP cell phagocytized an EGFP cell, before splitting into two co–localized “yellow cells.” H‐J, A binuclear yellow cell divided into two cells with green nuclei and yellow cytoplasm. K‐L, Sex chromosome‐specific FISH assay detected the karyotype of “yellow cells.” Red fluorescence was labeled in chromosome X probe; chromosome Y probe was labeled with green fluorescence. SU3 cell was from a male patient. FISH assay showed that karyotype of SU3 cells was XY, which has been published in a previous report; tumor‐bearing mice were all female, FISH assayed showed karyotype of host cells was XX (K); The “yellow cells” were identified in XXXY (L). Scale bar = 50 µm
In addition to SU3/RFP, GL261/RFP cells were also intracranially transplanted into Foxn1nu.B6‐Tg(CAG‐EGFP) mice, to eliminate the impact of species differences. The In‐vivo Imaging System was used to determine tumorigenic success, without sacrificing the tumor‐bearing mice. The intracranial tumors were dissected and short‐term cultured in vitro. The yellow cells, co–expression of RFP and EGFP cells, were collected via high‐speed cell sorter (Figure S5A‐C). With a clonal formation assay, some yellow cells were found to have strong proliferation ability and colony forming ability (Figure S5D). Sex chromosome specific FISH assay revealed that the karyotype of yellow cells was XXXY (Figure 7K‐L), which further verified that the yellow cells were fused cells of transplanted gliomas cells and host cells, which was consistent with our previous report on SU3 cells derived from a male GBM patient. 11 Tumor‐bearing mice were all 6‐week‐old female mice.
4. DISCUSSION
According to Biankin 8 and Ma 9 , the C57BL/6‐Tg(CAG‐EGFP) strain expresses “ubiquitous” EGFP with characteristic inhomogeneity among tissues and organs: for instance, cerebrum and cerebellum were EGFP negative. However, our previous study of xenograft transplantation of human glioma stem cells (hGSC) using hybrid mice with mixed background indicated that the brain was EGFP‐positive, with individual variations. 11 To investigate and estimate the EGFP expression in the transgenic mouse brain and other organs, we ascertained the stability of genetic background by developing an inbred strain to eliminate genetic instability.
The new inbred strain, named Foxn1nu.B6‐Tg(CAG‐EGFP), was produced after 11 generations of backcross between C57BL/6‐Tg(CAG‐EGFP) and BALB/c‐Foxn1nu mice. All 14 biochemical loci were homozygous. However, compared with the BALB/c‐Foxn1nu mice, one biochemical locus “Pep3” was still different (“b” type instead of “a” type). According to the characteristics of homozygosity, isogenicity and individuality in the inbred strain, we believe the type “b” of the “Pep3” locus was a characteristic of a new congenic strain. Further skin transplantation indicated no significant immune repulsion among individuals.
To investigate the expression of EGFP in this inbred mouse, we estimated the EGFP transcript by RT‐PCR from eight organs, including the brain. Similar to the report from Biankin and Ma, our results show tissue/organ specificity. However, our results suggest the existence of the EGFP transcript in the Foxn1nu.B6‐Tg(CAG‐EGFP) brain, at a level higher than in the liver.
To validate and investigate the differential expression of EGFP in the brain, we observed the frozen sections of mouse brain directly. The results demonstrate that the EGFP expression was diffusely observed in the mouse brain. Interestingly, we also found that the expression and fluorescent intensity of EGFP in the mouse brain may vary.
Further PCR and fluorescence spectrophotometry showed that the brain was EGFP‐positive, which is consistent with the result of direct observation of the frozen section. A study involving orthotopic implantation of human glioma cells in GFP nude mice by Zhou et al (2012) 10 supports our study. Therefore, evidence supports that Foxn1nu.B6‐Tg(CAG‐EGFP) brain stably and ubiquitously expresses EGFP, which can be used for tracer studies in the brain. Our experience also showed that somatic cells from Foxn1nu.B6‐Tg(CAG‐EGFP) mouse steadily maintained green fluorescence expression in long‐term culture in vitro, while fluorescence obtained by virus transfection are more likely to lose fluorescence after long‐term culture in vitro.
Interpreting tissue‐specific patterns of EGFP expression was difficult. Akagi and Wang believe that significant differences in EGFP expression between various organs, and frequent single cells in organs, may be attributed to tissue‐specific promoter activity. 13 , 14 The EGFP expression driven by elongation factor‐1 alpha (EF‐1α) was most stable, followed by phosphoglycerate kinase‐1 (PGK‐1), while the downregulation of EGFP expression driven by the cytomegalovirus (CMV) promoter was most significant after 35 passages. In our study, the parental transgenic C57BL/6‐Tg(CAG‐EGFP) mouse line was produced by inserting the wild‐type GFP into pCAGGS (containing the chicken beta‐actin promoter and cytomegalovirus enhancer, beta‐actin intron and bovine globin poly‐adenylation signal). 6 This composite promoter combined the advantages of both the Ac and CMV‐ZE promoters, exhibited much higher activity than the CMV promoter, and demonstrated similar active efficiency relative to EF‐1α and PGK‐1. 15
It is noteworthy that cerebrum and cerebellum were not only EGFP‐positive but also showed differences in distribution. Cerebellar Purkinje cells, hippocampal pyramidal cells, olfactory bulb granular cells and choroid plexus epithelial cells displayed higher fluorescence intensity. Although the reasons underlying EGFP distribution remain unclear, they may be related to the enrichment of neural stem cells (NSC). Previous studies had shown that NSC were distributed among hippocampal dentate gyrus, ependyma, subependyma, olfactory bulb and corpus striatum in the embryo. 16 With immunofluorescence analysis, we found that in the hippocampal dentate gyrus, the spread of EGFP‐positive cells was consistent with NSC distribution.
Previous reports on the study of microenvironmental imaging of brain tumors using transgenic fluorescent nude mice are rare. In 2004, Hoffman established a transgenic nude murine strain with ubiquitous EGFP expression including brain tissue. 17 Based on this transgenic nude, Menen et al. 18 used a green fluorescent nude mouse human pancreatic cancer orthotopic xenograft model to determine that induced macrophages promote tumor growth. It was a successful attempt to study the tumor microenvironment (TME) via a transgenic fluorescent nude mice model. Suetsugu et al (2012) established a non–invasive new mouse model of patient‐derived tumors with GFP and RFP expressing stromal elements which were acquired by passaging the patients’ pancreatic cancer tumor grafts through transgenic GFP and RFP nude mice. The results showed that tumors had very bright GFP and RFP stroma, and such GFP and RFP cells could also survived in the next generation of transplanted tumor tissue. 19 However, the authors did not further trace whether or not such GFP‐positive or RFP‐positive cells have gained immortality. With a fluorescent tracer xenograft model based on the inbred nude mice that express EGFP extensively, including in brain tissue, our work focused on TME research has confirmed that some host mesenchymal cells have undergone malignant transformation. In the present as well as our previous reports, 12 , 20 , 21 we found that some fibroblasts, bone marrow‐derived dendritic cells and oligodendrocytes in transplanted tumor microenvironmentwere malignant transformation induced by primary transplanted tumor cells. The Foxn1nu.B6‐Tg(CAG‐EGFP) mice auricle transplantation model could also facilitate research on the tumor immune microenvironment in vivo, with a two‐photon fluorescence microscope. However, the specific mechanism of host cell malignant transformation is still not fully understood. We will focus on this in our further work.
With red and green fluorescence tracing, we can observe the interaction between tumor cells and host cells in the TME vividly and intuitively. With the model, we also found some host cells expressing green fluorescence fuse with tumor cells expressing red fluorescence, which also play an important role in tumor progression. 22
In summary, we have developed and identified a new congenic inbred strain of nude mouse, designated Foxn1nu.B6‐Tg(CAG‐EGFP), with stable EGFP expression. Our results suggest that EGFP is differentially expressed not only in organs and tissues but also in the brain of the inbred strain. Our study reveals the differential histological and/or cellular distribution of EGFP, which also indicates that this congenic nude mouse model with immunodeficiency and a stable genetic profile is an ideal model for research into host‐derived TME via dual‐fluorescence tracing, especially for brain tumor investigation. 11 , 23 , 24 , 25
CONFLICT OF INTEREST
We declare that all authors have no conflict of interest.
Supporting information
Figure S1
Figure S2
Figure S3
Figure S4
Figure S5
Video S1
Video S2
Supplementary Material
ACKNOWLEDGMENTS
Our work was funded by the National Natural Science Foundation of China (81602183, 81472739, 81272799 and 81172400) and The Youth Medical Talent Foundation of Jiangsu (QNRC2016217). Dr Li Min and Dr Zhou Zhenqiao from the Suzhou Institute of Biomedical Engineering and Technology Chinese Academy of Sciences contributed to the two‐photon fluorescence detection work in this paper.
Lan Q, Chen Y, Dai C, et al. Novel enhanced GFP-positive congenic inbred strain establishment and application of tumor-bearing nude mouse model. Cancer Sci. 2020;111:3626–3638. 10.1111/cas.14545
Qing Lan and Yanming Chen contributed equally to this work.
REFERENCES
- 1. Santerre Henriksen AL, Even S, Müller C, et al. Study of the glucoamylase promoter in Aspergillus niger using green fluorescent protein. Microbiology. 1999;145:729‐734. [DOI] [PubMed] [Google Scholar]
- 2. Stauber RH, Horie K, Carney P, et al. Development and applications of enhanced green fluorescent protein mutants. Biotechniques. 1998;24:462‐471. [DOI] [PubMed] [Google Scholar]
- 3. Yee KK, Li Y, Redding KM, et al. Lgr5‐EGFP marks taste bud stem/progenitor cells in posterior tongue. Stem Cells. 2013;31:992‐1000. [DOI] [PMC free article] [PubMed] [Google Scholar]
- 4. Cambuli FM, Rezza A, Nadjar J, et al. Brief report: Musashi1‐eGFP mice, a new tool for differential isolation of the intestinal stem cell populations. Stem Cells. 2013;31:2273‐2278. [DOI] [PubMed] [Google Scholar]
- 5. Watanabe M, Kagawa S, Kuwada K, et al. Integrated fluorescent cytology with nano‐biologics in peritoneally disseminated gastric cancer. Cancer Sci. 2018;109:3263‐3271. [DOI] [PMC free article] [PubMed] [Google Scholar]
- 6. Okabe M, Ikawa M, Kominami K, et al. “Green mice” as a source of ubiquitous green cells. FEBS Lett. 1997;407:313‐319. [DOI] [PubMed] [Google Scholar]
- 7. Ikawa M, Yamada S, Nakanishi T, et al. “Green mice” and their potential usage in biological research. FEBS Lett. 1998;430:83‐87. [DOI] [PubMed] [Google Scholar]
- 8. Biankin SA, Collector MI, Biankin AV, et al. A histological survey of green fluorescent protein expression in “green” mice: implications for stem cell research. Pathology. 2007;39:247‐251. [DOI] [PubMed] [Google Scholar]
- 9. Ma DF, Tezuka H, Kondo T, et al. Differential tissue expression of enhanced green fluorescent protein in “green mice”. Histol Histopathol. 2010;25:749‐754. [DOI] [PubMed] [Google Scholar]
- 10. Zhou YX, Chen XH, Xie XS, et al. Orthotopic model of SHG‐44 in the enhanced green fluorescent protein nude mouse. J Neurosci Res. 2012;90:1814‐1819. [DOI] [PubMed] [Google Scholar]
- 11. Dong J, Dai X, Lu Z, et al. Incubation and application of transgenic green fluorescent nude mice in visualization studies on glioma tissue remodeling. Chin Med J. 2012;125:4349‐4354. [PubMed] [Google Scholar]
- 12. Dai X, Chen H, Chen Y, et al. Malignant transformation of host stromal fibroblasts derived from the bone marrow traced in a dual‐color fluorescence xenograft tumor model. Oncol Rep. 2015;34:2997‐3006. [DOI] [PubMed] [Google Scholar]
- 13. Akagi Y, Isaka Y, Akagi A, et al. Transcriptional activation of a hybrid promoter composed of cytomegalovirus enhancer and β‐actin/β‐globin gene in glomerular epithelial cells in vivo. Kidney Int. 1997;51:1265‐1269. [DOI] [PubMed] [Google Scholar]
- 14. Wang R, Liang J, Jiang H, et al. Promoter‐dependent enchanced green fluorescent protein expression during embryonic stem cell propagation and differentiation. Stem Cells Dev. 2008;17:279‐289. [DOI] [PubMed] [Google Scholar]
- 15. Hitoshi N, Ken‐ichi Y, Jun‐ichi M. Efficient selection for high‐expression transfectants with a novel eukaryotic vector. Gene. 1991;108:193‐199. [DOI] [PubMed] [Google Scholar]
- 16. Ourednik J, Ourednik V, Lynch WP, et al. Neural stem cells display an inherent mechanism for rescuing dysfunctional neurons. Nat Biotechnol. 2002;20:1103‐1110. [DOI] [PubMed] [Google Scholar]
- 17. Yang M, Reynoso J, Jiang P, et al. Transgenic nude mouse with ubiquitous green fluorescent protein expression as a host for human tumors. Cancer Res. 2004;64:8651‐8656. [DOI] [PubMed] [Google Scholar]
- 18. Menen RS, Hassanein MK, Momiyama M, et al. Tumor‐educated macrophages promote tumor growth and peritoneal metastasis in an orthotopic nude mouse model of human pancreatic cancer. Vivo. 2012;26:565‐570. [PubMed] [Google Scholar]
- 19. Suetsugu A, Katz M, Fleming J, et al. Non–invasive fluorescent‐protein imaging of orthotopic pancreatic‐cancer‐ patient tumorgraft progression in nude mice. Anticancer Res. 2012;32:3063‐3067. [PubMed] [Google Scholar]
- 20. Chen Y, Wang Z, Dai X, et al. Glioma initiating cells contribute to malignant transformation of host glial cells during tumor tissue remodeling via PDGF signaling. Cancer Lett. 2015;365:174‐181. [DOI] [PubMed] [Google Scholar]
- 21. Fei X, Wang A, Wang D, et al. Establishment of malignantly transformed dendritic cell line SU3‐ihDCTC induced by Glioma stem cells and study on its sensitivity to resveratrol. BMC Immunol. 2018;19:7. [DOI] [PMC free article] [PubMed] [Google Scholar]
- 22. Nakamura M, Suetsugu A, Hasegawa K, et al. Genetic recombination between stromal and cancer cells results in highly malignant cells identified by color‐coded imaging in a mouse lymphoma model. J Cell Biochem. 2017;118:4216‐4221. [DOI] [PubMed] [Google Scholar]
- 23. Dong J, Zhao Y, Huang Q, et al. Glioma stem/progenitor cells contribute to neovascularization via transdifferentiation. Stem Cell Rev Reports. 2011;7:141‐152. [DOI] [PubMed] [Google Scholar]
- 24. Dong J, Zhang Q, Huang Q, et al. Glioma stem cells involved in tumor tissue remodeling in a xenograft model: laboratory investigation. J Neurosurg. 2010;113:249‐260. [DOI] [PubMed] [Google Scholar]
- 25. Xie T, Liu B, Dai CG, et al. Glioma stem cells reconstruct similar immunoinflammatory microenvironment in different transplant sites and induce malignant transformation of tumor microenvironment cells. J Cancer Res Clin Oncol. 2019;145:321‐328. [DOI] [PMC free article] [PubMed] [Google Scholar]
Associated Data
This section collects any data citations, data availability statements, or supplementary materials included in this article.
Supplementary Materials
Figure S1
Figure S2
Figure S3
Figure S4
Figure S5
Video S1
Video S2
Supplementary Material


