Abstract
Immune‐based tumor characteristics in the context of tumor heterogeneity are associated with suppression as well as promotion of cancer progression in various tumor types. As immunity typically functions based on intercellular contacts and short‐distance cytokine communications, the location and spatial relationships of the tumor immune microenvironment can provide a framework to understand the biology and potential predictive biomarkers related to disease outcomes. Immune spatial analysis is a newly emerging form of cancer research based on recent methodological advances in in situ single‐cell analysis, where cell‐cell interaction and the tissue architecture can be analyzed in relation to phenotyping the tumor immune heterogeneity. Spatial characteristics of tumors can be stratified into the tissue architecture level and the single‐cell level. At the tissue architecture level, the prognostic significance of the density of immune cell lineages, particularly T cells, is leveraged by understanding longitudinal changes in cell distribution in the tissue architecture such as intra‐tumoral and peri‐tumoral regions, and invasive margins. At the single‐cell level, the proximity of the tumor to the immune cells correlates with disease aggressiveness and therapeutic resistance, providing evidence to understand biological interactions and characteristics of the tumor immune microenvironment. In this review, we summarize recent findings regarding spatial information of the tumor immune microenvironment and review advances and challenges in spatial single‐cell analysis toward developing tissue‐based biomarkers rooted in the immune spatial landscape.
Keywords: biomarker, multiplex immunohistochemistry, single‐cell analysis, spatial analysis, tumor immune microenvironment
The tumor immune microenvironment is characterized by multiple layers of spatial information. The whole tumor is dissected by tissue segments such as intratumoral and peritumoral regions at the tissue structure level, and by cell‐cell spatial relationships at the single‐cell level.
Abbreviations
- FFPE
formalin‐fixed paraffin‐embedded
- FISH
fluorescence in situ hybridization
- IHC
immunohistochemistry
- TLS
tertiary lymphoid structure
1. INTRODUCTION
The immune system is involved in the process of cancer progression, from carcinogenesis to therapeutic resistance, in which cellular components such as immune infiltrates, the stroma, and vascular endothelial cells interact with each other to eliminate or promote tumors via the formation of the heterogeneous tumor microenvironment. 1 , 2 , 3 Some studies have indicated that immune‐based tumor characteristics in the context of tumor heterogeneity are deeply associated with therapeutic outcomes in a wide range of cancer types. Given that intercellular reactions are based on cell‐cell contact and soluble factor gradients, spatial relationships in the multiple layers of the tumor immune microenvironment can provide a framework for understanding the biology of the tumor microenvironment, subsequently leading to the development of tissue‐based predictive biomarkers for diseases outcomes (Figure 1). Recent advances have enabled adding spatial information to single‐cell analysis in the context of tissues, phenotyping the tumor immune heterogeneity. In this review, we summarize recent findings regarding the prognostic significance of the spatial characteristics in the tumor immune microenvironment, and review the potential for developing tissue‐based biomarkers based on immune spatial characteristics.
FIGURE 1.
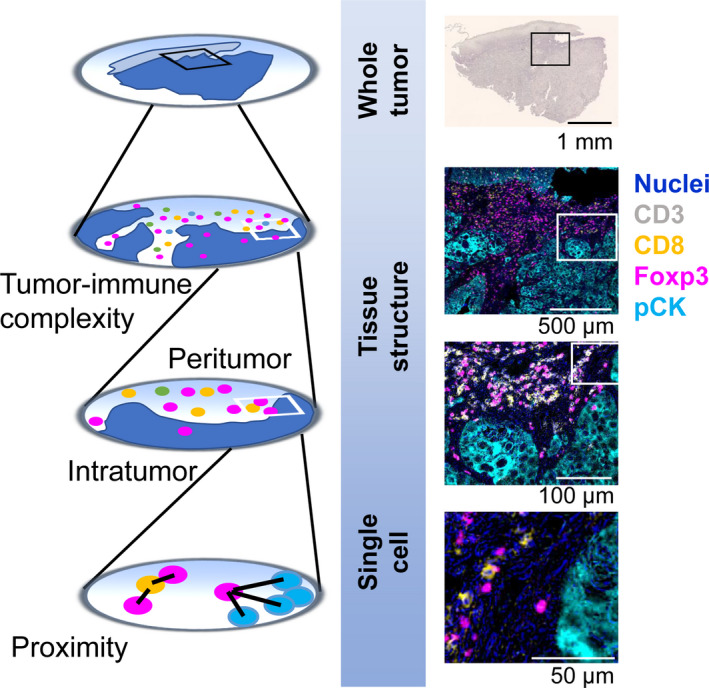
Multi‐layered spatial information defines the landscape of the tumor immune microenvironment. The tumor immune microenvironment is characterized by multiple layers of spatial information. The whole tumor is dissected by tissue segments such as intratumoral and peritumoral regions at the tissue structure level, and by cell‐cell spatial relationships at the single‐cell level. The left panels present schematic overviews of the right panel images. The right panels show hematoxylin and multiplex IHC images of head and neck squamous cell carcinoma tissue. Pseudo‐colored images were obtained using a sequential chromogenic IHC technique (REF #3), enabling quantitative assessment of multi‐layered spatial information (right panels). Marker annotations and magnifications are shown
2. IMMUNE AND STROMAL CELL LINEAGES IN THE TUMOR MICROENVIRONMENT
Tumor cells are surrounded by the tumor microenvironment containing diverse cell types such as lymphoid and myeloid immune cell lineages, fibroblasts, endothelial cells, and a variety of tumor‐associated tissue cells. 2 Immune cells are a major component of the cellular milieu in the tumor microenvironment, where a combination of multiple lineage identification markers is utilized for classification of cell types, including CD8+ T cells, helper T cells, regulatory T cells (TREG), B cells, natural killer (NK) cells, macrophages and myelomonocytic populations, dendritic cells, mast cells, granulocytes, and other immune cells (Figure 2). In addition to the diversity of lineages, immune cells have functional and phenotypic heterogeneity. For example, macrophages are known to have functionally divergent phenotypes based on different polarization properties, in which tumor‐associated macrophages show a typically M2‐like phenotype, related to tumor progression via angiogenesis, immunosuppression, and activation of tumor cells. 4 In non‐hematopoietic lineages, cancer‐associated fibroblasts and epithelial cells also exhibit heterogeneous profiles, which are associated with various stages of tumor progression via the formation of mechanical barriers, pro‐inflammatory signals, recruitment of immune cells as well as immunosuppressive cascades. 5 , 6 Notably, tumor cells and the surrounding cellular components have close relationships and intercommunications at the cellular and molecular levels, which provide a rationale for understanding cell‐cell spatial relationships and tumor immune heterogeneity.
FIGURE 2.
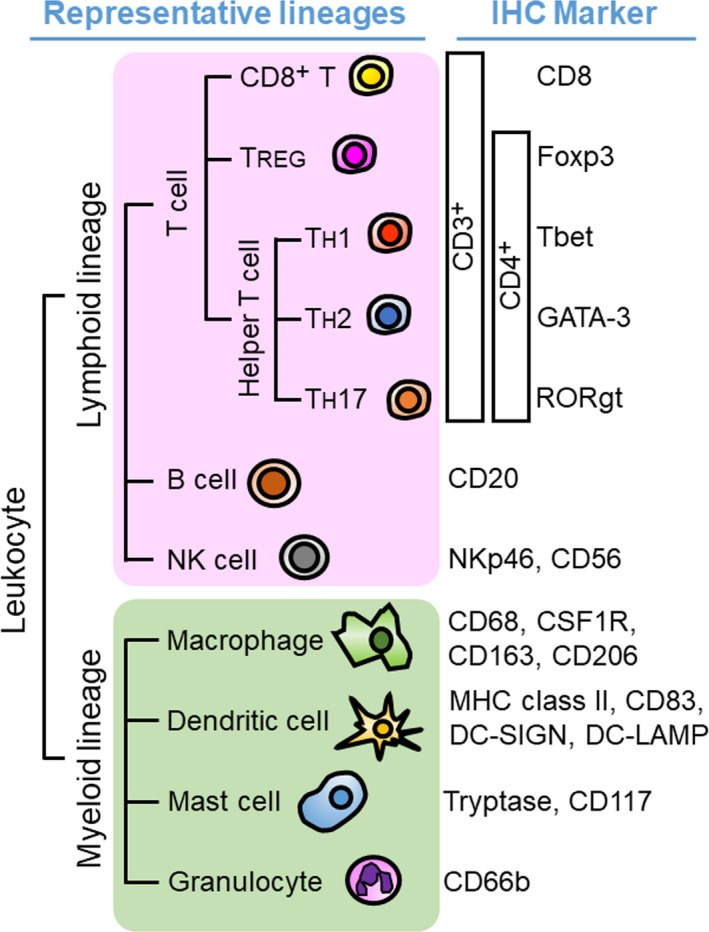
Immunohistochemical lineage identification markers for lymphoid and myeloid immune cells in the tumor microenvironment. A wide variety of immune cells is present in the tumor microenvironment. The development of IHC technique enables in situ identification of immune cell types based on multiple lineage identification markers with preserved tissue architecture
3. IMMUNE SPATIAL RELATIONSHIPS AT THE TISSUE ARCHITECTURE LEVEL
The tissue architecture of established tumors can be classified historically into intratumor regions, and adjacent tissues, followed by functional characterization such as invasive margins, intratumoral stroma, TLS, and vascularization (Figure 1).
3.1. Intratumoral regions
Early seminal studies revealed that immune cell density and distribution have prognostic implications in relation to the tumor tissue architecture, in which improved clinical outcomes are associated with the density of intratumoral T cells in colorectal 7 and ovarian cancer. 8 T cell infiltration in intratumor regions, but not in the peritumoral stroma, correlates with favorable prognosis in a wide range of tumor types such as colorectal cancer, 7 , 9 , 10 ovarian cancer, 8 urothelial carcinoma, 11 , 12 non‐small cell lung carcinoma, 13 pancreatic ductal adenocarcinoma, 14 triple negative breast cancer, 15 , 16 and head and neck squamous cell carcinoma, 17 , 18 providing the rationale for understanding immune spatial relationships at the tissue architecture level. Restricted accumulation of T cells into intratumor regions is possibly associated with the distinct microenvironment such as reduced immunogenicity, 19 mechanical barriers, 20 tumor and microenvironment‐derived immunosuppression, 21 and tumor metabolism. 22 In papillary thyroid carcinoma, poor infiltration of T cells is associated with a predominance of myeloid lineages in the intratumoral regions, simultaneously correlating with pathological aggressiveness. 23 As the degree of the intratumoral infiltration of immune cells is deeply associated with the profiles of the tumor microenvironment, the density and phenotypes of intratumoral immune infiltrates can provide clues to understanding the characteristics and potential prognostic factors for predicting therapeutic outcomes.
3.2. Tissue area surrounding cancer cell nests
Beyond the significance of intratumoral regions, phenotypes of the invasive margin and peritumoral regions also reflect the immune characteristics of tumors. The invasive margin of the tumor is typically defined as the border separating adjacent non‐malignant area from the malignant tumor cell nests. 24 Because the presence of T cells at the invasive margin independently correlates with prognosis, the invasive margin and central tumor are recommended to be evaluated separately in colorectal 7 and breast cancer. 24 As the invasive margin is formed by a physical mixture of cancer cells and host tissue, the invasive margin may have unique biological context from the whole tumor tissue.
TLSs exhibit a structure analogous to follicles in lymphoid tissues, which are the results of lymphoid neogenesis in the course of chronic inflammation and tumor progression. 25 , 26 In a wide range of tumor types, the presence of TLSs surrounding cancer cell nests is mostly associated with a favorable prognosis, 25 , 26 , 27 , 28 , 29 although the degree of specificity of the recruited T cells in TLS is still unknown due to the extent of potential bystander activation. 30 As the high density of TREG in TLS has a negative survival impact on patients with early‐stage non‐small‐cell lung carcinoma, 31 the characteristics of TLSs need to be stratified in the context of tissues. In fact, the quality of TLSs is reported to correlate with the degree of intratumoral infiltration of CD8+ T cells in pancreatic cancer. 32 Reported complexity of TLS highlights the functional and prognostic significance of peritumoral immune infiltrates and the formation of immune aggregates in the tumor microenvironment.
3.3. Time and dynamics
In addition to the snapshot‐based characterization of tumor immune spatial characteristics, the location and phenotypes of immune cells should be understood based on longitudinal changes during cancer progression and treatment. The distribution of immune cells at baseline frequently exhibits substantial changes during chemotherapy and immunotherapy, potentially contributing to therapeutic response or resistance. Responders for anti‐PD1 blockade in melanoma showed longitudinal changes in T cell infiltration into the intratumoral regions with increased proliferation. 33 In head and neck squamous cell carcinoma, differential tumor immune architectures were observed during the response to combination therapy using chemotherapy and cetuximab, where T cell exclusion at baseline (Figure 3A) was convergently changed into intratumoral infiltration at post‐treatment (Figure 3B). Given that different sets of cancer treatments are applied either simultaneously or sequentially, understanding treatment‐induced longitudinal changes in the tumor immune architecture can provide potential predictive information that guides therapeutic decision‐making.
FIGURE 3.
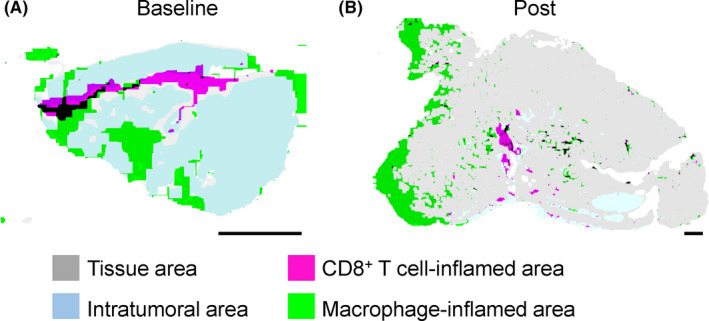
Immune tissue segmentation reveals longitudinal changes in the tissue architectures during chemotherapy. A, B, Tumor immune tissue structures at the baseline (A) and the post–therapeutic status (B) are comparatively evaluated using matched tumors of head and neck squamous cell carcinoma treated by 2 courses of paclitaxel, carboplatin, and cetuximab. By using whole tissue‐based mapping analysis for immune cell densities, CD8+ T cell‐enriched and CD68+ macrophage‐enriched regions were visualized with the tissue structures. Blue and gray areas represent intratumoral and adjacent non‐malignant tissue areas, respectively. Although it was excluded from the intratumoral region at the baseline, CD8+ T cell‐inflamed area was intensively observed in the intratumoral region at the post–treatment status, suggesting the effect of chemotherapy for dynamics of immune–issue segmentation. Scale bars, 1 mm
4. SPATIAL RELATIONSHIPS AT THE SINGLE‐CELL LEVEL
As immune cells typically communicate with each other via synaptic cell‐cell contacts and cytokines, spatial configurations at the single‐cell level can provide insights into the heterogeneous and heterotypic tumor microenvironment, where bidirectional interactions between cancer cells and immune cells can change the phenotypes and functional status of the cells surrounding the tumor cell (Figure 4A‐C).
FIGURE 4.
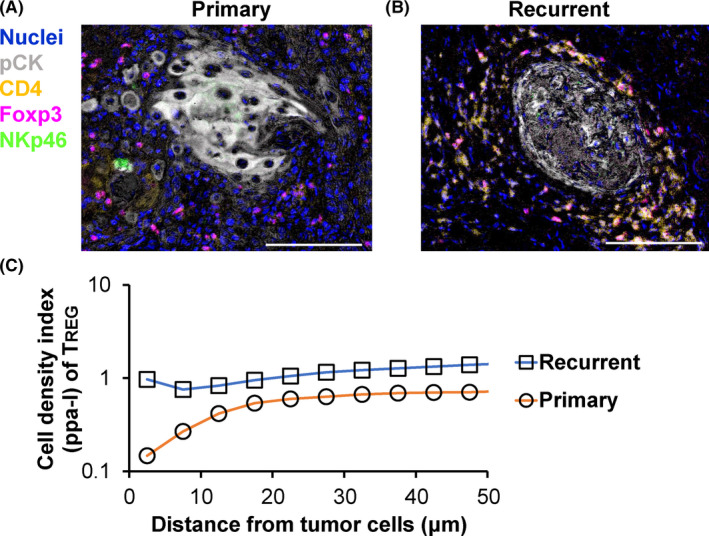
Primary and recurrent tumors exhibit differential cell‐cell spatial relationships between tumor cells and TREG. A, B, Spatial relationships between pCK+ tumor cells and immune cells are compared between new primary (A) and recurrent primary (B) head and neck tumors from the same individual. CD3+CD4+Foxp3+ regulatory T cells (TREG) exhibited short proximity to tumor cell nests at recurrent status. Scale bars, 100 μm. C, Cell‐cell spatial relationships between tumor cells and TREG were quantitatively assessed via pair correlation function analysis. The values were < 1.0, indicating a mutually exclusive distribution between tumor cells and TREG at the primary tumors
4.1. Cancer cells vs anti‐tumor immune cells
Because the close proximity between tumor cells and CD8+ T cells presumably means effective infiltration of tumor antigen‐specific T cells, leading to the workability of anti‐tumor immunity, a favorable prognostic significance has been reported in various types of cancer such as non‐small‐cell lung carcinoma, 34 ovarian cancer, 35 colorectal cancer, 36 melanoma, 37 and pan‐cancer cohorts. 38 , 39 Longitudinal analysis comparing matched primary and recurrent head and neck cancer tissues revealed that NK cells of recurrent tumors showed greater distance to tumor cells compared with those of primary tumors, which was potentially related to the mechanisms of recurrence. 40
4.2. Cancer cells vs tumor‐promoting immune cells
Cancer immunoediting is a process that attenuates anti‐tumor immunity and promotes tumor development via immunosuppression. Recent reports have provided evidence of cancer immunoediting in the microregional spatial context. As TREG is a lineage of T cells that maintains tolerance to self‐antigen and hinders anti‐tumor immunity, a high density of TREG around tumor cells is associated with short overall survival in lung cancer. 41 Similar findings have been observed in head and neck squamous cell carcinoma, in which recurrent tumor cells had close proximity to immunosuppressive ICOS+ TREG and myeloid cells 40 (Figure 4A‐C). Furthermore, proliferation and metastasis of cancer cells can be promoted by colocalization of tumor cells with neutrophils 42 and tumor‐associated macrophages. 43
4.3. Immune cells vs immune and other non‐malignant cells
Spatial relationships between immune cells and non‐malignant cells are also important factors determining the characteristics of the tumor microenvironment. TH17 cells surrounding CD66b+ granulocytes have Th2‐like phenotypes identified by spatial relationship analysis in HPV‐negative head and neck squamous cell carcinoma. 44 Colocalization of T cells with mature dendritic cells in draining lymph nodes is associated with negative lymph node metastasis. 45 A short distance between mast cells and CD8+ T cells is negatively associated with chemotherapeutic response in breast cancer. 46 Because a huge number of combinations can be considered among various phenotypes of immune cell lineages, inter‐immune cell spatial relationships might represent a potential gold mine of information such as cell functionality, regulation of metastasis and treatment outcomes.
As vascular and lymphatic endothelial cells are associated with recruitment and trafficking of immune cells, the proximity between vascular cells and immune cells can reflect the status of accessibility for intratumoral immune infiltration. In fact, the close proximity of T cells to lymphatic endothelial cells correlates with therapeutic response in melanoma. 6 Overall, spatial information at the single‐cell level can provide a clue for understanding biological interactions and characteristics of the tumor immune microenvironment.
5. NEW TECHNOLOGIES TARGETING SPATIAL RELATIONSHIP ANALYSES
Although imaging is the most efficient method for analyzing spatial information while preserving the tissue architecture, conventional immunohistochemistry (IHC) and immunofluorescence analyses on FFPE tissues have limitations determined by the number of species in which different antibodies are produced, as well as by the spectral overlap of fluorescence. These technical limitations are particularly disadvantageous for immune cell analyses where identification of cell types and phenotypes requires multiple lineage markers. Although traditional flow cytometry and recent mass cytometry technologies are capable of highly multiplexed evaluation of epitopes, these approaches also have restrictions, in that single‐cell suspensions are required, thus the tissue architecture is lost. While traditional methods have technical limitations in the analysis of spatial information, innovative technologies are emerging that hold great promise as single‐cell analysis platforms that preserve tissue integrity (Table 1).
TABLE 1.
Emerging methodologies for multiplexed spatial relationship analyses
| Extending spatial capability to multiplexed analysis | Extending multiplex capability to imaging methods |
|---|---|
| Transcriptomics | |
| Spatial mapping of scRNAseq | Multiplexed fluorescence in situ hybridization |
| In situ hybridization of landmark genes 46 | SeqFISH 51 |
| Reporter‐based cell sorting (NICHE‐seq) 47 | MERFISH 52 |
| Spatial transcriptome profiling | |
| Spatial transcriptomics 48 | |
| Slide‐seq | |
| Digital spatial profiling 50 | |
| Proteomics | |
| High parameter cytometry imaging | Multiplex immunofluorescence |
| Imaging mass cytometry 53 | Antibody stripping (Opal) 55 |
| Multiplexed ion beam imaging (MIBI) 54 | Bleaching 56 |
| Oligonucleotide 57 | |
| Multiplex IHC | |
| Multiplex IHC and image cytometry 3 | |
5.1. Spatially resolved transcriptomics
Single‐cell RNA sequencing is a powerful platform for analyzing single‐cell based genetic properties and heterogeneity within a tumor. 47 Because single‐cell RNA sequencing is restricted in its ability to analyze spatial information due to lost tissue structure, several developments have been undertaken to reconstruct spatial information by combining in situ hybridization of landmark genes 48 and fluorescence reporter‐based cell sorting. 49 Spatial detection of particular transcripts can be carried out using other several approaches. DNA‐barcoded microbead‐based spatial transcriptomics enables spatial detection of particular transcripts 50 , 51 although those methodologies are applicable for fresh frozen tissue, but not for FFPE tissues that are widely available clinical specimens. Digital spatial profiler technology on FFPE tissues provides an up to 1000‐plex assay based on oligonucleotide probes coupled to unique barcodes with a photocleavable linker, analyzed by a multiplexed probe detection system. 52 A major technical limitation of those methodologies is the lack of sufficient resolution to enable single‐cell analysis, thus further development of the methodologies is required. In view of fine resolution enabling single‐cell analysis, multiplexed FISH has been established using iterations of probe stripping. 53 , 54
5.2. Multiplexed proteomics
Using the multiplex ability of mass cytometry, imaging mass cytometry methods provide highly multiplexed data with subcellular spatial resolution for up to 100 protein markers on FFPE. 55 , 56 Those methodologies can be promising platforms if the costs of reagents and instruments become economically feasible for large number of studies.
Multiplex immunofluorescence has been developed using antibody stripping, 57 and bleaching fluorophores. 58 These technologies are accompanied by advancements in digital image analysis, enabling quantitative assessment of multiple biomarkers and cell phenotypes. 59 Furthermore, antibodies conjugated to oligonucleotide sequences enables highly multiplexed imaging. 60 , 61
5.3. Multiplex IHC and image cytometry
By revisiting traditional chromogen‐based IHC, we previously reported a practical and cost‐effective chromogenic sequential IHC method with iterative labeling, digital scanning, and subsequent antibody stripping of tissue sections. This approach enabled the simultaneous evaluation of 12+ biomarkers in a single FFPE tissue section 3 (Figure 5A,B). Furthermore, quantitative evaluation of multiplex IHC images was optimized using image cytometry analysis, as flow cytometry in imaging allows single‐cell analysis based on cell size, area, signal intensity, and location (Figure 5C,D). Simultaneously, PD‐L1 expression on tumor and myeloid cells can be quantitatively and spatially evaluated in a single tissue slide (Figure 5E). Most recently, this method has been updated using a combination of heat and chemical stripping of antibodies and chromogen in between immunodetection cycles that enabled quantitative assessment of 29 biomarkers in a single FFPE tissue section. 40 Importantly, this method is technically and economically equivalent to standard IHC, thus providing feasibility for large‐scale studies without significant cost.
FIGURE 5.
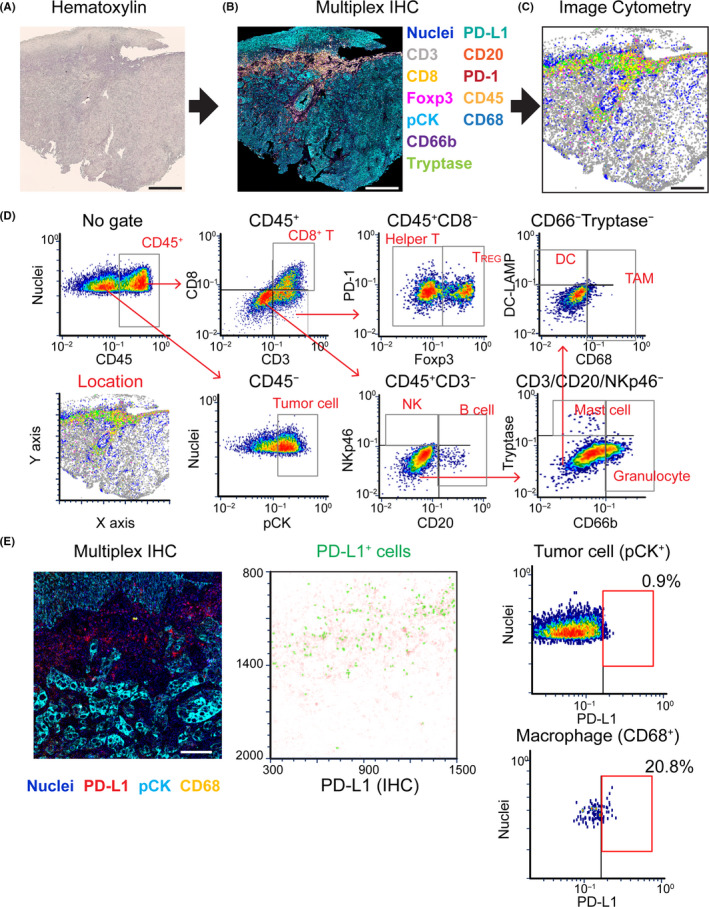
12‐biomarker multiplex immunohistochemistry (IHC) enables quantitative assessment of tumor immune microenvironment with preserved tissue architecture. A, B Images exhibit hematoxylin (A) and 12‐color multiplex IHC images (B) from a single formalin‐fixed paraffin‐embedded section of salivary gland carcinoma tissue. C, Image cytometric analysis enables visualization and quantification of 12+ different biomarkers with preserved location information. Scale bars, 500 μm. D, Gating strategies were applied for lineage identification in cytometric analysis. E, Image cytometry plots (right panels) exhibit PD‐L1 expression on tumor cells (pCK+) and CD68+ macrophages. The corresponding multiplex IHC image (left panel) and location plot (middle) are shown. Scale bar, 100 μm
5.4. Current challenges in spatial relationship analysis
There are several challenges for data analysis of immune spatial characteristics. As immune spatial analysis is an emerging approach for cancer research, there is a lack of standard statistical approaches for spatial relationships. A large number of reports analyze distance to the nearest neighboring cells 41 , 62 , 63 , 64 , however this method can be affected by cell density when higher cell density simply correlates with closer proximity. A possible solution to this issue is to use Ripley’s K function and pair correlation function analyses, which have been developed through ecological studies of plant distribution, and can evaluate spatial randomness at several distance scales by taking into account all neighbors rather than only the nearest cells. 40 , 65 , 66
As image acquisition and processing for the whole tissue typically exceed capabilities of most current methodologies, selection of a region of interest is a standard practice in imaging studies, which is a process to identify small regions to be analyzed. This generates another challenge in terms of unbiased identification of region of interest in the morphological heterogeneity of tumor tissue structure. Possible solutions for this are whole tissue‐based mapping analysis (Figure 3A,B) and application of machine learning algorithms. 67 Seamlessly integrated microscopic and macroscopic image analyses provide comprehensive spatial information, enabling an understanding of the entire characteristics of the tumor immune microenvironment (Figure 1).
6. CONCLUSION
Based on technical advancements, the tumor immune microenvironment has been intensively analyzed in view of spatial information. Overcoming current challenges in normalization and statistical considerations, and the accumulation of evidence based on integrative analysis of cell‐cell proximity as well as tissue structure can provide potential breakthroughs in biomarker development.
ETHICAL CONSIDERATIONS
The study was approved by the institutional review board at Kyoto Prefectural University of Medicine (ERB‐C‐43‐4).
CONFLICT OF INTEREST
The authors declare no conflict of interest.
ACKNOWLEDGMENTS
This work was supported by grants from the Japanese Ministry of Education, Culture, Sports, Science and Technology (17H07016 and 19K18814), and the public promoting association Asano foundation for studies on medicine, and by the research promotion award from the Oto‐Rhino‐Laryngological Society of Japan, Inc.
Tsujikawa T, Mitsuda J, Ogi H, et al. Prognostic significance of spatial immune profiles in human solid cancers. Cancer Sci. 2020;111:3426–3434. 10.1111/cas.14591
REFERENCES
- 1. Schreiber RD, Old LJ, Smyth MJ. Cancer immunoediting: integrating immunity’s roles in cancer suppression and promotion. Science. 2011;331(6024):1565‐1570. [DOI] [PubMed] [Google Scholar]
- 2. Palucka AK, Coussens LM. The basis of oncoimmunology. Cell. 2016;164(6):1233‐1247. [DOI] [PMC free article] [PubMed] [Google Scholar]
- 3. Tsujikawa T, Kumar S, Borkar RN, et al. Quantitative multiplex immunohistochemistry reveals myeloid‐inflamed tumor‐immune complexity associated with poor prognosis. Cell Rep. 2017;19(1):203‐217. [DOI] [PMC free article] [PubMed] [Google Scholar]
- 4. Komohara Y, Jinushi M, Takeya M. Clinical significance of macrophage heterogeneity in human malignant tumors. Cancer Sci. 2014;105(1):1‐8. [DOI] [PMC free article] [PubMed] [Google Scholar]
- 5. Sahai E, Astsaturov I, Cukierman E, et al. A framework for advancing our understanding of cancer‐associated fibroblasts. Nature Reviews Cancer. 2020;20 (3):174–186. [DOI] [PMC free article] [PubMed] [Google Scholar]
- 6. Lane RSRS, Femel J, Breazeale APAP, et al. IFNγ‐activated dermal lymphatic vessels inhibit cytotoxic T cells in melanoma and inflamed skin. J Exp Med. 2018;215(12):3057‐3074. [DOI] [PMC free article] [PubMed] [Google Scholar]
- 7. Galon J, Costes A, Sanchez‐Cabo F, et al. Type, density, and location of immune cells within human colorectal tumors predict clinical outcome. Science. 2006;313(5795):1960‐1964. [DOI] [PubMed] [Google Scholar]
- 8. Zhang L, Conejo‐Garcia JR, Katsaros D, et al. Intratumoral T cells, recurrence, and survival in epithelial ovarian cancer. N Engl J Med. 2003;348(3):203‐213. [DOI] [PubMed] [Google Scholar]
- 9. Bindea G, Mlecnik B, Tosolini M, et al. Spatiotemporal dynamics of intratumoral immune cells reveal the immune landscape in human cancer. Immunity. 2013;39(4):782‐795. [DOI] [PubMed] [Google Scholar]
- 10. Gong C, Anders RA, Zhu Q, et al. Quantitative characterization of CD8+ T cell clustering and spatial heterogeneity in solid tumors. Front Oncol. 2019;8:649. [DOI] [PMC free article] [PubMed] [Google Scholar]
- 11. Sharma P, Shen Y, Wen S, et al. CD8 tumor‐infiltrating lymphocytes are predictive of survival in muscle‐invasive urothelial carcinoma. Proc Natl Acad Sci USA. 2007;104(10):3967‐3972. [DOI] [PMC free article] [PubMed] [Google Scholar]
- 12. Wang B, Wu S, Zeng H, et al. CD103+ tumor infiltrating lymphocytes predict a favorable prognosis in urothelial cell carcinoma of the bladder. J Urol. 2015;194(2):556‐562. [DOI] [PubMed] [Google Scholar]
- 13. Tuminello S, Veluswamy R, Lieberman‐Cribbin W, et al. Prognostic value of immune cells in the tumor microenvironment of early‐stage lung cancer: a meta‐analysis. Oncotarget. 2019;10(67):7142. [DOI] [PMC free article] [PubMed] [Google Scholar]
- 14. Masugi Y, Abe T, Ueno A, et al. Characterization of spatial distribution of tumor‐infiltrating CD8+ T cells refines their prognostic utility for pancreatic cancer survival. Mod Pathol. 2019;32(10):1495‐1507. [DOI] [PubMed] [Google Scholar]
- 15. Li X, Gruosso T, Zuo D, et al. Infiltration of CD8+ T cells into tumor cell clusters in triple‐negative breast cancer. Proc Natl Acad Sci. 2019;116(9):3678‐3687. [DOI] [PMC free article] [PubMed] [Google Scholar]
- 16. Sugie T, Sato E, Miyashita M, et al. Multispectral quantitative immunohistochemical analysis of tumor‐infiltrating lymphocytes in relation to programmed death‐ligand 1 expression in triple‐negative breast cancer. Breast Cancer. 2020;27(4):519–526. [DOI] [PubMed] [Google Scholar]
- 17. Zhou C, Li J, Wu Y, Diao P, Yang J, Cheng J. High density of intratumor CD45RO+ memory tumor‐infiltrating lymphocytes predicts favorable prognosis in patients with oral squamous cell carcinoma. J Oral Maxillofac Surg. 2019;77(3):536‐545. [DOI] [PubMed] [Google Scholar]
- 18. Zhu Q, Cai M‐Y, Chen C‐L, et al. Tumor cells PD‐L1 expression as a favorable prognosis factor in nasopharyngeal carcinoma patients with pre‐existing intratumor‐infiltrating lymphocytes. Oncoimmunology. 2017;6(5):e1312240. [DOI] [PMC free article] [PubMed] [Google Scholar]
- 19. Dunn GP, Bruce AT, Ikeda H, Old LJ, Schreiber RD. Cancer immunoediting: from immunosurveillance to tumor escape. Nat Immunol. 2002;3(11):991‐998. [DOI] [PubMed] [Google Scholar]
- 20. Blair AB, Kim V, Muth S, et al. Dissecting the stromal signaling and regulation of myeloid cells and memory effector T cells in pancreatic cancer. Clin Cancer Res. 2019;25(17):5351‐5363. [DOI] [PMC free article] [PubMed] [Google Scholar]
- 21. Spranger S, Spaapen RM, Zha Y, et al. Up‐regulation of PD‐L1, IDO, and Tregs in the melanoma tumor microenvironment is driven by CD8+ T cells. Sci Transl Med. 2013;5(200):200ra116. [DOI] [PMC free article] [PubMed] [Google Scholar]
- 22. Peng W, Chen JQ, Liu C, et al. Loss of PTEN promotes resistance to T cell–mediated immunotherapy. Cancer Discov. 2016;6(2):202‐216. [DOI] [PMC free article] [PubMed] [Google Scholar]
- 23. Means C, Clayburgh DR, Maloney L, et al. Tumor immune microenvironment characteristics of papillary thyroid carcinoma are associated with histopathological aggressiveness and BRAF mutation status. Head Neck. 2019;41(8):2636‐2646. [DOI] [PubMed] [Google Scholar]
- 24. Hendry S, Salgado R, Gevaert T, et al. Assessing tumor infiltrating lymphocytes in solid tumors: a practical review for pathologists and proposal for a standardized method from the International Immuno‐Oncology Biomarkers Working Group: Part 1: Assessing the host immune response, TILs in invas. Adv Anat Pathol. 2017;24(5):235. [DOI] [PMC free article] [PubMed] [Google Scholar]
- 25. Helmink BA, Reddy SM, Gao J, et al. B cells and tertiary lymphoid structures promote immunotherapy response. Nature. 2020;577:549–555. [DOI] [PMC free article] [PubMed] [Google Scholar]
- 26. Lutz ER, Wu AA, Bigelow E, et al. Immunotherapy converts nonimmunogenic pancreatic tumors into immunogenic foci of immune regulation. Cancer Immunol Res. 2014;2(7):616‐631. [DOI] [PMC free article] [PubMed] [Google Scholar]
- 27. Li H, Wang J, Liu H, et al. Existence of intratumoral tertiary lymphoid structures is associated with immune cells infiltration and predicts better prognosis in early‐stage hepatocellular carcinoma. Aging (Albany NY). 2020;12(4):3451. [DOI] [PMC free article] [PubMed] [Google Scholar]
- 28. Ladányi A, Kiss J, Somlai B, et al. Density of DC‐LAMP+ mature dendritic cells in combination with activated T lymphocytes infiltrating primary cutaneous melanoma is a strong independent prognostic factor. Cancer Immunol Immunother. 2007;56(9):1459‐1469. [DOI] [PMC free article] [PubMed] [Google Scholar]
- 29. Dieu‐Nosjean M‐C, Antoine M, Danel C, et al. Long‐term survival for patients with non–small‐cell lung cancer with intratumoral lymphoid structures. J Clin Oncol. 2008;26(27):4410‐4417. [DOI] [PubMed] [Google Scholar]
- 30. Peske JD, Thompson ED, Gemta L, Baylis RA, Fu Y‐X, Engelhard VH. Effector lymphocyte‐induced lymph node‐like vasculature enables naive T‐cell entry into tumours and enhanced anti‐tumour immunity. Nat Commun. 2015;6(1):1‐15. [DOI] [PMC free article] [PubMed] [Google Scholar]
- 31. Schweiger T, Berghoff AS, Glogner C, et al. Tumor‐infiltrating lymphocyte subsets and tertiary lymphoid structures in pulmonary metastases from colorectal cancer. Clin Exp Metastasis. 2016;33(7):727‐739. [DOI] [PMC free article] [PubMed] [Google Scholar]
- 32. Castino GF, Cortese N, Capretti G, et al. Spatial distribution of B cells predicts prognosis in human pancreatic adenocarcinoma. Oncoimmunology. 2016;5(4):e1085147. [DOI] [PMC free article] [PubMed] [Google Scholar]
- 33. Tumeh PC, Harview CL, Yearley JH, et al. PD‐1 blockade induces responses by inhibiting adaptive immune resistance. Nature. 2014;515(7528):568‐571. [DOI] [PMC free article] [PubMed] [Google Scholar]
- 34. y Cajal SR, Sesé M, Capdevila C, et al. Clinical implications of intratumor heterogeneity: challenges and opportunities. J Mol Med. 2020;98(2):161‐177. [DOI] [PMC free article] [PubMed] [Google Scholar]
- 35. Emerson RO, Sherwood AM, Rieder MJ, et al. High‐throughput sequencing of T‐cell receptors reveals a homogeneous repertoire of tumour‐infiltrating lymphocytes in ovarian cancer. J Pathol. 2013;231(4):433‐440. [DOI] [PMC free article] [PubMed] [Google Scholar]
- 36. Nearchou IP, Lillard K, Gavriel CG, Ueno H, Harrison DJ, Caie PD. Automated analysis of lymphocytic infiltration, tumor budding, and their spatial relationship improves prognostic accuracy in colorectal cancer. Cancer Immunol Res. 2019;7(4):609‐620. [DOI] [PubMed] [Google Scholar]
- 37. Gide TN, Silva IP, Quek C, et al. Close proximity of immune and tumor cells underlies response to anti‐PD‐1 based therapies in metastatic melanoma patients. Oncoimmunology. 2020;9(1):1659093. [DOI] [PMC free article] [PubMed] [Google Scholar]
- 38. Saltz J, Gupta R, Hou L, et al. Spatial organization and molecular correlation of tumor‐infiltrating lymphocytes using deep learning on pathology images. Cell Rep. 2018;23(1):181‐193. [DOI] [PMC free article] [PubMed] [Google Scholar]
- 39. Kather JN, Suarez‐Carmona M, Charoentong P, et al. Topography of cancer‐associated immune cells in human solid tumors. Elife. 2018;7:e36967. [DOI] [PMC free article] [PubMed] [Google Scholar]
- 40. Banik G, Betts CB, Liudahl SM, et al. High‐dimensional multiplexed immunohistochemical characterization of immune contexture in human cancers. Methods in Enzymology. Elsevier. 2020;1‐20. [DOI] [PMC free article] [PubMed] [Google Scholar]
- 41. Barua S, Fang P, Sharma A, et al. Spatial interaction of tumor cells and regulatory T cells correlates with survival in non‐small cell lung cancer. Lung Cancer. 2018;117:73‐79. [DOI] [PMC free article] [PubMed] [Google Scholar]
- 42. Szczerba BM, Castro‐Giner F, Vetter M, et al. Neutrophils escort circulating tumour cells to enable cell cycle progression. Nature. 2019;566(7745):553‐557. [DOI] [PubMed] [Google Scholar]
- 43. Wyckoff JB, Wang Y, Lin EY, et al. Direct visualization of macrophage‐assisted tumor cell intravasation in mammary tumors. Cancer Res. 2007;67(6):2649‐2656. [DOI] [PubMed] [Google Scholar]
- 44. Tsujikawa T, Thibault G, Azimi V, et al. Robust cell detection and segmentation for image cytometry reveal Th17 cell heterogeneity. Cytom Part A. 2019;95(4):389‐398. [DOI] [PMC free article] [PubMed] [Google Scholar]
- 45. Chang AY, Bhattacharya N, Mu J, et al. Spatial organization of dendritic cells within tumor draining lymph nodes impacts clinical outcome in breast cancer patients. J Transl Med. 2013;11(1):242. [DOI] [PMC free article] [PubMed] [Google Scholar]
- 46. Reddy SM, Reuben A, Barua S, et al. Poor response to neoadjuvant chemotherapy correlates with mast cell infiltration in inflammatory breast cancer. Cancer Immunol Res. 2019;7(6):1025‐1035. [DOI] [PMC free article] [PubMed] [Google Scholar]
- 47. Patel AP, Tirosh I, Trombetta JJ, et al. Single‐cell RNA‐seq highlights intratumoral heterogeneity in primary glioblastoma. Science. 2014;344(6190):1396‐1401. [DOI] [PMC free article] [PubMed] [Google Scholar]
- 48. Satija R, Farrell JA, Gennert D, Schier AF, Regev A. Spatial reconstruction of single‐cell gene expression data. Nat Biotechnol. 2015;33(5):495‐502. [DOI] [PMC free article] [PubMed] [Google Scholar]
- 49. Medaglia C, Giladi A, Stoler‐Barak L, et al. Spatial reconstruction of immune niches by combining photoactivatable reporters and scRNA‐seq. Science. 2017;358(6370):1622‐1626. [DOI] [PMC free article] [PubMed] [Google Scholar]
- 50. Moncada R, Barkley D, Wagner F, et al. Integrating microarray‐based spatial transcriptomics and single‐cell RNA‐seq reveals tissue architecture in pancreatic ductal adenocarcinomas. Nat Biotechnol. 2020;38(3):333‐342. [DOI] [PubMed] [Google Scholar]
- 51. Rodriques SG, Stickels RR, Goeva A, et al. Slide‐seq: A scalable technology for measuring genome‐wide expression at high spatial resolution. Science. 2019;363(6434):1463‐1467. [DOI] [PMC free article] [PubMed] [Google Scholar]
- 52. Toki MI, Merritt CR, Wong PF, et al. High‐plex predictive marker discovery for melanoma immunotherapy‐treated patients using digital spatial profiling. Clin Cancer Res. 2019;25(18):5503‐5512. [DOI] [PMC free article] [PubMed] [Google Scholar]
- 53. Lubeck E, Coskun AF, Zhiyentayev T, Ahmad M, Cai L. Single‐cell in situ RNA profiling by sequential hybridization. Nat Methods. 2014;11(4):360. [DOI] [PMC free article] [PubMed] [Google Scholar]
- 54. Chen KH, Boettiger AN, Moffitt JR, Wang S, Zhuang X. Spatially resolved, highly multiplexed RNA profiling in single cells. Science. 2015;348(6233):aaa6090. [DOI] [PMC free article] [PubMed] [Google Scholar]
- 55. Wagner J, Rapsomaniki MA, Chevrier S, et al. A single‐cell atlas of the tumor and immune ecosystem of human breast cancer. Cell. 2019;177(5):1330‐1345. [DOI] [PMC free article] [PubMed] [Google Scholar]
- 56. Angelo M, Bendall SC, Finck R, et al. Multiplexed ion beam imaging of human breast tumors. Nat Med. 2014;20(4):436. [DOI] [PMC free article] [PubMed] [Google Scholar]
- 57. Stack EC, Wang C, Roman KA, Hoyt CC. Multiplexed immunohistochemistry, imaging, and quantitation: a review, with an assessment of Tyramide signal amplification, multispectral imaging and multiplex analysis. Methods. 2014;70(1):46‐58. [DOI] [PubMed] [Google Scholar]
- 58. Eng J, Thibault G, Luoh S‐W, Gray JW, Chang YH, Chin K. Cyclic multiplexed‐immunofluorescence (cmIF), a highly multiplexed method for single‐cell analysis In: Thurin M, Cesano A, Marincola F, eds. Biomarkers for Immunotherapy of Cancer . New York, NY: Humana; 2020:521‐562. [DOI] [PubMed] [Google Scholar]
- 59. Chang YH, Chin K, Thibault G, Eng J, Burlingame E, Gray JW. RESTORE: Robust intEnSiTy nORmalization mEthod for multiplexed imaging. Commun Biol. 2020;3(1):1‐9. [DOI] [PMC free article] [PubMed] [Google Scholar]
- 60. McMahon N, Jones J, Solanki A, , et al. Antibody conjugated oligonucleotides as a platform for cyclic immunofluorescent staining. Microsc Microanal [Internet]. 2019;25(S2):1206‐1207. [Google Scholar]
- 61. Goltsev Y, Samusik N, Kennedy‐Darling J, et al. Deep profiling of mouse splenic architecture with CODEX multiplexed imaging. Cell. 2018;174(4):968‐981. [DOI] [PMC free article] [PubMed] [Google Scholar]
- 62. Zhang AW, McPherson A, Milne K, et al. Interfaces of malignant and immunologic clonal dynamics in ovarian cancer. Cell. 2018;173(7):1755‐1769. [DOI] [PubMed] [Google Scholar]
- 63. Enfield KSS, Martin SD, Marshall EA, et al. Hyperspectral cell sociology reveals spatial tumor‐immune cell interactions associated with lung cancer recurrence. J Immunother cancer. 2019;7(1):1‐13. [DOI] [PMC free article] [PubMed] [Google Scholar]
- 64. Huang Y‐K, Wang M, Sun Y, et al. Macrophage spatial heterogeneity in gastric cancer defined by multiplex immunohistochemistry. Nat Commun. 2019;10(1):1‐15. [DOI] [PMC free article] [PubMed] [Google Scholar]
- 65. Carstens JL, De Sampaio PC, Yang D, et al. Spatial computation of intratumoral T cells correlates with survival of patients with pancreatic cancer. Nat Commun. 2017;8(1):1‐13. [DOI] [PMC free article] [PubMed] [Google Scholar]
- 66. Lagache T, Lang G, Sauvonnet N, Olivo‐Marin J‐C. Analysis of the spatial organization of molecules with robust statistics. PLoS One. 2013;8(12):e80914. [DOI] [PMC free article] [PubMed] [Google Scholar]
- 67. Shirinifard A, Thiagarajan S, Vogel P, Sablauer A. Detection of phenotypic alterations using high‐content analysis of whole‐slide images. J Histochem Cytochem. 2016;64(5):301‐310. [DOI] [PMC free article] [PubMed] [Google Scholar]


