

Abstract
The aim was to analyze the association between exosomal microRNA (miR)‐766‐3p expression levels in serum and the prognosis of esophageal squamous cell carcinoma (ESCC). The serum global exosomal miRNA expression of ESCC patients was measured by microRNA microarray. Quantitative real‐time PCR was used to analyze the expression levels of candidate miRNAs in both serum and tissues from ESCC patients. Wilcoxon tests were applied to evaluate clinical characteristics and their association with serum levels of exosomal miR‐766‐3p. A Cox regression model was used to identify prognostic factors. The effects of miR‐766‐3p expression on cell migration and invasion were examined using Transwell assays, and CCK‐8 assays were carried out to measure cell proliferation. The TNM stage was associated with high serum exosomal miR‐766‐3p levels of ESCC patients (P = .030). Higher serum exosomal miR‐766‐3p expression levels were associated with poor prognosis (for overall survival, hazard ratio [HR] [95% confidence interval (CI)], 2.21 [1.00, 4.87]; for disease‐free survival, HR [95% CI], 2.15 [1.01, 4.59]). However, we found no association between the expression of miR‐766‐3p in tissue and ESCC prognosis. In vitro results showed that miR‐766‐3p promotes cell migration and invasion, but not cell proliferation. By using dual‐luciferase reporter assay, HOXA13 was confirmed as a direct target gene of miR‐766‐3p. The ESCC patients with highly expressed serum exosomal miR‐766‐3p had a significantly worse survival. Therefore, serum exosomal miR‐766‐3p could serve as a prognostic marker for the assessment of ESCC.
Keywords: esophageal squamous cell carcinoma, exosome, miR‐766‐3p, prognosis, serum
We demonstrated that miR‐766 levels in serum exosomes significantly increased in esophageal squamous cell carcinoma with lymph node metastasis, and the upregulation of miR‐766 levels in serum exosomes predicts a poor prognosis for patients with esophageal squamous cell carcinoma. Therefore, miR‐766 levels in serum exosomes could serve as a prognostic marker to be used in assessing esophageal squamous cell carcinoma.
Abbreviations
- AUC
area under the ROC curve
- CI
confidence interval
- DFS
disease‐free survival
- ESCC
esophageal squamous cell carcinoma
- GO
gene ontology
- HR
hazard ratio
- KEGG
Kyoto Encyclopedia of Genes and Genomes
- miR
microRNA
- miRNA
microRNA
- NC
negative control
- OD
optical density
- OS
overall survival
- qRT‐PCR
quantitative real‐time PCR
- ROC
receiver operating characteristic
- TCGA
The Cancer Genome Atlas
1. INTRODUCTION
Esophageal cancer is the seventh leading cause of cancer‐related mortality worldwide and ranks fifth in terms of mortality in China. 1 , 2 According to its pathological characteristics, esophageal cancer is mainly classified either as ESCC or esophageal adenocarcinoma; ESCC accounts for nearly 90% of cases in China. 3 In recent decades, although great improvement has been achieved in multimodality treatment, such as radical operation, chemotherapy, and radiotherapy, 4 the prognosis of patients with ESCC remains poor. 5 Lymph node metastasis is associated with recurrence and is a prognostic factor in ESCC patients. 6 , 7 Therefore, it is urgently needed to identify novel lymph node metastasis biomarkers to predict the prognosis of ESCC more accurately.
MicroRNAs are small noncoding RNAs that are thought to play important roles in many biological pathways. 8 Altered expression of miRNAs is involved in the regulation of crucial pathological processes in disease progression. 9 , 10 Exosomes are small membrane vesicles of endocytic origin that are released into the extracellular environment. 11 These exosomes contain protein and selectively packaged RNA (such as miRNAs), and exosomes are vesicles that cells use to communicate with one other through the exchange of these components. 12 Exosomes provide an enriched source of miRNAs for biomarker profiling because, by being in cell‐free blood fractions, they are protected from RNases in a way that their intracellular miRNA counterparts are not. 13 Mounting evidence confirmed exosomal miRNAs are a promising source of noninvasive biomarkers for tumor progression of various cancers. 14 , 15
MicroRNA‐766 is an extensively studied member of the miRNAs. A recent study showed that tissue miR‐766 was associated with prognosis in hepatocellular carcinoma patients. 16 Mechanistically, miR‐766 plays its roles by suppressing the expression of target genes. Functional studies have indicated that miR‐766 can promote cell proliferation by directly targeting SOX6 expression in colorectal cancer 17 or by directly targeting NR3C2 expression in hepatocellular carcinoma. 16 However, the role of serum exosomal miR‐766‐3p in ESCC progression remains elusive.
In the present study, we undertook a microarray analysis to detect miRNA expression changes in exosomes from serum of ESCC patients. We further evaluated the expression of the miR‐766‐3p in serum exosome and tissue from ESCC patients by using qRT‐PCR, and cell experiments were carried out to explore the function of miR‐766‐3p in ESCC. Moreover, we used bioinformatic analysis and dual‐luciferase reporter assay to predict and identify the potential target gene of miR‐766‐3p in ESCC. Our research revealed the role of serum exosomal miR‐766‐3p and provided a novel prognostic biomarker for ESCC.
2. METHODS
2.1. Patients and samples
We undertook a study of patients who were recently diagnosed with ESCC at the Fujian Cancer Hospital & Fujian Medical University Cancer Hospital from December 2014 to August 2017. All enrolled patients underwent face‐to‐face interviews by trained interviewers using a standardized questionnaire. We recruited subjects who underwent surgery at Fujian Cancer Hospital & Fujian Medical University Cancer Hospital. Written informed consent was obtained from participants. The diagnoses were confirmed by pathologists from the hospital. Patients with other cancers were excluded from this study. All of the patients in this study did not receive chemotherapy or radiotherapy before they underwent surgical excision. Tumor stages were determined according to the American Joint Committee on Cancer TNM staging criteria. In preliminary screening, miRNAs were isolated from exosomes from the serum of ESCC patients with lymph node metastasis (n = 5), sex and age (± 5) matched ESCC patients with nonlymph node metastasis (n = 5), and normal control individuals (n = 5). In this study, we used microarray analysis to reveal the serum exosomal miRNA expression profiles, as tested from the above 3 groups (A group, ESCC with lymph node metastasis vs ESCC with nonlymph node metastasis; B group, ESCC with lymph node metastasis vs normal control individuals; and C group, ESCC with lymph node metastasis vs postoperative ESCC with lymph node metastasis; Figure S1).
Esophageal squamous cell carcinoma with lymph node metastasis was identified if patients had 10 or more lymph nodes dissected and the number of lymph node metastases was 1 or more. Esophageal squamous cell carcinoma with nonlymph node metastasis was defined if 10 or more lymph nodes were dissected and the number of lymph node metastases was 0. Blood sampling was carried out before surgery. In addition, postoperative blood samples were also collected from ESCC patients with lymph node metastasis. Tissue samples were obtained from patients who underwent surgery at Fujian Cancer Hospital & Fujian Medical University Cancer Hospital between December 2014 and August 2017. A total of 79 serum samples and 88 pairs of fresh‐frozen tissues from patients with ESCC were collected. This study was reviewed and approved by the Ethical Committee of Fujian Medical University (No. 2014095).
2.2. Blood processing, serum exosome isolation, and confirmed exosomes
Blood was collected in a serum clot activator tube and then processed by centrifugation. Centrifugation was carried out at 367 g for 10 minutes, and 2 mL serum was stored in Eppendorf tubes at −80°C for later use. Serum derived exosomes were isolated from 400 μL serum using the ExoQuick (SBI) as per the manufacturer’s instructions. Briefly, serum samples were spun at 3000 g for 15 minutes to remove cells and debris. Next, 125 μL exosome isolation reagent was added to clarified supernatants and samples were incubated at 4°C for 30 minutes. The precipitated exosomes were recovered by centrifugation at 1500 g for 30 minutes at room temperature. Exosome pellets were resuspended in 40 μL PBS. The presence of particles consistent in size with exosomes was confirmed using transmission electron microscopy (Hitachi).
2.3. Western blot analysis
To further validate our exosome preparations, we undertook western blot analyses for exosomal markers CD63 and CD81. Exosome protein was homogenized with RIPA lysis buffer (Bi Yuntian) and the SDS‐polyacrylamide gels and transferred to nitrocellulose membranes. The membranes were then blocked with 5% nonfat dry milk in TBST for 2 hours and then probed with indicated Abs overnight at 4°C. The HRP‐conjugated goat anti‐rabbit or anti‐mouse secondary Abs (SBI) were cultured for 1 hour, and enhanced chemiluminescence reagents (Wabcan) were used to visualize the bands. The membrane was observed after completing the development in a darkroom and photography.
2.4. Exosome miRNA extraction
MicroRNAs were isolated from exosomes using the Total TRIzol Reagent and Protein Isolation Kit (Life Technologies) and were eluted into 200 μL heated elution solution according to the manufacturer’s protocol. The purity and concentration of all RNA samples were quantified spectrophotometrically using the NanoDrop ND‐1000 system (NanoDrop) and the total exosome RNA of all samples over 200 ng.
2.5. MicroRNA microarray analysis
The sample preparation and microarray hybridization were carried out based on Agilent miRNA (Agilent Technologies). Briefly, total RNA from each sample was amplified and transcribed into fluorescent cRNA utilizing random primer according to the Agilent miRNA Complete Labeling and Hyb Kit protocol. The labeled miRNAs were hybridized onto the Agilent miRNA Array. After the slides were washed, the arrays were scanned by the Agilent scanner (G2565CA). Scanned images were then imported into Agilent Feature Extraction (version 10.7) for grid alignment and data extraction.
2.6. Quantitative real‐time PCR
Total RNA was isolated from the exosome. To validate miRNA expression, qRT‐PCR was carried out using the SYBR Premix Dimer‐Eraser kit (Takara) on the 7500 Fast Real‐Time PCR System (Applied Biosystems). U6 snRNA was used as an internal control. The primers for miR‐766‐3p and U6 were purchased from Guangzhou Funeng. The primers were as follows: miR‐766‐3p sequence, acuccagccccacagccucagc; and U6 sequence, tcgtgaagcgttccatatttttaa. The relative expression values for miR‐766 were normalized to U6 snRNA and calculated using the 2−ΔCT method.
2.7. Cell culture
The TE‐1 and KYSE150 cell lines were purchased from the Shanghai Institute of Biochemistry and Cell Biology and cultured in DMEM (Sigma) supplemented with 10% FBS (HyClone). The cells were cultured at 37°C in a humidified 5% CO2 incubator (Thermo Fisher Scientific). The single‐cell suspension was made after the cell lines were digested with 0.25% trypsin (Gibco) and pipetted using DMEM containing 10% FBS.
2.8. Cell transfection
The cells were assigned into NC (transfected with miR‐766‐3p NC), miR‐766‐3p inhibitors (transfected with miR‐766‐3p inhibitors), and miR‐766‐3p mimics (transfected with miR‐766‐3p mimics). The primer sequences were designed and synthesized by GenePharma. Serum‐free DMEM (250 μL) was applied to dilute 5 μL Lipofectamine 2000 and cells were mixed and incubated at room temperature for 5 minutes. Both of the aforementioned were mixed, incubated at room temperature for 20 minutes, and added into the wells of a cell culture plate. Cells were cultured at 37℃ with 5% CO2 for 6‐8 hours, and then the medium was replaced. After culturing for 24‐48 hours, the cells were used for further experimentation.
2.9. Transwell assays
In this procedure, 48 hours after transfection, the cells were digested in serum‐free medium with 24 hours of starvation, and then washed 3 times with PBS. Cells (5 × 10⁴) in serum‐free DMEM were plated in the upper chamber (coated without 50 mg/L Matrigel for migration and with Matrigel for invasion assay), while 600 μL full medium was placed in the lower chamber. The remaining cells on the upper surface were removed 24 hours after incubation, and migrating or invading cells were fixed with 5% glutaraldehyde and stained with 0.1% crystal violet. For each experiment, 4 fields of view were counted, and the experiments were carried out at least 3 times.
2.10. Cell Counting Kit‐8 assay
The CCK‐8 assay was carried out according to the manufacturer’s instructions (Sigma). In brief, TE‐1 and KYSE150 cells were seeded at a density of 3 × 10³‐6 × 10³ cells/well in a 96‐well plate and treated with ethanol. After 24, 48, and 72 hours, 10 μL CCK‐8 solution was added to each well of the plate, and the wells were incubated for 2 hours. The OD value in each well was measured and recorded at a wavelength of 450 nm by an enzyme immunoassay instrument (Denovix). Each experiment was carried out in triplicate.
2.11. Dual‐luciferase reporter assay
Four luciferase plasmids (including psicheck2 vector, miRNA mimics NC + HOXA13(WT), miR‐766‐3p mimics + HOXA13(WT), miR‐766‐3p mimics + HOXA13(MUT)) were constructed. The constructed plasmids were transfected into HEK293 cells. After 48 hours, cells were lysed and the luciferase activity was determined using the Thermo Scientific Fluoroskan Ascent FL (Thermo Fisher Scientific) according to the manufacturer’s recommendation. Then, to analyze the association between miR‐766‐3p and HOXA13 gene expression, the vectors with miR‐766‐3p or miRNA mimics NC were transfected into TE‐1, total RNA was extracted using the TRIzol Reagent and Protein Isolation Kit (Life Technologies). The qRT‐PCR was undertaken using a 7500 Fast Real‐Time PCR System (Applied Biosystems), and data were analyzed using the 2−ΔCt method. GAPDH was introduced as the inner references, the sequences of HOXA13 gene and GAPDH were listed in Table S1.
2.12. The Cancer Genome Atlas datasets analysis
Genome‐wide microRNA expression profiles and clinical information for ESCC patients were downloaded from TCGA (https://portal.gdc.cancer.gov/). After excluding patients without complete clinical and survival information, a total of 96 patients with ESCC were enrolled in this study.
2.13. Follow‐up
The survival period of the patients was defined as the duration from the time of surgery to death or the last follow‐up day. Overall survival was measured from the date of diagnosis to the date of death due to any cause or the date of the most recent follow‐up. Disease‐free survival was measured from the date of diagnosis to the date of disease relapse (including recurrence and metastasis), death due to any cause, or the most recent follow‐up. All patients received close follow‐up observation for disease recurrence at 3‐month intervals during the first 1 year after treatment and every 6 months after that. The median follow‐up time was 36 months (range, 2‐61 months). The end of follow‐up was 31 November 2019.
2.14. Statistical analysis
Analysis of the differentially expressed miRNAs was carried out using the edgeR package in R. The differentially expressed miRNAs were identified through fold change filtering. Standard selection criteria for identifying the differentially expressed miRNAs were established as a fold change greater than 2 or less than or equal to 2, and P < .05. Hierarchical clustering analysis of the miRNAs was undertaken and graphs were generated using the gplots package in R software. Both ROC curves and the area under the ROC curves were used to evaluate the value of the identified serum exosomal miR‐766‐3p in detecting ESCC with lymph node metastasis. The Wilcoxon test was applied to evaluate clinical characteristics and their association with serum exosomal miR‐766‐3p. The survival rate was calculated using the Kaplan‐Meier method and the comparison of 2 groups was carried out using the log‐rank test. Univariate and multivariate analyses were undertaken to investigate prognostic factors for ESCC using the Cox regression model. R (3.5.3) was used for statistical analyses. A 2‐sided P value less than .05 was considered statistically significant.
3. RESULTS
3.1. Characterization of isolated serum exosomes
Exosome microvesicle clusters in the serum showed round vesicular membranes that measured 20‐100 nm (Figure S2A). To further validate our exosome preparations, we undertook western blot analyses for the exosomal markers CD63 and CD81. The expression of CD63 and CD81 was specifically observed as a dual band in isolated exosomes (Figure S2B). These findings showed that exosomes were enriched from serum that had been treated with ExoQuick.
3.2. Screening of differentially expressed exosome miRNAs
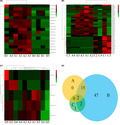
In preliminary screening, serum exosomal miRNAs were extracted from patients with ESCC and lymph node metastasis (n = 5), sex and age (±5) matched patients with ESCC and nonlymph node metastasis (n = 5), and normal control individuals (n = 5). Expression profiling data of miRNA were obtained by using miRNA microarray analysis. A comparison of miRNAs from exosomes that were isolated from ESCC with lymph node metastasis samples and ESCC with nonlymph node metastasis samples showed 16 significantly upregulated miRNAs from exosomes and 1 downregulated miRNA (Figure ). A total of 66 differentially expressed miRNAs from exosomes (42 significantly upregulated miRNAs and 24 significantly downregulated miRNAs) were identified in ESCC with lymph node metastasis when compared to normal control individuals (Figure 1B). In all, 5 miRNAs from exosomes were differentially expressed, including 3 that were upregulated and 2 that were downregulated in samples from preoperative ESCC patients with lymph node metastasis when compared to samples from postoperative ESCC patients with lymph node metastasis. (Figure 1C).
FIGURE 1.
MicroRNA (miRNA) expression signature of esophageal squamous cell carcinoma (ESCC) in 3 groups. A‐C, Heatmap representations of (A) the top deregulated miRNAs in ESCC with nonlymph node metastasis, (B) normal control individuals, and (C) postoperative ESCC with lymph node metastasis compared to ESCC with lymph node metastasis. D, Venn diagram reveals the overlap of miRNAs in the 3 groups
The differential expression of serum exosomal miRNAs in the 3 groups is presented in Table S2‐S4. The above 3 groups included: group A, ESCC with lymph node metastasis vs ESCC with nonlymph node metastasis (Table S2); group B, ESCC with lymph node metastasis vs normal control individuals (Table S3); and group C, ESCC with lymph node metastasis vs postoperative ESCC with lymph node metastasis (Table S4). As a result, 2 serum exosomal miRNAs, miR‐766‐3p, and miR‐4787‐3p were selected after Venn diagram analysis of the 3 groups (Figure 1D). Serum exosomal miRNA miR‐766‐3p had a smaller P value in comparing group A and group C. Therefore, in the present study, we analyzed the association between serum exosomal miR‐766‐3p expression and ESCC.
3.3. Expression of serum exosomal miR‐766‐3p of ESCC patients
To validate our preliminary serum exosomal miR‐766‐3p data, we undertook qRT‐PCR‐based expression profiling of 79 ESCC serum samples. We then analyzed the association between serum exosomal miR‐766‐3p expression levels and clinical factors, as presented in Table 1. Among the various clinical factors, we observed an association between advanced TNM stage (stage Ⅲ) and high expression of serum exosomal miR‐766‐3p (P = .030). No significant correlations were observed between serum exosomal miR‐766‐3p expression and sex, age, tumor size, surgical methods, or treatment method.
TABLE 1.
Association between serum exosomal microRNA‐766‐3p expression level and baseline characteristics in patients with esophageal squamous cell carcinoma
| Variable | n | M (P25, P75) | P value |
|---|---|---|---|
| Sex | 1.000 | ||
| Male | 58 | 2.01 (0.41, 4.30) | |
| Female | 21 | 0.89 (0.55, 5.69) | |
| Age (years) | 0.053 | ||
| ≤60 | 37 | 2.87 (0.71, 5.21) | |
| >60 | 42 | 1.08 (0.41, 2.72) | |
| Tumor size (cm) | 0.893 | ||
| ≤4 | 51 | 1.84 (0.42, 3.56) | |
| >4 | 23 | 2.40 (0.45, 5.08) | |
| TNM stage | 0.030 | ||
| I/II | 40 | 1.13 (0.41, 3.32) | |
| Ⅲ | 39 | 2.69 (0.75, 6.54) | |
| Surgical methods | 0.304 | ||
| 2FLND | 30 | 2.73 (0.74, 5.17) | |
| 3FLND | 45 | 1.71 (0.41, 3.87) | |
| Adjuvant chemotherapy | 0.700 | ||
| No | 44 | 1.82 (0.66, 4.61) | |
| Yes | 35 | 1.84 (0.31, 4.68) |
2FLND, 2‐field lymph node dissection; 3FLND, 3‐field lymph node dissection; M, median; P25, 25th percentile; P75, 75th percentile.
3.4. Expression of miR‐766‐3p in tissue of ESCC patients
We also evaluated the tissue miR‐766‐3p expression level from 88 ESCC samples by qRT‐PCR. There was no significant association between tissue miR‐766‐3p expression and clinical factors (such as sex, age, or tumor size; Table S5).
3.5. Serum exosomal miR‐766‐3p can predict lymph node metastasis
The predicted probabilities of detection of lymph node metastases derived by logistic regression analysis yielded greater AUC values in serum exosomal miR‐766‐3p and clinical characters (sex, age, and tumor size). The AUC of the logistic regression analysis model that included serum exosomal miR‐766‐3p expression and clinical characters (sex, age and tumor size) (model 1: AUC = 0.778; 95% CI, 0.672‐0.884, Figure S3), was higher than the model that included clinical characters only (model 2: AUC = 0.698; 95% CI, 0.579‐0.818; Figure S3). Our analyses showed that serum exosomal miR‐766‐3p expression and clinical characters can be a significant parameter to discriminate between nonmetastatic and metastatic ESCC patients.
3.6. Association between serum exosomal miR‐766‐3p expression and ESCC survival
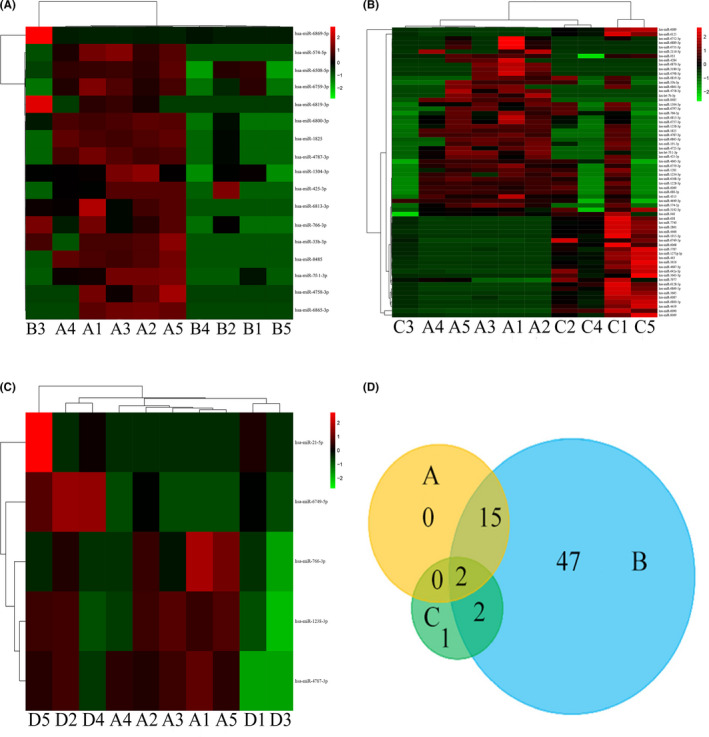
In the present study, the median OS time was 40.84 months (95% CI, 35.81‐45.86) and the 1‐year, 3‐year, and 5‐year survival rates were 90.50% (95% CI, 83.50‐97.50), 57.30% (95% CI, 46.30‐68.30), and 50.70% (95% CI, 38.94‐62.46), respectively. The patients were divided into 2 groups based on the median serum exosomal miR‐766‐3p expression. The log‐rank test showed that there was no significant difference (for OS, P = .060; for DFS, P = .075; Figure 2) in the survival between patients with higher and lower expression levels of serum exosomal miR‐766‐3p.
FIGURE 2.
Kaplan‐Meier survival curves showing the relationship between high or low serum exosomal microRNA‐766‐3p expression levels with the (A) overall survival and (B) disease‐free survival of patients with esophageal squamous cell carcinoma
To better evaluate the prognostic function of serum exosomal miR‐766‐3p in ESCC, we used Cox regression with adjustment for factors including sex, age, tumor size, TNM stage, surgical methods, treatment method, and serum exosomal miR‐766‐3p expression. After adjustment, we found that higher serum exosomal miR‐766‐3p expression levels were associated with poor prognoses (for OS, HR [95% CI], 2.21 [1.00, 4.87], Table 2; for DFS, HR [95% CI]: 2.15 [1.01, 4.59], Table 2). Collectively, these results suggest that serum exosomal miR‐766‐3p levels could have utility in predicting ESCC progression and surveillance for recurrence.
TABLE 2.
Univariate and multivariate analysis of overall survival and disease‐free survival in patients with esophageal squamous cell carcinoma according to serum exosomal microRNA (miR)‐766‐3p expression
| Variable | Overall survival | Disease‐free survival | ||
|---|---|---|---|---|
| Univariate | Multivariate a | Univariate | Multivariate a | |
| Sex | ||||
| Male | 1.00 | 1.00 | 1.00 | 1.00 |
| Female | 0.47 (0.19, 1.13) | 0.74 (0.28, 1.97) | 0.55 (0.25, 1.20) | 0.69 (0.28, 1.73) |
| Age (years) | ||||
| ≤60 | 1.00 | 1.00 | 1.00 | 1.00 |
| >60 | 1.83 (0.91, 3.67) | 2.60 (1.15, 5.90) | 2.07 (1.06, 4.03) | 2.58 (1.19, 5.64) |
| Tumor size (cm) | ||||
| ≤4 | 1.00 | 1.00 | 1.00 | 1.00 |
| >4 | 1.91 (0.96, 3.83) | 0.89 (0.38, 2.10) | 1.89 (0.97, 3.65) | 0.75 (0.33, 1.73) |
| TNM stage | ||||
| Ⅰ/Ⅱ | 1.00 | 1.00 | 1.00 | 1.00 |
| Ⅲ | 3.20 (1.56, 6.55) | 3.97 (1.49, 10.59) | 3.10 (1.58, 6.06) | 3.90 (1.55, 9.82) |
| Surgical methods | ||||
| 2FLND | 1.00 | 1.00 | 1.00 | 1.00 |
| 3FLND | 0.66 (0.33, 1.30) | 0.95 (0.44, 2.05) | 0.76 (0.39, 1.47) | 0.94 (0.46, 1.93) |
| Adjuvant chemotherapy | ||||
| No | 1.00 | 1.00 | 1.00 | 1.00 |
| Yes | 0.54 (0.27, 1.09) | 0.45 (0.21, 0.96) | 0.67 (0.35, 1.27) | 0.42 (0.20, 0.88) |
| Serum exosomal miR‐766‐3p | ||||
| Low expression group | 1.00 | 1.00 | 1.00 | 1.00 |
| High expression group | 1.90 (0.96, 3.76) | 2.21 (1.00, 4.87) | 1.77 (0.93, 3.36) | 2.15 (1.01, 4.59) |
Data are shown as Hazard ratio (95% confidence interval).
2FLND, 2‐field lymph node dissection; 3FLND, 3‐field lymph node dissection.
Adjusted for sex, age, tumor size, TNM stage, treatment method, and serum exosomal miR‐766‐3p expression.
3.7. Association of miR‐766‐3p expression in tissue with ESCC patient survival
The relationships between miR‐766‐3p expression in tissue and ESCC prognosis were also explored. The patients were divided into 2 groups based on the median expression of miR‐766‐3p in tissue, with 44 in the low expression group and 44 in the high expression group. A log‐rank test showed that there was no significant difference (for OS, P = .973; for DFS, P = .808, Figure S4) in the survival between the patients with higher and lower expression levels of miR‐766‐3p in tissue.
Cox regression with adjustment for factors (sex, age, tumor size, TNM stage, surgical methods, treatment method, and miR‐766‐3p expression in tissue) was used. Our results showed that there was no association between miR‐766‐3p expression in tissue and OS (HR = 0.84; 95% CI, 0.15‐4.77) or DFS (HR = 0.65; 95% CI, 0.11‐3.78) (Table S6). In addition, the miRNA expression microarray data of 96 ESCC from TCGA database were assessed. A log‐rank test showed that there was no significant difference (for OS, P = .700, Figure S5) in survival between patients with higher and lower expression levels of miR‐766‐3p.
3.8. Effects of miR‐766‐3p on migration and invasion of ESCC cells
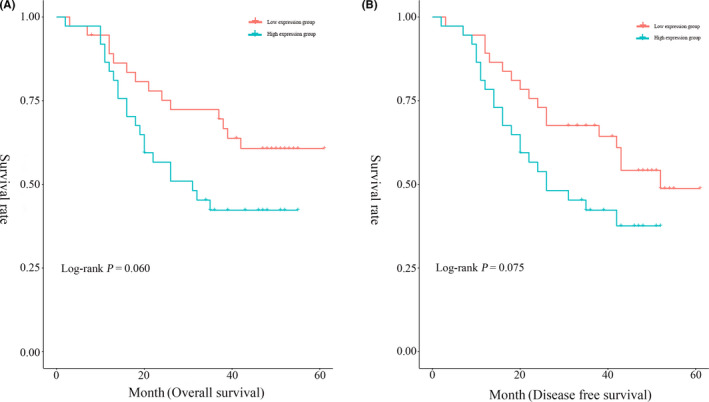
The results showed that the migration and invasion of TE‐1 cells were significantly increased in cells treated with miR‐766‐3p mimic (Figure 3A). Transwell migration assays showed that no significant difference was found in cell migration among the groups of KYSE150 cells treated with NC, miR‐766‐3p inhibitor, or miR‐766‐3p mimic (P > .05) (Figure 3B). However, Transwell invasion assays indicated that the miR‐766‐3p mimic‐treated group had higher numbers of KYSE150 cells penetrating the matrix than the NC group (P < .05). There was no significant difference in the number of cells penetrating the matrix among the groups treated with NC or miR‐766 inhibitor (P > .05) (Figure 3). These results suggested that miR‐766‐3p promoted ESCC cell progression.
FIGURE 3.
Migration and invasion of esophageal squamous cell carcinoma cells in vitro and in vivo. Cellular migration and invasion in (A) TE‐1 and (B) KYSE150 cells determined by Transwell assay. *P < .05. NC, negative control
3.9. Effects of miR‐766‐3p on ESCC cell proliferation
There was no significant difference in OD value among the groups treated with NC, miR‐766‐3p inhibitor, or miR‐766‐3p mimic (P > .05) in either TE‐1 cells or KYSE150 cells (Figure 4). These data suggest that the overexpression of miR‐766‐3p could not promote ESCC cell proliferation.
FIGURE 4.
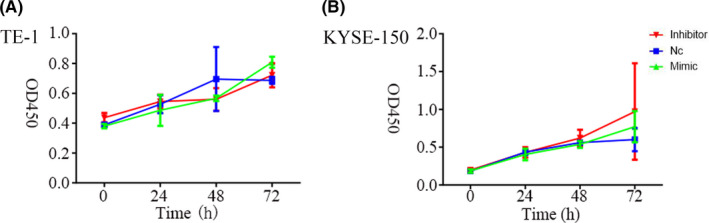
Cell proliferation curves of (A) TE‐1 and (B) KYSE150 esophageal squamous cell carcinoma cells after transfection, detected by CCK‐8 assay. NC, negative control; OD450, optical density at 450 nm
3.10. Potential targeted genes of miR‐766‐3p
We used 2 online tools to predict the potential target genes of miR‐766‐3p, TargetScan (http://www.targetscan.org/vert_72/) and miRDB (http://www.mirdb.org/). To improve the accuracy of target gene prediction and reduce the rate of false positives, we selected a common intersection among the 2 databases as a filtering condition by using a Venn diagram. We used DAVID for the GO analysis, and KEGG analysis. Both GO and KEGG enrichment analyses were carried out for the selected 432 target genes to investigate biological functions. Functional annotation analysis showed that the genes were significantly enriched in positive regulation of cell migration, cell‐cell adherens junction, and actin binding. Moreover, KEGG pathway analysis showed that the genes are mostly involved in the endocytosis pathway (Figure 5).
FIGURE 5.
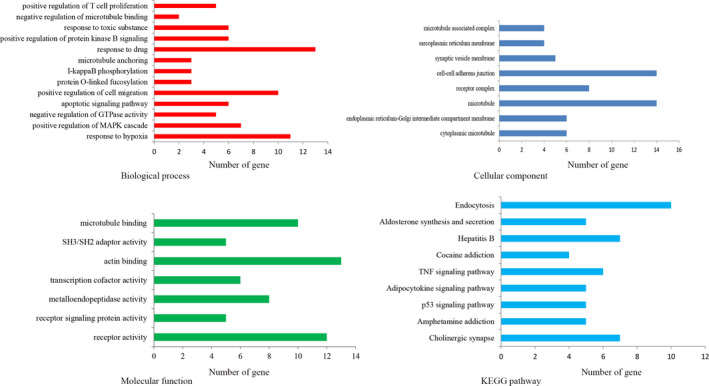
MicroRNA (miR)‐766‐3p is involved in multiple types of cancer‐related pathways. Gene ontology analysis of miR‐766‐3p according to biological process (top left), molecular function (bottom left), and cellular component (top right), and Kyoto Encyclopedia of Genes and Genomes (KEGG) pathway analysis (bottom right). TNF, tumor necrosis factor
Among 432 target genes, we found that HOXA13 plays a vital role in lymph node metastasis in patients with ESCC. 18 To clarify the HOXA13 target genes of miR‐766‐3p, we determined a binding relationship between miR‐766‐3p and HOXA13 using biological prediction tool TargetScan (Figure 6A). To validate the binding ability between miR‐766‐3p and HOXA13, we carried out the dual‐luciferase reporter assay. The results showed that the luciferase activity of HOXA13 (WT) could be inhibited by miR‐766‐3p mimic, whereas the luciferase activity of HOXA13 (MUT) remained unaffected (Figure 6B). Findings concluded by qRT‐PCR suggested that HOXA13 was downregulated in miR‐766‐3p mimic‐transfected TE‐1 cells (Figure 6C). Together, it could be elucidated that miR‐766‐3p could specifically bind with HOXA13.
FIGURE 6.
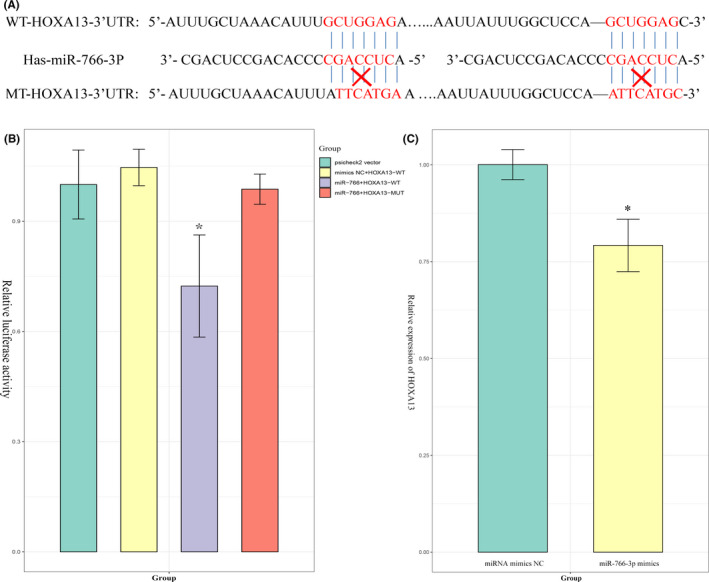
MicroRNA (miR)‐766‐3p directly targets HOXA13. A, Sequences of miR‐766‐3p that contain the HOXA13 binding sites (WT) or mutant binding sites (MT) are shown. B, Dual‐luciferase reporter assay was used to detect the interaction between miR‐766‐3p and HOXA13 in HEK293 cells. C, Effect of miR‐766‐3p mimics on the expression of HOXA13 in TE‐1 cells was detected by quantitative real‐time PCR. MUT, mutant; NC, negative control
4. DISCUSSION
Our study is the first to report that serum exosomal miR‐766‐3p expression is significantly increased in ESCC patients with advanced TNM stage. The upregulation of serum exosomal miR‐766‐3p levels can predict a poor prognosis for patients with ESCC. In addition, our data show that miR‐766‐3p promotes cell migration and invasion but not cell proliferation. MicroRNA‐766‐3p could specifically bind with HOXA13, and regulated HOXA13 gene expression.
MicroRNA‐766 was reported to act as an oncogene or a tumor suppressor gene in different tumors. 19 Studies showed that exosome‐associated miRNAs could play a critical role in cancer metastasis. 20 , 21 In the current study, the high expression of serum exosomal miR‐766‐3p was first shown to be associated with TNM stage in ESCC. Our finding was consistent with previous reports. 16 We assumed that serum exosomal miR‐766‐3p promoted lymph node metastasis of ESCC through the communication between cells of exosomes, leading to a poor prognosis for ESCC. In addition, we found that miR‐766‐3p levels in exosomes from serum was upregulated in ESCC through a significant association with OS and DFS. Similarly, Chao et al 16 confirmed that high expression of miR‐766 in tissue was positively correlated with poor OS and DFS in hepatocellular cancer (P < .05), based on TCGA. Therefore, our study reported that serum exosomal miR‐766‐3p might act as a potential prognostic biomarker for ESCC.
Although most exosomes in the blood are secreted by platelets and endothelial cells, various other tissues also secrete vesicles into the circulation. 22 , 23 Studies have reported that there is a significant difference in the expression of miRNA between exosomes and tissues. 24 A previous study indicated that high levels of miR‐1246 in exosomes from serum was associated with localized metastasis in prostate cancer, but there was no relationship between miR‐1246 expression in tissue and metastasis. This study hypothesized that miR‐1246 is selectively released into prostate cancer exosomes in prostate cancer tissue, leading to its high expression in serum samples. 24 In another study, Yan et al 25 showed that miR‐6869‐5p was downregulated in colorectal cancer both in serum exosomes and tumor tissues, and reduced levels of exosomal miR‐6869‐5p in serum were significant in colorectal cancer patients with lymph node metastasis. In this study, we found that serum exosomal miR‐766‐3p levels were higher than those in tissue (Z = −3.238, P = .001, data not shown). However, our finding revealed that the expression of miR‐776‐3p in tissue was no associated with prognosis in ESCC patients, and TCGA data analysis also indicated that there was no significant difference in survival between patients with higher and lower expression of miR‐766‐3p in tissue. In the present study, the Spearman correlation analysis of the expression of miR‐766 in serum exosome and tissue showed that there was lack of association between the expression of miR‐766 in serum exosomes and tissue (rs = −0.194, P = .388, data not shown). We only found that serum exosomal miR‐776‐3p expression, but not tissue miR‐776‐3p expression, was associated with prognosis in ESCC patients.
We undertook a series of in vitro analyses to understand the functional role of miR‐766‐3p in tumor progression in ESCC. The results of the analysis revealed that cell migration and invasion were all increased by miR‐766‐3p mimics, indicating that miR‐766‐3p mimics could promote tumor progression in ESCC; furthermore, the higher exosomal miR‐766‐3p expression level was associated with advanced TNM stage. In this study, the GO analysis results indicated that the positive regulation of cell migration and cell‐cell adherens junction, which might be involved in cell migration and angiogenesis. 26 , 27 , 28 In addition, KEGG analysis showed that the endocytic pathway is altered in cancer cells, and these alterations contribute to increased receptor recycling, thereby enhancing invasiveness. 29 MicroRNAs play their roles by suppressing the expression of target genes. 30 , 31 The biological interactions between miRNAs and their target genes are very complex. 32 In the present study, using dual‐luciferase reporter assay, we confirmed that miR‐766‐3p regulates HOXA13 expression in TE‐1 cells. HOXA13, a member of the homeobox genes, was found to be abnormally expressed in ESCC. 33 Therefore, these data suggested that serum exosomal miR‐766‐3p could regulate HOXA13 expression, which might have an association with prognosis in ESCC. Nevertheless, the precise mechanisms of miR‐766 in the regulation of HOXA13 expression in ESCC remain to be explored in further studies.
There are several limitations to our study. Only 79 pairs of ESCC in serum were analyzed in this study. A larger number of samples should be tested to further confirm our conclusion. Moreover, it is necessary to explore more functions of molecular mechanisms of serum exosomal miR‐766‐3p in the progression of ESCC.
In conclusion, ESCC patients with highly expressed serum exosomal miR‐766‐3p had a significantly worse OS and DFS. Therefore, serum exosomal miR‐766‐3p could serve as a prognostic marker for the assessment of ESCC.
CONFLICT OF INTEREST
The authors have no conflict of interest to declare.
Supporting information
Figure S1
Figure S2
Figure S3
Figure S4
Figure S5
Table S1‐S6
ACKNOWLEDGMENTS
We are grateful to the Fujian Cancer Hospital & Fujian Medical University Cancer Hospital for data collection. This study was supported by the National Key R&D Program of China (No. 2017YFC0907100), Medical Innovation Project of Fujian Province (No. 2018‐CX‐38), and the Startup Fund for Scientific Research, Fujian Medical University (No. 2018QH2012).
Liu S, Lin Z, Zheng Z, et al. Serum exosomal microRNA‐766‐3p expression is associated with poor prognosis of esophageal squamous cell carcinoma. Cancer Sci. 2020;111:3881–3892. 10.1111/cas.14550
Shuang Liu, Zheng Lin, and Zerong Zheng contributed to the work equally.
Funding information
National Key R&D Program of China, (Grant/ Award Number: '2017YFC0907100') Startup Fund for scientific research, Fujian Medical University, (Grant/ Award Number: '2018QH2012') Medical Innovation project of Fujian Province, (Grant/ Award Number: '2018‐CX‐38').
DATA AVAILABILITY STATEMENT
Beginning 9 months and ending 36 months following article publication.
REFERENCES
- 1. Bray F, Ferlay J, Soerjomataram I, et al. Global cancer statistics 2018: GLOBOCAN estimates of incidence and mortality worldwide for 36 cancers in 185 countries. CA Cancer J Clin. 2018;68:394‐424. [DOI] [PubMed] [Google Scholar]
- 2. Chen W, Zheng R, Zhang S, et al. Cancer incidence and mortality in China in 2013: an analysis based on urbanization level. Chin J Cancer Res. 2017;29:1‐10. [DOI] [PMC free article] [PubMed] [Google Scholar]
- 3. Arnold M, Soerjomataram I, Ferlay J, Forman D. Global incidence of oesophageal cancer by histological subtype in 2012. Gut. 2015;64:381‐387. [DOI] [PubMed] [Google Scholar]
- 4. Zheng Y, Fu S, He T, Yan Q, Di W, Wang J. Predicting prognosis in resected esophageal squamous cell carcinoma using a clinical nomogram and recursive partitioning analysis. Eur J Surg Oncol. 2018;44:1199‐1204. [DOI] [PubMed] [Google Scholar]
- 5. Murphy G, McCormack V, Abedi‐Ardekani B, et al. International cancer seminars: a focus on esophageal squamous cell carcinoma. Ann Oncol. 2017;28:2086‐2093. [DOI] [PMC free article] [PubMed] [Google Scholar]
- 6. Rice TW, Apperson‐Hansen C, DiPaola LM, et al. Worldwide Esophageal Cancer Collaboration: clinical staging data. Dis Esophagus. 2016;29:707‐714. [DOI] [PMC free article] [PubMed] [Google Scholar]
- 7. Akutsu Y, Uesato M, Shuto K, et al. The overall prevalence of metastasis in T1 esophageal squamous cell carcinoma: a retrospective analysis of 295 patients. Ann Surg. 2013;257:1032‐1038. [DOI] [PubMed] [Google Scholar]
- 8. Liu H, Lei C, He Q, Pan Z, Xiao D, Tao Y. Nuclear functions of mammalian MicroRNAs in gene regulation, immunity and cancer. Mol Cancer. 2018;17:64‐77. [DOI] [PMC free article] [PubMed] [Google Scholar]
- 9. Dufresne A, Paturel M, Alberti L, et al. Prediction of desmoid tumor progression using miRNA expression profiling. Cancer Sci. 2015;106:650‐655. [DOI] [PMC free article] [PubMed] [Google Scholar]
- 10. Syed SN, Brüne B. MicroRNAs as emerging regulators of signaling in the tumor microenvironment. Cancers. 2020;12(4):1‐18. [DOI] [PMC free article] [PubMed] [Google Scholar]
- 11. Gao D, Jiang L. Exosomes in cancer therapy: a novel experimental strategy. Am J Cancer Res. 2018;8:2165‐2175. [PMC free article] [PubMed] [Google Scholar]
- 12. Rajagopal C, Harikumar KB. The Origin and Functions of Exosomes in Cancer. Front Oncol. 2018;8:66‐78. [DOI] [PMC free article] [PubMed] [Google Scholar]
- 13. Liu J, Jiang J, Hui X, Wang W, Fang D, Ding L. Mir‐758‐5p suppresses glioblastoma proliferation, migration and invasion by targeting ZBTB20. Cell Physiol Biochem. 2018;48:2074‐2083. [DOI] [PubMed] [Google Scholar]
- 14. Liu X‐L, Pan Q, Cao H‐X, et al. Lipotoxic hepatocyte‐derived exosomal microRNA 192–5p activates macrophages through rictor/akt/forkhead box transcription factor O1 signaling in nonalcoholic fatty liver disease. Hepatology. 2019;1–39. [DOI] [PMC free article] [PubMed] [Google Scholar]
- 15. Bjørnetrø T, Redalen KR, Meltzer S, et al. An experimental strategy unveiling exosomal microRNAs 486–5p, 181a–5p and 30d–5p from hypoxic tumour cells as circulating indicators of high‐risk rectal cancer. J Extracell Vesicles. 2019;8:1567219‐1567231. [DOI] [PMC free article] [PubMed] [Google Scholar]
- 16. Yang C, Ma X, Guan G, et al. MicroRNA‐766 promotes cancer progression by targeting NR3C2 in hepatocellular carcinoma. FASEB J. 2019;33:1456‐1467. [DOI] [PubMed] [Google Scholar]
- 17. Li Y‐C, Li C‐F, Chen L‐B, et al. MicroRNA‐766 targeting regulation of SOX6 expression promoted cell proliferation of human colorectal cancer. Onco Targets Ther. 2015;8:2981‐2988. [DOI] [PMC free article] [PubMed] [Google Scholar]
- 18. Gu Z‐D, Shen L‐Y, Wang H, et al. HOXA13 promotes cancer cell growth and predicts poor survival of patients with esophageal squamous cell carcinoma. Cancer Res. 2009;69:4969‐4973. [DOI] [PubMed] [Google Scholar]
- 19. Afgar A, Fard‐Esfahani P, Mehrtash A, et al. MiR‐339 and especially miR‐766 reactivate the expression of tumor suppressor genes in colorectal cancer cell lines through DNA methyltransferase 3B gene inhibition. Cancer Biol Ther. 2016;17:1126‐1138. [DOI] [PMC free article] [PubMed] [Google Scholar]
- 20. Zeng Z, Li Y, Pan Y, et al. Cancer‐derived exosomal miR‐25‐3p promotes pre‐metastatic niche formation by inducing vascular permeability and angiogenesis. Nat Commun. 2018;9:5395‐5407. [DOI] [PMC free article] [PubMed] [Google Scholar]
- 21. Fang J‐H, Zhang Z‐J, Shang L‐R, et al. Hepatoma cell‐secreted exosomal microRNA‐103 increases vascular permeability and promotes metastasis by targeting junction proteins. Hepatology. 2018;68:1459‐1475. [DOI] [PubMed] [Google Scholar]
- 22. Lawson C, Vicencio JM, Yellon DM, Davidson SM. Microvesicles and exosomes: new players in metabolic and cardiovascular disease. J Endocrinol. 2016;228:57‐71. [DOI] [PubMed] [Google Scholar]
- 23. Taylor DD, Gercel‐Taylor C. MicroRNA signatures of tumor‐derived exosomes as diagnostic biomarkers of ovarian cancer. Gynecol Oncol. 2008;110:13‐21. [DOI] [PubMed] [Google Scholar]
- 24. Bhagirath D, Yang TL, Bucay N, et al. microRNA‐1246 Is an Exosomal Biomarker for Aggressive Prostate Cancer. Cancer Res. 2018;78:1833‐1844. [DOI] [PMC free article] [PubMed] [Google Scholar]
- 25. Yan S, Liu G, Jin C, et al. MicroRNA‐6869‐5p acts as a tumor suppressor via targeting TLR4/NF‐κB signaling pathway in colorectal cancer. J Cell Physiol. 2018;233:6660‐6668. [DOI] [PubMed] [Google Scholar]
- 26. Zhang K, Kong X, Feng G, et al. Investigation of hypoxia networks in ovarian cancer via bioinformatics analysis. J Ovarian Res. 2018;11:16‐26. [DOI] [PMC free article] [PubMed] [Google Scholar]
- 27. Yu D, Li Y, Ming Z, et al. Comprehensive circular RNA expression profile in radiation‐treated HeLa cells and analysis of radioresistance‐related circRNAs. PeerJ. 2018;6:e5011‐e5025. [DOI] [PMC free article] [PubMed] [Google Scholar]
- 28. Wu K, Yi Y, Liu F, et al. Identification of key pathways and genes in the progression of cervical cancer using bioinformatics analysis. Oncol Lett. 2018;16:1003‐1009. [DOI] [PMC free article] [PubMed] [Google Scholar]
- 29. Mellman I, Yarden Y. Endocytosis and cancer. Cold Spring Harb Perspect Biol. 2013;5:a016949‐a016972. [DOI] [PMC free article] [PubMed] [Google Scholar]
- 30. Shibuya N, Kakeji Y, Shimono Y. miR‐93 targets WASF3 and functions as a metastasis suppressor in breast cancer. Cancer Sci. 2020;00:2093‐2103. [DOI] [PMC free article] [PubMed] [Google Scholar]
- 31. Liu D‐L, Lu L‐L, Dong L‐L, et al. miR‐17‐5p and miR‐20a‐5p suppress postoperative metastasis of hepatocellular carcinoma via blocking HGF/ERBB3‐NF‐κB positive feedback loop. Theranostics. 2020;10:3668‐3683. [DOI] [PMC free article] [PubMed] [Google Scholar]
- 32. Stavast CJ, Erkeland SJ. The non‐canonical aspects of microRNAs: many roads to gene regulation. Cells. 2019;8:1465‐1484. [DOI] [PMC free article] [PubMed] [Google Scholar]
- 33. Shen L‐Y, Chen K‐N. Exploration of target genes of HOXA13 in esophageal squamous cell carcinoma cell line. Cancer Lett. 2011;312:18‐23. [DOI] [PubMed] [Google Scholar]
Associated Data
This section collects any data citations, data availability statements, or supplementary materials included in this article.
Supplementary Materials
Figure S1
Figure S2
Figure S3
Figure S4
Figure S5
Table S1‐S6
Data Availability Statement
Beginning 9 months and ending 36 months following article publication.