Abstract
Aerobic glycolysis metabolic reprogramming is one of the most important hallmarks of malignant tumors. Increasing evidence indicates that long non‐coding RNAs (lncRNAs) are able to regulate glycolysis metabolic reprogramming and promote cancer progression by functioning as competing endogenous RNAs. lncARSR is a newly identified onco‐lncRNA in renal cancer, but its potential role in metastatic colorectal cancer (CRC) remains unclear. Here, we analyzed specimens from 89 patients with CRC and demonstrated that lncARSR was highly expressed in CRC tissues and negatively associated with survival. Positron emission tomography‐computed tomography imaging with fluoro‐2‐d‐deoxyglucose F18 to evaluate glucose uptake showed that lncARSR expression was positively correlated with maximum standardized uptake values. Functionally, ectopic expression of lncARSR promoted the invasion, metastasis, and glycolysis metabolic reprogramming of CRC cells in vitro and in vivo, while these activities were inhibited by silencing lncARSR expression. Molecularly, lncARSR sponged miR‐34a‐5p and further mediated hexokinase 1 (HK1)‐related aerobic glycolysis in vitro and in vivo. Clinically, high lncARSR and HK1 expression predicted poor survival of patients with CRC, especially when combined with low miR‐34a‐5p expression. Collectively, we identified lncARSR as an onco‐lncRNA in CRC and demonstrated that the combination of lncARSR/miR‐34a‐5p/HK1 may be a potential prognostic biomarker of CRC.
Keywords: biomarkers, colorectal neoplasms, glycolysis, long non‐coding RNA, prognosis
Here, we demonstrated that lncARSR was high expression in CRC tissues and negatively associated with survival. lncARSR as a onco‐lncRNA, combination of lncARSR/miR‐34a‐5p/HK1 may be a potential prognostic biomarker of CRC.
1. INTRODUCTION
Colorectal cancer (CRC) is the third most common type of cancer and the second leading cause of cancer‐related death around the word. 1 Although advances have been made over the past several decades in the treatment of patients with CRC, the 5‐y survival rate remains at 50%‐55%. While metastatic CRC (mCRC) occurs in only 11.7% of patients with CRC, mortality results mainly in patients with tumor metastasis. 2 Tumor metastasis is a complex process involving multiple gene interactions. The lack of effective biomarkers to predict metastasis and guide diagnosis and therapy is one of the primary causes of poor prognosis. Accordingly, there is a need for identifying novel metastasis‐associated biomarkers and clarifying their mechanisms to improve the prognosis of patients with CRC.
It is widely known that metabolic reprogramming is an important hallmark of malignant tumors and that it can regulate the metastatic microenvironment of tumor cells. 3 During the development of CRC and other solid cancers, the rapid growth of tumor cells may lead to an inadequate supply of oxygen. The inadequate oxygen drives cancer cells to adjust to hypoxic stress and undergo metabolic reprogramming by changing from oxidative glucose metabolism to glycolysis to supply sufficient energy and materials for cell growth. 4 Therefore, exploration of the mechanisms involved and the inhibition of this process would be helpful for advancing tumor therapy.
Long non‐coding RNAs (lncRNAs) are RNAs longer than 200 nucleotides without protein‐coding functions. Increasing evidence has demonstrated that lncRNAs are involved in glycolysis metabolic reprogramming, which may result in chemoresistance and distant metastasis of cancer cells. For instance, exosome‐packaged hypoxia‐inducible factor 1‐alpha (HIF‐1α)‐stabilizing lncRNA from tumor‐associated macrophages promotes aerobic glycolysis and chemoresistance in breast cancer cells. 5 In hepatocellular carcinoma, lncRNA metastasis‐associated lung adenocarcinoma transcript 1 (MALAT1) contributes to tumor progression and the preprogramming of tumor glucose metabolism by acting as competing endogenous RNA (ceRNA). 6 In gallbladder cancer, lncRNA plasmacytoma variant translocation 1 (PVT1) is able to modulate hexokinase 2 (HK2) expression, resulting in glucose metabolism and tumor metastasis. 7 Meanwhile, some lncRNAs have been shown to promote aerobic glycolysis and tumor development in CRC. 8 , 9 The newly identified lncARSR (ENST00000424980) is an exosome‐transmitted lncRNA that can facilitate AXL and c‐MET expression, resulting in sunitinib resistance in renal cancer cells. 10 Moreover, the feed‐forward loop between lncARSR and yes‐associated protein (YAP) activity results in the expansion and metastasis of renal tumor‐initiating cells. 11 However, the function of lncARSR in CRC is currently unknown.
In this study, we showed that: (a) lncARSR was highly expressed in CRC tissues, especially in stage III‐IV CRC tissues; (b) high lncARSR expression predicted poor survival in patients with CRC; (c) lncARSR could sponge miR‐34a‐5p to promote CRC invasion and metastasis by enhancing hexokinase 1 (HK1)‐regulated glucose metabolism; and (d) lncARSR/miR‐34a‐5p‐regulated HK1 overexpression was predictive of poor survival for patients with CRC. Overall, the current data clarified the role of the lncARSR/miR‐34a‐5p/HK1 axis in promoting aerobic glucose metabolism and metastasis in CRC and thereby might prove to be novel prognostic factors for mCRC.
2. MATERIALS AND METHODS
2.1. Patient samples
In total, 89 patients with CRC were enrolled in the study. All of the participants were diagnosed pathologically and treated at the Second Hospital of Shandong University between January 2014 and December 2015. None of the patients received any preoperative anti‐cancer treatment. Patients with advanced‐stage disease received standard postoperative 5‐fluorouracil‐based chemotherapy. The research was approved by the Ethics Committee of the Second Hospital of Shandong University and conformed to the provisions of the Declaration of Helsinki.
2.2. Cell culture, plasmid transfection, and RNA interference
The 6 human CRC cell lines SW480, SW620, HCT‐8, HT‐29, Caco2, and RKO and the normal colon epithelial cell line NCM 460 used in the study were each purchased from the American Type Culture Collection (ATCC). All cells were cultured in DMEM supplemented with 10% fetal bovine serum (FBS, Gibco) and incubated at 37°C with 5% CO2. All cell lines were authenticated through short tandem repeat analysis and used within 6 mo.
lncARSR‐overexpressing and knockdown plasmids were constructed by GenPharma. The mimics and inhibitor of miR‐34a‐5p were purchased from RiBoBio. Transfection assays were performed using Lipofectamine 3000 (Invitrogen) in accordance with the manufacturer’s instructions. Puromycin was used to induce stable overexpression and knockdown of lncARSR in CRC cells. All of these plasmids were in agreement with previous reports. 10 , 11
2.3. RNA extraction and quantitative PCR
TRIzol reagent (Invitrogen) was used to extract cell total RNA. Then reverse transcription was performed with the PrimeScript RT reagent kit (TaKaRa, Dalian, China). Real‐time quantitative PCR was performed using SYBR Premix Ex Taq II (TaKaRa). U6 or GAPDH was applied for internal control.
2.4. Protein extraction and western blot
RIPA buffer was used to extract whole cell lysates. Then cell lysates were separated using sodium dodecyl sulfate (SDS)‐polyacrylamide gel electrophoresis (PAGE) and transferred to PVDF membranes. The protein on the membranes was incubated in primary antibody (HK1, 1:1000; Abcam). After incubation with secondary antibody the membranes were detected by chemiluminescence system.
2.5. Cell migration and invasion assay
Cell migration or invasion assays were performed using Transwell chambers (with inserts of 8‐mm pore size) uncoated or coated with Matrigel, respectively. 1 × 10⁵ CRC cells were seeded in the upper chamber with FBS‐free culture medium. Culture medium with 20% FBS was added in the bottom chambers. After incubation for 24 h, cells were fixed with paraformaldehyde and stained with crystal violet.
2.6. RNA immunoprecipitation (RIP) assay
Cell overexpression or knockdown of lncARSR were used to perform RIP assay with AGO2 antibody in accordance with the instructions of Magna RIP™ Kit (Millipore). Enrichment levels of lncARSR and HK1 were measured with qPCR assay.
MS2bp‐green fluorescent protein (GFP) and MS2, MS2‐lncARSR, or MS2‐lncARSR mut were co‐transfected into CRC cells. RIP assay was performed with the RIP Assay Kit (Millipore) in accordance with the instructions. The cell lysates were incubated with anti‐GFP and IgG. Enrichment levels of miR‐34a‐5p were measured with qPCR assay.
2.7. Luciferase reporter assay
The 3′UTR of HK1 or lncARSR containing miR‐34a‐5p putative binding sites were amplified and cloned into pGL3 vector. QuikChange Site‐Directed Mutagenesis kit (Stratagene) was applied to mutate miR‐34‐5p binding site on the 3′UTR of HK1. miR‐34a‐5p mimics or inhibitor and the wild‐type or mutant type luciferase vectors were co‐transfected into CRC cells. This assay was conducted with the dual‐luciferase reporter gene assay system (Promega). Luciferase activity was measured and normalized to Renilla luciferase activity.
2.8. Measurement of glucose uptake, lactate production, and ATP production
Cell lysates were collected and intracellular glucose was measured with a glucose assay kit (BioVision, #K606‐100) in accordance with the instructions. Extracellular lactate was measured in the cell culture medium using a lactate assay kit (BioVision, #K607‐100). The cellular ATP levels in CRC cells were detected with a CellTiter‐Glo Assay kit (Promega) and luminometer (Promega). The relative ATP levels were normalized to the concentration of cell lysate protein.
2.9. In vivo metastatic experiments
To explore the impact of lncARSR on liver metastasis of CRC in vivo, 200 µL of 1 × 10⁶ cells/mL of lncARSR‐overexpressing CRC cells, lncARSR‐knockdown CRC cells, and control group cells were injected into the spleens of male BALB/c nude mice for 4 wk (n = 5 mice/group). All mice were sacrificed after 9 wk, and tumor metastases in the livers were evaluated and the number of metastatic foci counted using hematoxylin‐eosin (HE) staining and light microscopy. The average number of tumor metastases formed in the livers of each group were then compared. All the animals received humane care in accordance with the criteria outlined in the Guide for the Care and Use of Laboratory Animals prepared by the National Academy of Sciences and the animal assays were approved by the Institutional Animal Care and Use Committee of Second Hospital of Shandong University.
2.10. Statistical analysis
Data analysis in this study was performed using SPSS 21.0 statistical software (SPSS Inc). Kaplan‐Meier with log‐rank tests were performed to analyze disease‐free survival (DFS) and overall survival (OS). Continuous variables in 2 groups or multiple groups were compared using Student t test or one‐way ANOVA, respectively. Fisher exact test or chi‐square test was used to analyze the differences in categorical variables. Pearson rank correlation test was applied to correlation analysis. All in vitro assays were conducted for 3 biological and technical replicates. All data with error bars are shown as the mean ± standard deviation (SD). P < .05 indicates statistical significance.
3. RESULTS
3.1. High lncARSR expression in patients with CRC positively correlated with tumor progression and high metabolism and was predictive of poor survival
To identify the roles of lncARSR in CRC, we measured lncARSR levels by RT‐PCR in 89 pairs of CRC and normal tissue specimens obtained from the Second Hospital of Shandong University. We found that lncARSR expression was significantly higher in tumors compared with that in paired normal tissues (Figure 1A). Of the 89 CRC cases enrolled in the study, 52 patients were diagnosed as stage I or II with the other 37 diagnosed as stage III or IV based on the American Joint Committee on Cancer (AJCC) staging. Among the 89 patients, 44 experienced tumor recurrence within 5 y while 45 had no recurrence. Subsequent analysis revealed that lncARSR expression was higher in the stage III‐IV and relapse groups compared to that in the stage I‐II and non‐relapse groups, respectively (Figure 1B,C). To further understand the clinical significance of lncARSR expression, we also analyzed the relationships between clinical pathological parameters and lncARSR levels in the 89 patients with CRC. We found that lncARSR expression was positively correlated with lymph node metastasis, distant metastasis, and AJCC stage (P < .05 for all; Table 1); however there were no significant correlations with other clinical features. Moreover, positron emission tomography‐computed tomography (PET/CT) imaging using fluoro‐2‐d‐deoxyglucose F18 [(18F)‐FDG] to visualize glucose uptake in 39 of the 89 patients with CRC showed maximum standardized uptake (SUVmax) values in the high‐expressing lncARSR group were obviously higher compared with those in the low‐expressing lncARSR group (Figure 1D,E). These results indicated that high lncARSR expression may promote tumor recurrence and metastasis in patients with CRC via regulation of tumor‐cell metabolism.
FIGURE 1.
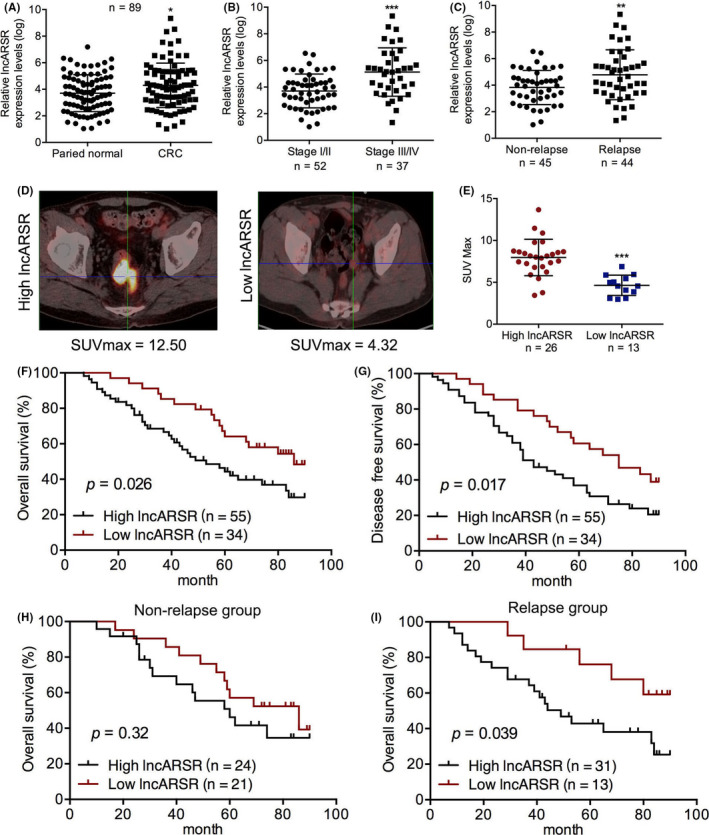
High expression of lncARSR positively correlates with tumor progression and high metabolism level and predicts poor survival for patients with colorectal cancer (CRC). A, qPCR analyses of lncARSR expression in tumor specimens from 89 patients with CRC and paired normal tissues. B, Levels of lncARSR expression in stage I‐II and stage III‐IV CRC tissues. C, Levels of lncARSR expression in tumor specimens of relapse and non‐relapse groups of patients with CRC. D, Representative 18F‐FDG PET/CT imaging of CRC patients with high and low lncARSR expression. E. Analysis of maximum standardized uptake (SUVmax) in patients with high and low lncARSR expression (n = 39; P < .001). F, G, Overall survival (OS) and disease‐free survival (DFS) of 89 patients with CRC was analyzed in accordance with lncARSR expression using Kaplan‐Meier analysis and a log‐rank test. H, I, OS in non‐relapse and relapse groups of patients with CRC were analyzed with Kaplan‐Meier analysis and a log‐rank test. *P < .05; **P < .01; ***P < .001
TABLE 1.
Correlations between lncARSR expression and clinical features in 89 CRC patients
| Characteristics | No. of patients (%) | lncARSR expression | P‐value* | |
|---|---|---|---|---|
| Low n = 34 (%) | High n = 55 (%) | |||
| Age | ||||
| <65 | 42 (47.2) | 15 (44.1) | 27 (49.1) | .669 |
| ≥65 | 47 (52.7) | 19 (55.9) | 28 (50.9) | |
| Gender | ||||
| Female | 41 (46.1) | 16 (47.1) | 25 (45.5) | .883 |
| Male | 48 (53.9) | 18 (52.9) | 30 (54.5) | |
| Location | ||||
| Left | 50 (56.2) | 17 (50) | 33 (60.0) | .386 |
| Right | 39 (43.8) | 17 (50) | 22 (40.0) | |
| pT stage | ||||
| T1 | 3 (3.4) | 2 (5.9) | 1 (1.8) | .563 |
| T2 | 19 (21.3) | 8 (23.5) | 11 (20.0) | |
| T3 | 40 (44.9) | 16 (47.1) | 24 (43.6) | |
| T4 | 27 (30.3) | 8 (23.5) | 19 (34.5) | |
| Lymph node metastasis | ||||
| N0 | 52 (58.4) | 30 (88.2) | 22 (40.0) | .001* |
| N1 | 27 (30.3) | 2 (5.9) | 25 (45.5) | |
| N2 | 10 (11.2) | 2 (5.9) | 8 (14.5) | |
| Distant metastasis | ||||
| M0 | 82 (92.1) | 34 (100) | 48 (87.3) | .029* |
| M1 | 7 (7.9) | 0 (0) | 7 (12.7) | |
| AJCC stage | ||||
| I | 15 (16.9) | 9 (26.5) | 6 (10.9) | .037* |
| II | 37 (41.6) | 17 (50) | 20 (36.4) | |
| III | 30 (33.7) | 7 (20.6) | 23 (41.8) | |
| IV | 7 (7.9) | 1 (2.9) | 6 (10.9) | |
| Differentiation | ||||
| Well | 20 (22.5) | 11 (32.4) | 9 (216.4) | .211 |
| Moderate | 38 (42.7) | 13 (38.2) | 25 (44.4) | |
| Poor | 31 (34.8) | 10 (29.4) | 21 (38.2) | |
P < .05 significant difference.
We also evaluated the prognostic roles of lncARSR on OS and DFS using Kaplan‐Meier analysis with the log‐rank test. We found that high lncARSR levels were predictive of worse OS and DFS compared with that of low lncARSR levels in the 89 CRC patients enrolled in the study (Figure 1F,G). Interestingly, high lncARSR expression was predictive of poor OS in only the tumor relapse group and not in the non‐relapse group (Figure 1H,I). Moreover, univariate and multivariate analyses of OS and DFS further revealed that lncARSR was an independent prognostic factor (Tables 2 and 3). Therefore, our results revealed that high lncARSR levels were not only associated with tumor recurrence and metastasis, but were also predictive of poor prognosis in patients with CRC.
TABLE 2.
Univariate and multivariate analysis of disease‐free survival in 89 CRC patients
| Univariate analysis | Multivariate analysis | |||
|---|---|---|---|---|
| HR (95% CI) | P‐value | HR (95% CI) | P‐value | |
| Age (yr) | 0.904 (0.311‐2.610) | .471 | ||
| Gender | 1.301 (0.732‐2.324) | .617 | ||
| Tumor location | 0.468 (0.521‐1.148) | .543 | ||
| T classification | 2.313 (1.475‐4.832) | .004* | 1.389 (1.323‐3.410) | .031* |
| N classification | 2.453 (1.512‐3.022) | <.001* | 0.315 (0. 710‐1.314) | .338 |
| M classification | 8.216 (3.474‐11.307) | <.001* | 6.732 (3.391‐10.137) | <.001* |
| AJCC stage (III‐IV vs I‐II) | 3.766 (2.535‐12.786) | <.001* | 3.208 (1.269‐9.472) | .012* |
| Differentiation | 0.724 (0.434‐1.734) | .465 | ||
| Recurrence | 6.013 (3.138‐12.325) | <.001* | 4.215 (1.823‐13.105) | <.001* |
| lncARSR | 4.736 (1.079‐8.018) | <.001* | 2.484 (1.132‐6.232) | .028* |
Abbreviations: CI, confidence interval; HR, hazard ratio.
P < .05 indicate that the 95% CI of HR was not including 1.
TABLE 3.
Univariate and multivariate analysis of overall survival in 89 CRC patients
| Univariate analysis | Multivariate analysis | |||
|---|---|---|---|---|
| HR (95% CI) | P‐value | HR (95% CI) | P‐value | |
| Age (yr) | 1.07 (0.726‐1.818) | .623 | ||
| Gender | 0.921 (0.693‐1.632) | .534 | ||
| Tumor location | 1.026 (0.902‐1.307) | .321 | ||
| T classification | 2.230 (1.655‐5.030) | <.001* | 1.601 (0.972‐2.401) | .060 |
| N classification | 2.363 (1.593‐3.126) | <.001* | 1.253 (0.439‐1.814) | .307 |
| M classification | 9.753 (6.793‐15.773) | <.001* | 7.309 (3.894‐11.378) | <.001* |
| AJCC stage (III‐IV vs I‐II) | 6.126 (3.225‐13.608) | <.001* | 2.363 (1.075‐8.021) | .034* |
| Differentiation | 0.872 (0.545‐1.624) | .184 | ||
| Recurrence | 2.343 (1.625‐5.203) | <.001* | 2.674 (1.589‐4.079) | <.001* |
| lncARSR | 5.435 (3.374‐10.687) | <.001* | 3.250 (1.596‐6.716) | .001* |
Abbreviations: CI, confidence interval; HR, hazard ratio.
P < .05 indicates that the 95% CI of HR was not including 1.
3.2. High lncARSR levels promoted CRC cell migration, invasion, and glucose metabolism in vitro
To explore the specific roles of lncARSR in promoting the progression of CRC in vitro, we measured lncARSR expression in 6 CRC cell lines and 1 normal colon epithelial cell line using RT‐PCR. This analysis revealed that CRC cells expressed high levels of lncARSR compared with that of normal colon epithelial cells (Figure 2A). Next, we selected Caco‐2 and HT‐29 cells, which had the lowest lncARSR levels, and HCT‐8 and SW620 cells, which had the highest lncARSR levels, for evaluation using the following functional assays. We constructed Caco‐2 and HT‐29 cells that stably overexpressed lncARSR, and HCT‐8 and SW620 cells with lncARSR being stably knocked down by shRNAs (Figures 2B,C and 3A,B). Among the 2 shRNA sequences used, only sh‐lncARSR‐1 significantly downregulated lncARSR expression. Subsequent functional assays were conducted using sh‐lncARSR‐1 (Figures 2C and 3B). Transwell assays showed that overexpression of lncARSR increased the number of migrating and invasive Caco‐2 and HT‐29 cells, while knocking down lncARSR reduced the number of migrating and invasive HCT‐8 and SW620 cells compared with that of their respective negative controls (Figures 2D,E and 3C,D). We then analyzed whether lncARSR‐regulated glucose metabolism in CRC cells. As shown in Figures 2F,G and 3E,F, cellular glucose uptake significantly increased and lactate levels in the medium decreased upon lncARSR overexpression or downregulation, respectively. We also measured cellular ATP levels in CRC cells and found that ATP levels were upregulated in lncARSR‐overexpressing Caco‐2 and HT‐29 cells compared with those in the control cells. Inversely, ATP levels were downregulated in HCT‐8 and SW620 cells following the knockdown of lncARSR expression (Figures 2H and 3G). Taken together, these data indicated that in vitro lncARSR promoted glycolysis metabolic reprogramming and the invasiveness of CRC cells.
FIGURE 2.
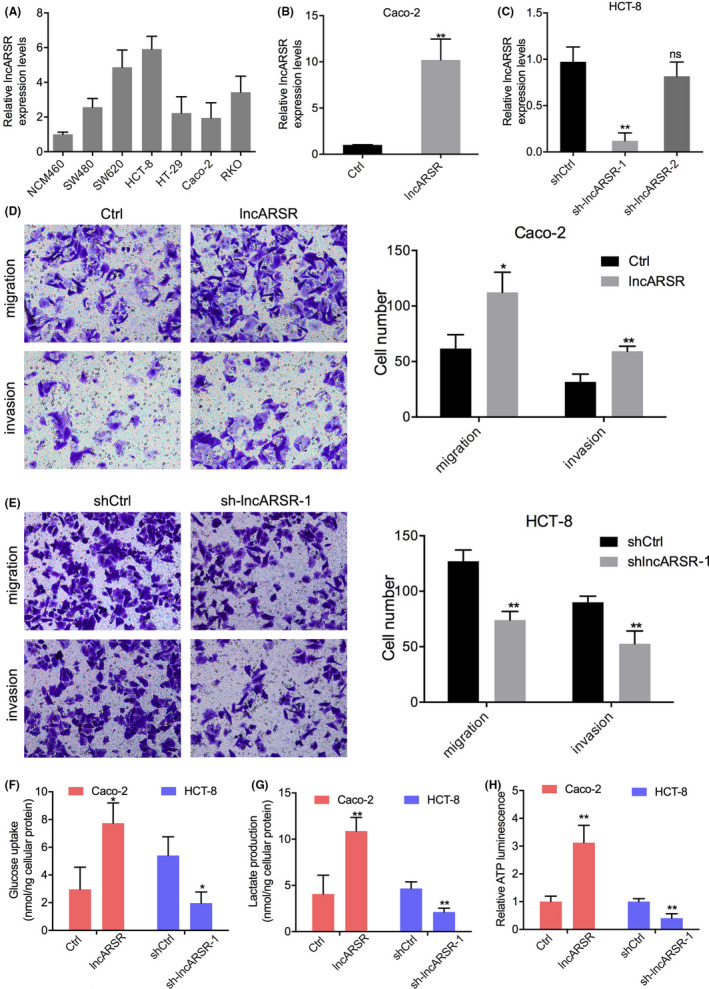
High lncARSR expression promotes colorectal cancer (CRC) cells migration, invasion, and glucose metabolism in vitro. A, Relative expression of lncARSR in 6 CRC cell lines and 1 normal intestinal epithelial cell. B, C, Changes in lncARSR expression in CRC cells transfected with lncARSR overexpression or lncARSR‐knockdown plasmids. D, Effects of lncARSR overexpression on migration and invasive abilities of Caco‐2 cells. E, Effects of lncARSR knockdown on migration and invasive abilities of HCT‐8 cells. F‐H, Changes in glucose uptake (F), lactate production (G), and cellular ATP levels (H) in Caco‐2 cells transfected with lncARSR‐overexpression plasmid or HCT‐8 cells transfected with lncARSR‐knockdown plasmid. *P < .05; **P < .01
FIGURE 3.
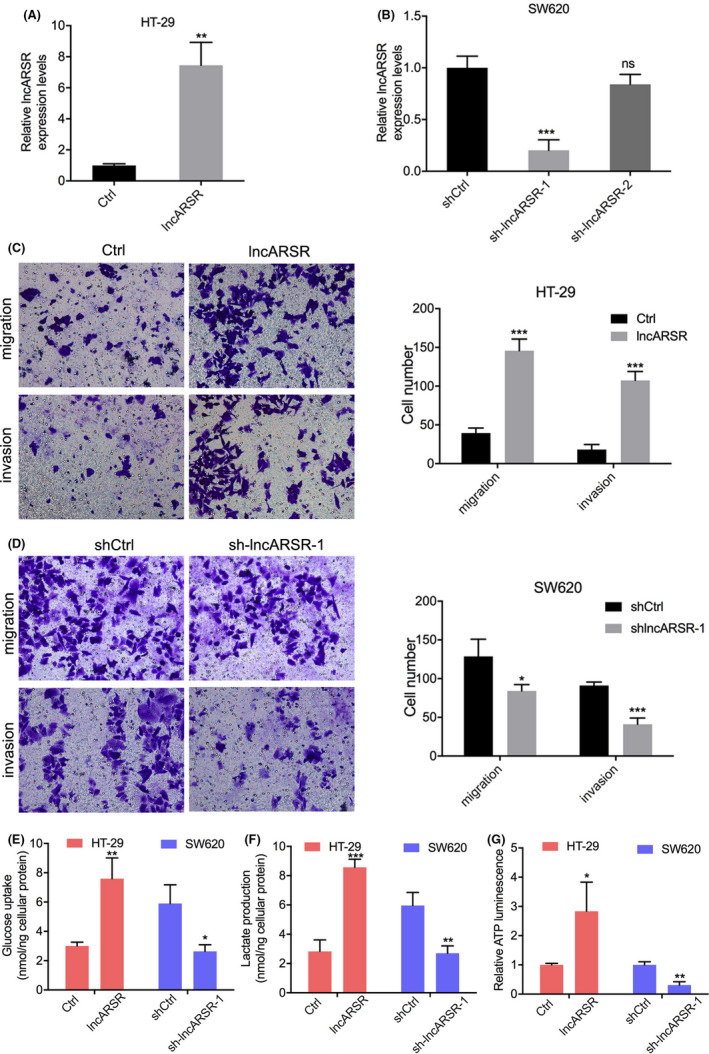
High lncARSR promotes colorectal cancer (CRC) cell migration, invasion, and glucose metabolism in vitro. A, B, Changes of lncARSR expression in CRC cells transfected with lncARSR‐overexpression or lncARSR‐knockdown plasmids. C, Effects of lncARSR overexpression on migration and invasive abilities of HT‐29 cells. D, Effects of lncARSR knockdown on migration and invasive abilities of SW620 cells. E‐G, Changes in glucose uptake (E), lactate production (F), and cellular ATP levels (G) in HT‐29 cells transfected with lncARSR‐overexpression plasmid or SW620 cells transfected with lncARSR‐knockdown plasmid. *P < .05; **P < .01
3.3. High lncARSR expression enhanced liver metastasis of CRC cells in nude mice
It is well known that liver metastasis is the most common metastasis seen in patients with CRC. Therefore, we performed in vivo assays to investigate whether dysregulated lncARSR expression could affect liver metastasis of CRC cells by injecting overexpressing‐lncARSR Caco‐2 cells and lncARSR‐silenced HCT‐8 cells, as well as their respective control cells, into the spleens of nude mice. HE staining was performed and the number of metastatic colonies counted per sight in the surviving mice (Figure 4A). We found that overexpression of lncARSR generated many more metastatic colonies in the livers of mice, while knockdown of lncARSR expression resulted in fewer metastatic colonies compared with that in the livers of their respective control groups (Figure 4B,C). Taken together, these results further demonstrated that high lncARSR expression promoted metastasis of CRC cells in vivo.
FIGURE 4.

High lncARSR promotes liver metastasis of colorectal cancer (CRC) cells in nude mice. A, Representative hematoxylin‐eosin (HE) staining of liver metastasis in nude mice after 4 wk spleen injection of CRC cells. The black arrow indicates the metastatic node and the green arrow points to a normal liver cell (scale bar, 200 μm). B, C, Nude mice were separated into 4 groups (n = 5/group) and injected with lncARSR‐overexpressed Caco‐2 cells, lncARSR‐silenced HCT‐8, or their respective controls. The number of metastatic colonies in HE‐stained images of liver tissue was counted. **P < .01
3.4. lncARSR upregulated HK1 expression by competitively binding miR‐34a‐5p
lncRNAs are able to regulate gene expression by competitively binding to microRNAs (miRNAs), leading to targeted attenuation of degradation by miRNA, which is also known as ceRNA mechanism. 12 It has been reported that lncARSR functions as a ceRNA for miR‐34a‐5p to facilitate AXL and c‐MET expression and thereby promoting sunitinib resistance in renal cancer. 10 To further investigate the mechanism of lncARSR regulation of CRC progression and glucose metabolism, we predicted potential miRNAs targeting HK1 mRNA using the TargetScan database and identified the miR‐302 family, miR‐520 family, miR‐372‐3p, miR‐373‐3p, miR‐138‐5p, miR‐34 family, and miR‐449 family as containing HK1 3′ untranslated region (3ʹUTR) binding sites. We then transfected HCT‐8 cells with mimics of these miRNAs or with control mimics and evaluated HK1 mRNA expression. We found that HK1 mRNA expression was most obviously downregulated in HCT‐8 cells after transfection with miR‐34a‐5p mimics (Figure 5A). Furthermore, among the 4 miRNAs that might regulate HK1 mRNA expression, miR‐34a‐5p was the most significantly increased in HCT‐8 cells after knockdown of lncARSR (Figure 5B). The TargetScan database revealed that the 3ʹUTR of HK1 and lncARSR each contained miR‐34a‐5p binding sites (Figure 6A). Consequently, we focused on miR‐34a‐5p in the subsequent studies. Western blot analysis showed that overexpression of lncARSR significantly promoted HK1 expression, which could be attenuated by the transfection of cells with miR‐34a‐5p mimics. Conversely, knockdown of lncARSR suppressed HK1 expression, which was eliminated by inhibiting miR‐34a‐5p (Figures 6B and 7). These results suggested that lncARSR could regulate HK1 expression via miR‐34a‐5p.
FIGURE 5.
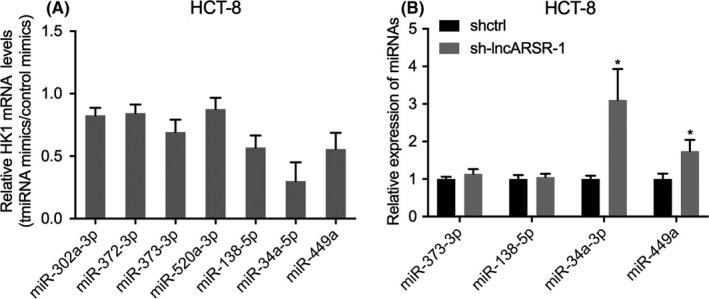
miR‐34a‐5p is regulated by lncARSR. A, The TargetScan database was used to predict potential miRNAs that target hexokinase 1 (HK1) mRNA. qPCR analyses of HK1 mRNA expression in HCT‐8 cells transfected with mimics of the miRNAs or control mimics. B, Changes of miRNA expression levels after knockdown of lncARSR in HCT‐8 cells. *P < .05; ***P < .001
FIGURE 6.
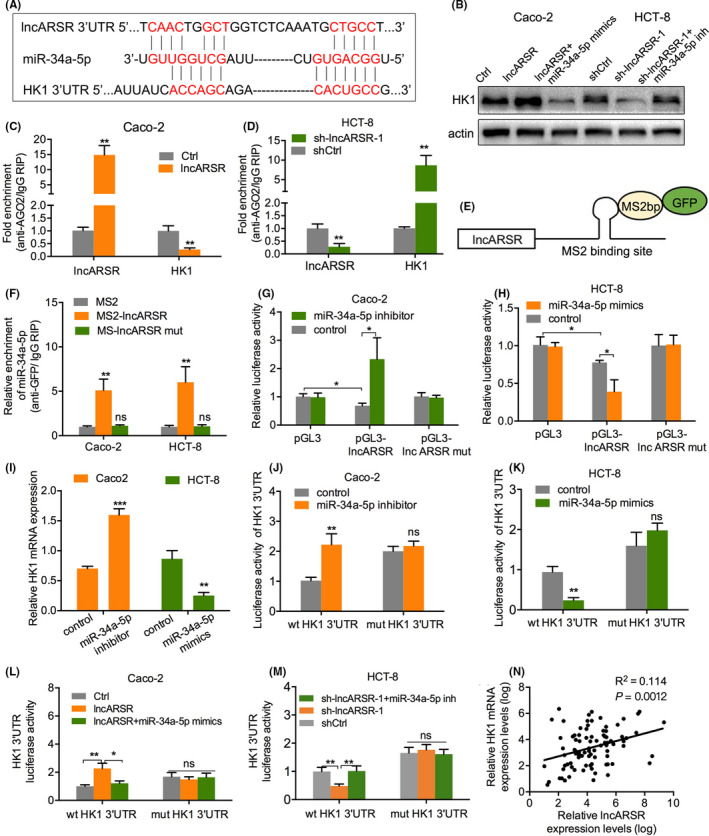
lncARSR upregulates HK1 expression by competitively binding miR‐34a‐5p. A, Bioinformatically predicted paired bases of miR‐34a‐5p in lncARSR and hexokinase 1 (HK1) 3′ untranslated region (3ʹUTR). B, Protein levels of HK1 in Caco‐2 cells transfected with lncARSR or lncARSR + miR‐34a‐5p mimics and HCT‐8 cells transfected with sh‐lncARSR‐1 or sh‐lncARSR‐1 + miR‐34a‐5p inhibitor. C, D, AGO2‐RNA immunoprecipitation (RIP) followed by qPCR analysis to evaluate HK1 levels after lncARSR knockdown or overexpression. E, Schematic images of a construct containing lncARSR combined with the MS2 binding sequence. F, Green fluorescent protein (GFP)‐RIP followed by qPCR analysis to measure miR‐34a‐5p endogenously combined with lncARSR. G, H, Effects of miR‐34a‐5p knockdown or overexpression on luciferase reporter activity with wild‐type and mutant lncARSR. I, Changes in HK1 mRNA after Caco‐2 cells were transfected with lncARSR and HCT‐8 cells were transfected with sh‐lncARSR‐1. J, K, Effects of miR‐34a‐5p knockdown or overexpression on luciferase reporter activity with the wild‐type and mutant HK1 3ʹUTR. L, M, Effects of miR‐34a‐5p knockdown or overexpression on lncARSR‐regulated luciferase reporter activity with wild‐type and mutant HK1 3ʹUTR. N, Pearson correlation analysis of lncARSR and HK1 mRNA expression in tissue specimens from 89 patients with colorectal cancer (CRC). *P < .05, **P < .01, ***P < .001; ns, not significant
FIGURE 7.
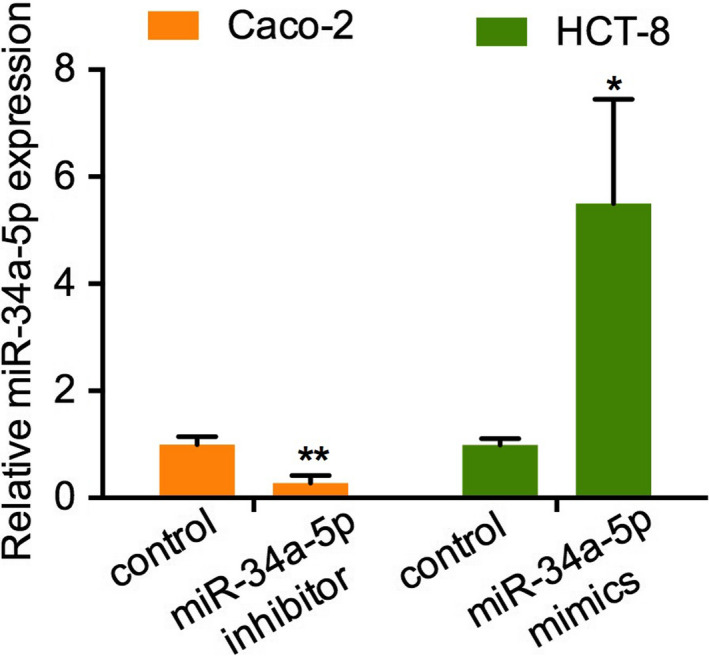
Effects of mimics and inhibitor on miR‐34a‐5p expression. Caco‐2 cells and HCT‐8 cells were transfected with miR‐34a‐4p mimics or inhibitor and qPCR analyses of miR‐34a‐5p expression levels was performed. *P < .05; **P < .01
To determine whether lncARSR could regulate HK1 expression via a ceRNA mechanism, we performed RNA immunoprecipitation (RIP) assays for Argonaute RISC catalytic component 2 (AGO2), which is the core component of the RNA‐induced silencing complex. 13 We found that overexpression of lncARSR decreased HK1 enrichment, while knockdown of lncARSR increased HK1 enrichment (Figure 6C,D). These results suggested that lncARSR could compete with HK1 transcripts for the Ago2‐based miRNA‐induced repression complex.
We subsequently constructed wild‐type and mutant miR‐34a‐5p binding sites in a lncARSR plasmid containing the MS2 binding site (Figure 6E). CRC cells were co‐transfected with the wild‐type or mutant lncARSR plasmid and the MS2 binding protein (MS2bp) bound to the MS2 binding site, as well as GFP. An anti‐GFP RIP assay revealed that miR‐34a‐5p was only enriched with wild‐type lncARSR, while the mutant lncARSR induced no significant enrichment compared with that of the MS2 control (Figure 6F). Moreover, a luciferase reporter gene containing either wild‐type or mutant miR‐34a‐5p binding sites for lncARSR was constructed and co‐transfected into CRC cells along with miR‐34a‐5p mimics, inhibitor, or their negative controls. We found that miR‐34a‐5p inhibitor increased luciferase activity of wild‐type lncARSR, but did not affect luciferase activity of the mutant lncARSR (Figure 6G). Conversely, miR‐34a‐5p mimics decreased luciferase activity of wild‐type lncARSR, but not mutant lncARSR (Figure 6H). These results suggested that miR‐34a‐5p could bind lncARSR in CRC cells.
RT‐PCR analysis verified that knockdown of miR‐34a‐5p upregulated HK1 mRNA expression, while overexpression of miR‐34a‐5p downregulated HK1 mRNA expression (Figure 6I). Additionally, a luciferase reporter gene containing wild‐type or mutant miR‐34a‐5p binding sites on the 3ʹUTR of HK1 were constructed and co‐transfected into CRC cells along with miR‐34a‐5p mimics, inhibitor, or negative controls. Luciferase activity of wild‐type, but not mutant HK1 3ʹUTR, was enhanced by miR‐34a‐5p inhibitor or reduced by miR‐34a‐5p mimics (Figure 6J,K). These results indicated that miR‐34a‐5p could bind to the 3ʹUTR of HK1 mRNA. Moreover, the luciferase activity increased by overexpression of lncARSR could be partially attenuated by miR‐34a‐5p mimics (Figure 6L). In contrast, the luciferase activity decreased by lncARSR knockdown could be partially reversed by miR‐34a‐5p inhibitor (Figure 6M). In addition, we further analyzed the association between lncARSR and HK1 mRNA in tissue specimens of the 89 patients with CRC enrolled in the current study and found that HK1 mRNA expression positively correlated with lncARSR expression (Figure 6N and Table 4). Conversely, miR‐34a‐5p expression negatively correlated with lncARSR expression (Figure 8). Consequently, we verified that lncARSR could positively regulate HK1 expression by competitively binding miR‐34a‐5p.
TABLE 4.
Associations between lncARSR, miR‐34a‐5p and HK1 mRNA expression in 89 CRC patients
| N | lncARSR expression | P‐value | ||
|---|---|---|---|---|
| 89 | Low (n = 34) | High (n = 55) | ||
| miR‐34a‐5p | ||||
| Low | 49 | 10 (29.4%) | 39 (70.9%) | <.001* |
| High | 40 | 24 (70.6%) | 16 (29.1%) | |
| HK1 | ||||
| Negative/Weak | 31 | 21 (61.8%) | 10 (18.2%) | <.001* |
| Strong | 58 | 13 (38.2%) | 45 (81.8%) | |
P < .05 significant difference.
FIGURE 8.
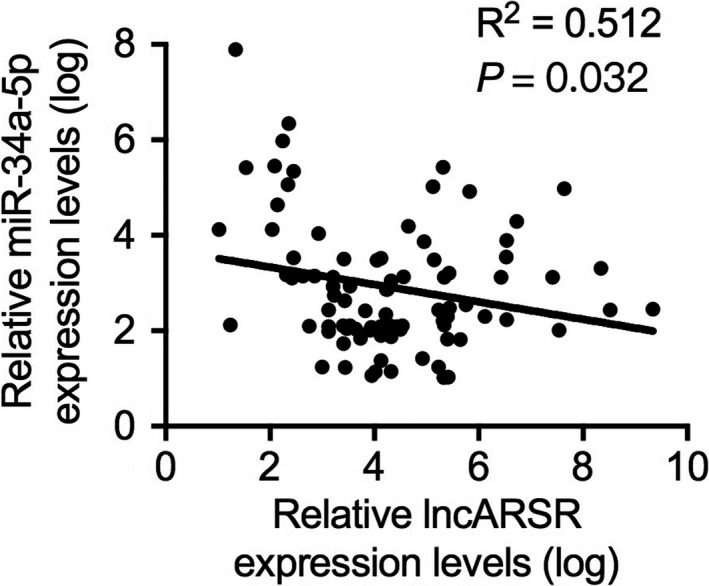
Pearson correlation analysis of lncARSR mRNA and miR‐34a‐5p expression in tissue specimens from 89 patients with colorectal cancer (CRC)
3.5. lncARSR promoted migration, invasion, and glucose metabolism reprogramming in vitro and liver metastasis in vivo by competitively binding miR‐34a‐5p
To demonstrate the ceRNA function of lncARSR on invasion and glucose metabolism reprogramming of CRC cells, we performed rescue assays in vitro and in vivo. Transwell assays showed that miR‐34a‐5p mimics could reduce migration and invasion enhancement caused by lncARSR overexpression in Caco‐2 cells (Figure 9A). In contrast, miR‐34a‐5p inhibitor abrogated the suppression of migration and invasion caused by lncARSR downregulation in HCT‐8 cells (Figure 9B). We then determined whether miR‐34a‐5p affected glucose metabolism in CRC cells. As it shown in Figure 9C,D, miR‐34a‐5p mimics attenuated cellular glucose uptake and reduced lactate levels in the media that were induced by lncARSR upregulation in Caco‐2 cells, while knockdown of miR‐34a‐5p in HCT‐8 cells eliminated the inhibition of glucose uptake and lactate production caused by lncARSR downregulation. In addition, the upregulation and downregulation of ATP levels induced by lncARSR overexpression and knockdown, respectively, was partially reversed by transfection of miR‐34a‐5p mimics or inhibitors (Figure 9E). More importantly, in vivo assays demonstrated that transfecting miR‐34a‐5p mimics or inhibitors lessened the effect of overexpression of lncARSR. This resulted in more metastatic colonies in the mouse liver, as well as reduced the effect of knockdown of lncARSR, resulting in fewer metastatic colonies (Figure 9F,G). These results indicated that lncARSR promoted metastasis and glucose metabolism reprogramming of CRC cells by competing with miR‐34a‐5p.
FIGURE 9.
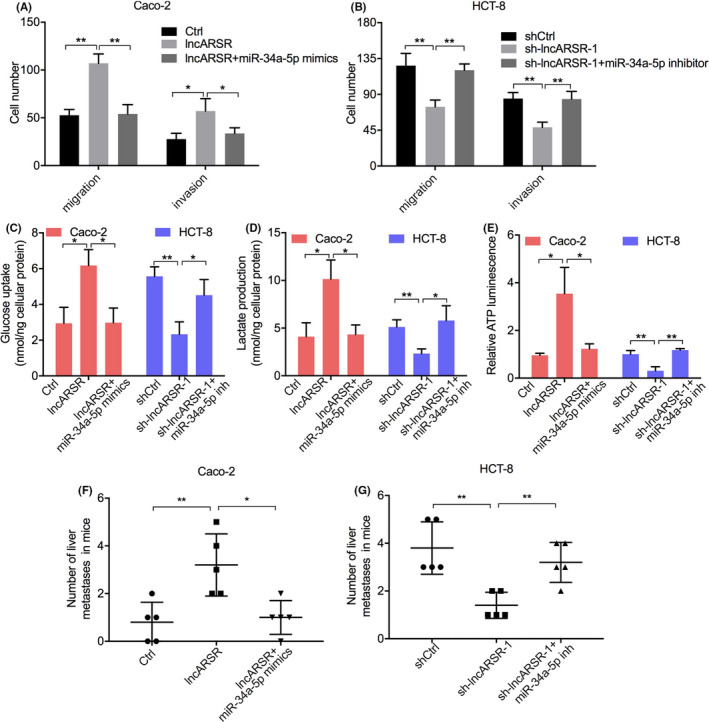
lncARSR promotes colorectal cancer (CRC) cell migration, invasion, and glucose metabolism in vitro and enhanced liver metastasis of nude mice in vivo via competitively binding to miR‐34a‐5p. Caco‐2 cells were transfected with control, lncARSR, or lncARSR + miR‐34a‐5p mimics and HCT‐8 cells were transfected with shCtrl, sh‐lncARSR‐1, or sh‐lncARSR‐1 + miR‐34a‐5p inhibitor. A, B, Transwell assays were used to analyze the migratory and invasive abilities of CRC cells. A series of metabolic parameters was measured, including (C) glucose uptake, (D) lactate production, and (E) cellular ATP levels. *P < .05, **P < .01. F, G, Nude mice were separated into 6 groups (n = 5/group) and injected with the above indicated groups cells via the spleen. The number of metastatic colonies in hematoxylin‐eosin (HE) stained images of liver tissue was counted 4 wk postinjection. *P < .05; **P < .01
3.6. Combined high lncARSR and HK1 levels predicted poor survival of patients with CRC
To further evaluate the prognostic value of lncARSR‐HK1 in predicting CRC patient outcomes, Kaplan‐Meier analysis with a log‐rank test on OS and DFS was performed based on the levels of lncARSR and HK1mRNA. This showed that patients with both high levels of lncARSR and HK1 mRNA correlated with poorer OS and DFS compared with other patients with CRC (Figure 10A,B). In addition, Kaplan‐Meier analysis based on in situ hybridization (ISH) of lncARSR and immunohistochemistry (IHC) of HK1 in CRC cases also revealed that strong staining of lncARSR and HK1 predicted poorer OS and DFS than that of other CRC cases (Figure 10C,D). Taken together, the combination of high lncARSR and high HK1 levels may predict tumor recurrence or metastasis and poor survival in patients with CRC.
FIGURE 10.
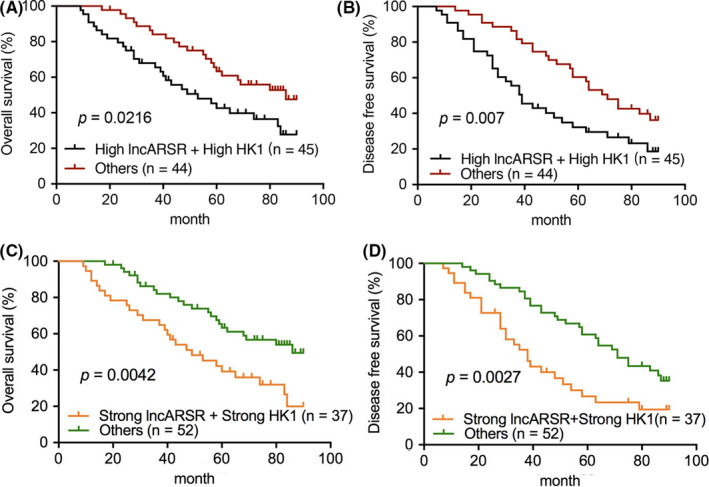
Combination of high lncARSR and high HK1 expression predicts poor survival for patients with colorectal cancer (CRC). A, B, Kaplan‐Meier analysis with a log‐rank test of overall survival (OS) (A) and disease‐free survival (DFS) (B) for 89 patients with CRC based on lncARSR and HK1 mRNA expression levels. C, D, OS (C) and DFS (D) were analyzed based on in situ hybridization (ISH) of lncARSR and immunohistochemistry (IHC) of hexokinase 1 (HK1) using Kaplan‐Meier analysis and a log‐rank test. P < .05 indicates statistical significance
4. DISCUSSION
Aerobic glycolysis metabolic reprogramming, also known as the Warburg effect, is a general feature of glucose metabolism in malignant tumors. 14 , 15 During this process, glucose is primarily processed into lactate, which can be regulated by the tumor microenvironment and is also involved in the formation of a pre‐metastatic niche to facilitate the metastasis of cancer cells. 16 In the current study, we verified that lncARSR could sponge miR‐34a‐5p to facilitate the invasion and metastasis of CRC cells by promoting HK1‐modulated glucose metabolism. More importantly, CRC patients with high levels of lncARSR and HK1 expression and low levels of miR‐34a‐3p expression exhibited a high risk of tumor metastasis. These patients should receive more aggressive postoperative adjuvant treatment.
Although large numbers of studies have revealed roles of epigenetic and genetic alterations in the tumorigenesis and development of CRC, the prognosis for patients remains poor. The poor prognosis is based on many reasons, including CRC cell proliferation, apoptosis, invasion, and metastasis, among others. 17 , 18 , 19 Among these features, metastasis of cancer cells remains the main problem resulting in poor survival of patients with CRC. Identifying biomarkers for predicting tumor metastasis may provide a better strategy for the precise diagnosis and treatment of CRC. In the current study, we revealed that lncARSR acted as a metastasis‐related gene in CRC and high lncARSR levels were predictive of poor survival for patients with CRC, especially for patients with mCRC. Our findings are consistent with other reports that lncARSR acts as an oncogene in renal cancer. 10 , 11 This suggests that lncARSR may play similar roles in other cancers and further highlights the need for exploring the function and specific mechanism of lncARSR in promoting CRC progression.
It is widely known that the high invasion and metastasis abilities of cancer cells can drive disease progression. Aerobic glycolysis is able to rapidly provide energy for the growth of tumor cells and also materials of the pre‐metastatic niche. In the present study, overexpression of lncARSR promoted CRC cell migration, invasion, and aerobic glycolysis in vitro, as well as in vivo liver metastasis in nude mice. Clinically, preoperative PET‐CT indicated that CRC patients with high expression levels of lncARSR in CRC tissues usually had high SUVmax values in primary tumors. These findings demonstrated that lncARSR promoted the process of aerobic glycolysis metabolic reprogramming during the metastasis of CRC cells. Accordingly, our findings may provide insight into a novel biomarker for predicting tumor metastasis, as well as a potential therapeutic target.
Recently, increasing numbers of studies have reported that lncRNAs can act as ceRNA and inhibit the degrading roles of miRNAs on 3ʹUTR of targets and form regulated networks with lncRNA‐miRNA‐mRNA. 20 , 21 Therefore, we also hypothesized that lncARSR might promote metastasis and aerobic glycolysis in CRC via a ceRNA mechanism. Through bioinformatics analyses and luciferase reporter assays, we demonstrated that lncARSR upregulated HK1 expression and promoted invasion and aerobic glycolysis of CRC cells by sponging miR‐34a‐5p. Clinically, lncARSR expression was negatively correlated with miR‐34a‐5p in CRC tissues. These findings revealed the mechanism by which lncARSR promoted CRC progression. However, we selected only miR‐34a‐5p and identified HK1 as the downstream target. Whether there were other mechanisms involved in lncARSR‐associated CRC progression needs more intensive exploration.
In conclusion, our current study identified the significant roles of the lncARSR/miR‐34a‐5p/K1 axis in promoting aerobic glucose metabolism and metastasis in CRC. This study not only provided new insight into the roles of lncARSR in CRC progression, but also showed that the combination of lncARSR/miR‐34a‐5p/HK1 may prove to be a prognostic biomarker for patients with CRC.
CONFLICT OF INTEREST
The authors have no conflict of interest.
AUTHOR CONTRIBUTIONS
Jianqiang Guo led and supervised the whole research and revised the final manuscript. Shuai Li conducted most experiments and wrote draft of the manuscript. Kongxi Zhu conducted some experiments. Huanmin Niu provided technical support. Lan Liu and Jiaoyang Gu analyzed data. All authors have reviewed the draft and approved the final manuscript before submission.
ACKNOWLEDGMENTS
Not applicable.
Li S, Zhu K, Liu L, Gu J, Niu H, Guo J. lncARSR sponges miR‐34a‐5p to promote colorectal cancer invasion and metastasis via hexokinase‐1‐mediated glycolysis. Cancer Sci. 2020;111:3938–3952. 10.1111/cas.14617
REFERENCES
- 1. Siegel RL, Miller KD, Jemal A. Cancer statistics, 2019. CA Cancer J Clin. 2019;69(1):7‐34. [DOI] [PubMed] [Google Scholar]
- 2. Koi M, Garcia M, Choi C, et al. Microsatellite alterations with allelic loss at 9p24.2 signify less‐aggressive colorectal cancer metastasis. Gastroenterology. 2016;150(4):944‐955. [DOI] [PMC free article] [PubMed] [Google Scholar]
- 3. Wang X, Liu R, Zhu W, et al. UDP‐glucose accelerates SNAI1 mRNA decay and impairs lung cancer metastasis. Nature. 2019;571(7763):127‐131. [DOI] [PubMed] [Google Scholar]
- 4. Li Q, Pan X, Zhu D, Deng Z, Jiang R, Wang X. Circular RNA MAT2B promotes glycolysis and malignancy of hepatocellular carcinoma through the miR‐338‐3p/PKM2 axis under hypoxic stress. Hepatology. 2019;70(4):1298‐1316. [DOI] [PubMed] [Google Scholar]
- 5. Chen F, Chen J, Yang L, et al. Extracellular vesicle‐packaged HIF‐1alpha‐stabilizing lncRNA from tumour‐associated macrophages regulates aerobic glycolysis of breast cancer cells. Nat Cell Biol. 2019;21(4):498‐510. [DOI] [PubMed] [Google Scholar]
- 6. Malakar P, Stein I, Saragovi A, et al. Long noncoding RNA MALAT1 regulates cancer glucose metabolism by enhancing mTOR‐mediated translation of TCF7L2. Cancer Res. 2019;79(10):2480‐2493. [DOI] [PubMed] [Google Scholar]
- 7. Chen J, Yu Y, Li H, et al. Long non‐coding RNA PVT1 promotes tumor progression by regulating the miR‐143/HK2 axis in gallbladder cancer. Mol Cancer. 2019;18(1):33. [DOI] [PMC free article] [PubMed] [Google Scholar]
- 8. Wang Y, Lu J‐H, Wu Q‐N, et al. LncRNA LINRIS stabilizes IGF2BP2 and promotes the aerobic glycolysis in colorectal cancer. Mol Cancer. 2019;18(1):174. [DOI] [PMC free article] [PubMed] [Google Scholar]
- 9. Bian Z, Zhang J, Li M, et al. LncRNA‐FEZF1‐AS1 promotes tumor proliferation and metastasis in colorectal cancer by regulating PKM2 signaling. Clin Cancer Res. 2018;24(19):4808‐4819. [DOI] [PubMed] [Google Scholar]
- 10. Qu L, Ding J, Chen C, et al. Exosome‐transmitted lncARSR promotes sunitinib resistance in renal cancer by acting as a competing endogenous RNA. Cancer Cell. 2016;29(5):653‐668. [DOI] [PubMed] [Google Scholar]
- 11. Qu L, Wu Z, Li Y, et al. A feed‐forward loop between lncARSR and YAP activity promotes expansion of renal tumour‐initiating cells. Nat Commun. 2016;7:12692. [DOI] [PMC free article] [PubMed] [Google Scholar]
- 12. Zhuang M, et al. MALAT1 sponges miR‐106b‐5p to promote the invasion and metastasis of colorectal cancer via SLAIN2 enhanced microtubules mobility. EBioMedicine. 2019;41:286‐298. [DOI] [PMC free article] [PubMed] [Google Scholar]
- 13. Niaz S. The AGO proteins: an overview. Biol Chem. 2018;399(6):525‐547. [DOI] [PubMed] [Google Scholar]
- 14. Schwartz L, Supuran CT, Alfarouk KO. The Warburg effect and the hallmarks of cancer. Anticancer Agents Med Chem. 2017;17(2):164‐170. [DOI] [PubMed] [Google Scholar]
- 15. Li Q, Wei P, Wu J, et al. The FOXC1/FBP1 signaling axis promotes colorectal cancer proliferation by enhancing the Warburg effect. Oncogene. 2019;38(4):483‐496. [DOI] [PubMed] [Google Scholar]
- 16. El Hassouni B, Granchi C, Vallés‐Martí A, et al. The dichotomous role of the glycolytic metabolism pathway in cancer metastasis: interplay with the complex tumor microenvironment and novel therapeutic strategies. Semin Cancer Biol. 2020;60:238‐248. [DOI] [PubMed] [Google Scholar]
- 17. Zhao S, Hongcheng S, Weiliang J, Yushuai M. miR‐4775 promotes colorectal cancer invasion and metastasis via the Smad7/TGFbeta‐mediated epithelial to mesenchymal transition. Mol Cancer. 2017;16(1):12. [DOI] [PMC free article] [PubMed] [Google Scholar]
- 18. Jackstadt R, Van Hoof SR, Leach JD. Epithelial NOTCH signaling rewires the tumor microenvironment of colorectal cancer to drive poor‐prognosis subtypes and metastasis. Cancer Cell. 2019;36(3):319‐336.e317. [DOI] [PMC free article] [PubMed] [Google Scholar]
- 19. Wang Z, Yang B, Zhang M. lncRNA epigenetic landscape analysis identifies EPIC1 as an oncogenic lncRNA that interacts with MYC and promotes cell‐cycle progression in cancer. Cancer Cell. 2018;33(4):706‐720.e709. [DOI] [PMC free article] [PubMed] [Google Scholar]
- 20. Thomson DW, Dinger ME. Endogenous microRNA sponges: evidence and controversy. Nat Rev Genet. 2016;17(5):272‐283. [DOI] [PubMed] [Google Scholar]
- 21. Yang J, Qiu Q, Qian X, et al. Long noncoding RNA LCAT1 functions as a ceRNA to regulate RAC1 function by sponging miR‐4715‐5p in lung cancer. Mol Cancer. 2019;18(1):171. [DOI] [PMC free article] [PubMed] [Google Scholar]


