

Abstract
Ex vivo evaluation of personalized models can facilitate individualized treatment selection for patients, and advance the discovery of novel therapeutic options. However, for embryonal malignancies, representative primary cultures have been difficult to establish. We developed patient‐derived cell cultures (PDCs) from chemo‐naïve and post–treatment neuroblastoma tumors in a consistent and efficient manner, and characterized their in vitro growth dynamics, histomorphology, gene expression, and functional chemo‐response. From 34 neuroblastoma tumors, 22 engrafted in vitro to generate 31 individual PDC lines, with higher engraftment seen with metastatic tumors. PDCs displayed characteristic immunohistochemical staining patterns of PHOX2B, TH, and GD2 synthase. Concordance of MYCN amplification, 1p and 11q deletion between PDCs and patient tumors was 83.3%, 72.7%, and 80.0% respectively. PDCs displayed a predominantly mesenchymal‐type gene expression signature and showed upregulation of pro‐angiogenic factors that were similarly enriched in culture medium and paired patient serum samples. When tested with standard‐of‐care cytotoxics at human C max‐equivalent concentrations, MYCN‐amplified and non‐MYCN‐amplified PDCs showed a differential response to cyclophosphamide and topotecan, which mirrored the corresponding patients’ responses, and correlated with gene signatures of chemosensitivity. In this translational proof‐of‐concept study, early‐phase neuroblastoma PDCs enriched for the mesenchymal cell subpopulation recapitulated the individual molecular and phenotypic profile of patient tumors, and highlighted their potential as a platform for individualized ex vivo drug‐response testing.
Keywords: cell culture, mesenchymal gene signature, neuroblastoma, patient‐derived xenograft, personalized medicine
We developed a system to efficiently and consistently generate patient‐derived cultures (PDCs) of neuroblastoma that recapitulated individual patient’s cytogenetic and immunohistochemical features, and phenotypic responses to standard‐of‐care chemotherapy. PDCs predominantly express the gene signature of the recently described neuroblastoma mesenchymal super‐enhancer state. This proof‐of concept provides translational evidence supporting the proposed role of the mesenchymal cell subpopulation in determining clinical treatment response and offers a novel platform for developing personalized ex vivo therapeutic decision‐making strategies for neuroblastoma.
1. INTRODUCTION
Neuroblastoma is the commonest extracranial solid tumor of childhood and accounts for a disproportionate percentage of childhood cancer mortalities. 1 , 2 Due to their histologic and biologic heterogeneity, evaluation of new therapeutic strategies via classic clinical trials is slow and unable to account for individual tumor’s susceptibilities and evolutionary patterns. 3 , 4 Thus, therapeutic advancements for neuroblastoma may be better realized via a personalized approach. However, current personalized‐medicine approaches based on mutational profiling are limited by the low mutational burden of pediatric tumors, especially neuroblastoma. 5 Also, these assays can only provide an assumption of treatment susceptibility. Personalized preclinical models can serve as avatars to facilitate individualized treatment strategies. However, current systems have limited application in embryonal cancers. Patient‐derived xenografts (PDXs) are limited by cost, efficiency, and low engraftment rates, particularly in neuroblastoma. 6 , 7 , 8 , 9 Matrix‐based organoid cultures cultivate primarily epithelial cells and, while useful for adult carcinomas, have had limited application in predominantly mesenchymal embryonal tumors, 10 , 11 with no patient‐derived models of neuroblastoma developed to date using matrix‐based systems. 12
Small blue round cell embryonal tumors lack a prominent scaffold in vivo and, in fact, Schwannian stroma‐poor tumors have been associated with poor prognosis. 13 Thus, while traditional tissue culture may not fully recapitulate three‐dimensional forms, in vitro aqueous environments may replicate their in vivo microenvironment just as well. In fact, neuroblastoma cultures spontaneously form spheroid aggregates in culture without the need for an artificial scaffold or matrix. 14 , 15 , 16 Furthermore, it is inexpensive, highly scalable, and has demonstrated translational relevance in other pediatric tumors. 17 , 18 However, there has been limited experience with generation and translational use of patient‐derived cell cultures (PDCs) of neuroblastoma. We hypothesized that by mimicking the aqueous milieu of their natural microenvironment, mixed cell populations could be consistently cultured from patient tumors. We developed PDCs from neuroblastoma patient samples with high efficiency and consistency, and demonstrated their recapitulation of the original tumors’ molecular and phenotypic profile, particularly their translational potential to reflect individualized responses to chemotherapy.
2. MATERIALS AND METHODS
2.1. Patients and ethics
With institutional review board approval (SHS/2014/2079), malignant pediatric solid tumor patients managed at KK Women's and Children's Hospital (KKH), Singapore, with excess tissues from surgical procedures were recruited from June 2016 to May 2018. Parental consent and child assent were obtained. Data were collected from the Singapore Childhood Cancer Registry, including demographics, disease stage, histological diagnosis, cytogenetics, treatment status, and survival outcomes.
2.2. Human tumor specimens
Following excision, sterile tumor specimens were first reviewed by the attending pathologist in order not to compromise clinical diagnosis. If excess tumor material was available, fresh tissue aliquots were placed in DMEM medium (Nacalai Tesque, Cat. no. 08458‐45) with antimycolytic solution 0.1% (Nacalai Tesque, Cat. no. 09366‐44) and transported on ice to the VIVA‐KKH Pediatric Solid Tumor Research Laboratory, Singapore. Adjacent frozen section slides were reviewed to verify the lesional quality of the allocated tumor. Aliquots were snap frozen for molecular analysis.
2.3. Cell culture and cytological characterization
Five published media formulations were compared by evaluating the engraftment success of explant cultures over sequential batches of 5 tumors. 19 , 20 , 21 , 22 Beginning with the first pair of conditions, media that engrafted ≤20% (ie, ≤1 of 5) tumors per batch were discontinued, while media that engrafted >20% (ie, ≥2 of 5) tumors per batch were retained and tested against the next media formulation, in order, until a single optimal condition was identified. See Supporting Information Data S1 for details on media formulations and morphological evaluation.
Tumors were rinsed, finely minced and plated onto 60 mm tissue culture dishes (Corning Cat. no. 430196). Cultures were passaged when cells reached 70%‐80% confluency. At each passage, cells were counted and representative bright‐field phase‐contrast microscopy images captured. At passages 5‐6, cells cultured on chamber slides (SPL Life Sciences, Cat. no. 30101) and/or used to create cytospots, were fixed in Shandon cytospin fluid (Thermo Fisher Scientific, Cat. no. 6768315) or 10% buffered formalin (Leica Biosystems, Cat. no. 3800598) for FISH and immunohistochemical staining, respectively.
Commercial neuroblastoma cell lines used for comparative analysis (NB1; RRID:CVCL_1440, SK‐N‐DZ; RRID:CVCL_1701, SK‐N‐FI; RRID:_CVCL1702, SK‐N_SH; RRID:CVCL_0531, SH‐SY5Y; RRID:CVCL_0019 (a sub‐clone of SK‐N‐SH)) were obtained from the ATCC; the latter 4 were a gift from Dr. Ho MF, National Dental Centre, Singapore. Short tandem repeat (STR) genotyping of all cell lines and tumor‐PDC pairs was performed using PowerPlex® 21 (Promega, Cat. no. DC8902) using 1 ng of DNA. PCR products were resolved in an Applied Biosystems® SeqStudio genetic analyzer and compared.
2.4. Molecular and protein characterization
Neuroblastoma cell lines, PDCs, and corresponding frozen tumors were lysed in TRIzol (Thermo Fisher Scientific, Cat. no. 15596026) and total RNA purified using RNeasy spin columns (QIAGEN, Cat. no. 74104). Gene expression profiling was performed using pooled probes from the nCounter® PanCancer Pathways panel (NanoString Technologies, XT‐CSO‐PATH1‐12, CodeSet:C2535) and a customized neuroblastoma‐specific 10‐gene nCounter® Panel‐Plus set (NanoString Technologies, CodeSet:C5938). Probes were hybridized at 65°C for 20 h. Automated imaging and counting of probes was performed using an nCounter Digital Analyzer on 555 fields of view and analyzed using nSolver 4.0 analysis software (NanoString Technologies, RRID:SCR_003420) using default settings, then subjected to principal component analysis using pcaExplorer 2.10. Analysis was repeated with subsets of genes from the mesenchymal and adrenergic super‐enhancer signatures (see Data S2).
Cell supernatant collected from 70% confluent PDCs and matched patients’ plasma was centrifuged (18 500 g, 5 min) prior to overnight incubation on a Human Angiogenesis Antibody Array™ (ABCAM, Cat. no. 193655). Chemiluminescence imaging was performed using a ChemiDoc™ Imaging System (Bio‐Rad). Signal intensities were quantified using ImageJ v.1.52 software (RRID: SCR_003070) and respective protein and internal control standard ratios analyzed.
Immunohistochemistry was performed for expression of key neuroblastoma protein markers TH, GD2, PHOX2B and FISH for profiling key cytogenetic features involving MYCN, 1p and 11q (see Data S1).
2.5. Statistical analysis
Clinical and pathological variables were correlated with engraftment of PDCs using the chi‐square test, and 2‐sided asymptotic significance reported. Group means of NanoString® counts were compared with one‐way ANOVA using R 3.6.1. Genes from the NanoString PanCancer Pathways panel were matched with PharmGKB and DGIdb databases (accessed 8 February 2020), 23 , 24 and corresponding gene‐drug linkages annotated. Linkages with “associated” and “definite” relationships were selected from PharmGKB and DGIdb databases respectively, and distributions compared with one‐way ANOVA.
2.6. In vitro drug‐response assay
In vitro drug concentrations were tailored to match human serum Cmax of drug doses administered in clinical protocols, with cyclophosphamide (Baxter, NDC 10019‐955‐01) at 250‐2100 mg/m2 and topotecan hydrochloride (Accord Healthcare, NDC 16729‐151‐31) at 0.75‐2 mg/m2. See Data S1 for derivation of in vitro concentrations from pharmacokinetic data. PDCs were seeded onto 96‐well plates containing Media 3 and IncuCyte Cytotox Red 250 nM (1:4000 dilution) (Essen Biosciences, Cat. no. 4632); 24 h later, 10 µL of drug at the above concentrations was added to each well. Fluorescent and phase‐contrast images were captured on an IncuCyte® S3 system every 6 h using a ×4 objective lens and up to 72 h. Experiments were performed in triplicate and relative cytotoxicity against controls was measured.
3. RESULTS
3.1. Identification of optimal conditions for engraftment of neuroblastoma PDCs
Over 2 years, in a prospective study, we recruited 170 of 187 (90.9%) pediatric patients with tumors. Among 72 patients with neuroblastoma, excess tumor from 34 (47%) pre‐treatment, post–treatment and patients who relapsed were used to generate preclinical models (Figure 1A). In total, 22 (64.7%) tumors were engrafted in vitro to generate 31 individual PDC lines; simultaneously 7 (20.6%) were engrafted in vivo as PDXs for comparison and validation; 5 did not engraft via either route (Table S1). To determine the media conditions that would yield the most consistent engraftment of PDCs while optimizing the small amount of available starting material, we compared engraftment rates in sequential pairs of 5 published media formulations in a head‐to‐head elimination approach (Figure 1B). 19 , 20 , 21 , 22 Media 3, followed by Media 2, were the most consistent, engrafting 16/26 and 9/20 PDC lines respectively (Figures 1B and S1A,B).
FIGURE 1.
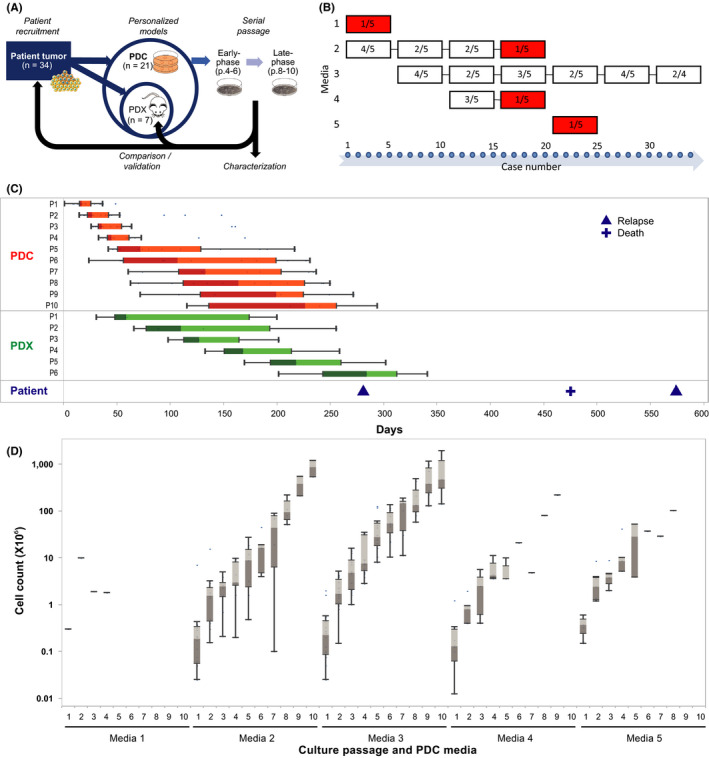
Consistent engraftment and sustained growth of neuroblastoma PDCs can be achieved in a clinically relevant time frame. A, Experimental schema showing derivation of PDCs and characterization of early‐ and late‐phase cultures, and comparison back with corresponding patient tumors and PDXs. B, Comparison of 5 media conditions, showing number of successful engraftments of explant cultures in each sequential batch of 5 tumors, with cessation of failed media conditions with ≤20% engraftment rate (red). C, Boxplots of median days from date of initial seeding or implantation to serial passages of 28 PDC (red) and 6 PDX lines (green), and to corresponding patient relapse and death events (blue). D, Boxplots of log median cell numbers obtained per passage for cultures grown under 5 serial media conditions
To evaluate the clinical significance of the PDCs, in vitro engraftment was correlated with clinical and pathological covariates. Engraftment was higher with metastatic tumors than with localized tumors, notably engraftment did not differ according to histopathological classification or cytogenetic risk features (Table 1).
TABLE 1.
Correlation of engraftment of PDC (in any medium) with clinical and pathological features
| Variable | Engraftment | Chi‐square | P‐value | |||
|---|---|---|---|---|---|---|
| No | Yes | |||||
| n | % | n | % | |||
| Gender | ||||||
| Male | 8 | 53.3% | 7 | 36.8% | 0.925 | .336 |
| Female | 7 | 46.7% | 12 | 63.2% | ||
| Treatment status | ||||||
| Pre–chemo/relapse | 1 | 6.7% | 3 | 15.8% | 0.672 | .412 |
| Post–chemo | 14 | 93.3% | 16 | 84.2% | ||
| INPC | ||||||
| FH | 9 | 60.0% | 10 | 52.6% | 0.185 | .667 |
| UH | 6 | 40.0% | 9 | 47.4% | ||
| Metastatic | ||||||
| Metastatic | 7 | 46.7% | 15 | 78.9% | 3.825 | .051 |
| Local/regional | 8 | 53.3% | 4 | 21.1% | ||
| MYCN | ||||||
| Amplified | 3 | 20.0% | 5 | 26.3% | 0.186 | .666 |
| Non‐amplified | 12 | 80.0% | 14 | 73.7% | ||
| 1p deletion | ||||||
| Deleted | 5 | 33.3% | 5 | 26.3% | 0.199 | .656 |
| Not deleted | 10 | 66.7% | 14 | 73.7% | ||
| 11q deletion | ||||||
| Deleted | 5 | 33.3% | 9 | 47.4% | 0.682 | .409 |
| Not deleted | 10 | 66.7% | 10 | 52.6% | ||
| INSS | ||||||
| 1 | 1 | 6.7% | 1 | 5.3% | 8.557 | .073 |
| 2 | 2 | 13.3% | 2 | 10.5% | ||
| 3 | 5 | 33.3% | 0 | 0.0% | ||
| 4 | 7 | 46.7% | 15 | 78.9% | ||
| 4S | 0 | 0.0% | 1 | 5.3% | ||
Abbreviations: FH, favorable histology; INPC, International Neuroblastoma Pathology Classification system; INSS, International Neuroblastoma Staging System; UH, unfavorable histology.
To determine if PDCs could be sufficiently expanded within a clinically relevant time frame, we compared the time between serial in vitro passages with the time between in vivo passages of corresponding PDXs, and times to relapse and death events of the corresponding patients. Median time to first passage of PDCs was 17 days, while median time to first passage of PDXs was 59 days. By the time of the earliest disease relapse event (9.4 months from time of surgery), PDCs had completed a median of 10 passages, while PDXs had completed a median of 5 passages (Figure 1C). In Media 3, total cell numbers expanded exponentially from median 0.2 × 10⁶ to 6.8 × 10⁸ over 9 passages (Figure 1D); median time to first passage was 17.5 days and median doubling time of PDC populations was 5.8 days (Figure S1C,D). We selected Media 3 as the optimal growth condition for neuroblastoma PDC derivation.
3.2. Neuroblastoma PDCs recapitulate cytological and cytogenetic characteristics of original patient tumors
On bright‐field microscopy, PDCs in Media 3 grew as semi‐adherent clusters of spheroidal cells with prominent nuclei and scant cytoplasm and occasional neurite processes, heaped over flat adherent cells with broad lamellipodia, consistent with the morphology of neuroblastic (N‐type) and intermediate (I‐type) cells heaped over stromal (S‐type) cells (Figure 2A). Late passage cultures displayed less N‐ and I‐type morphology with more predominant S‐type populations (Figure S2A‐F).
FIGURE 2.
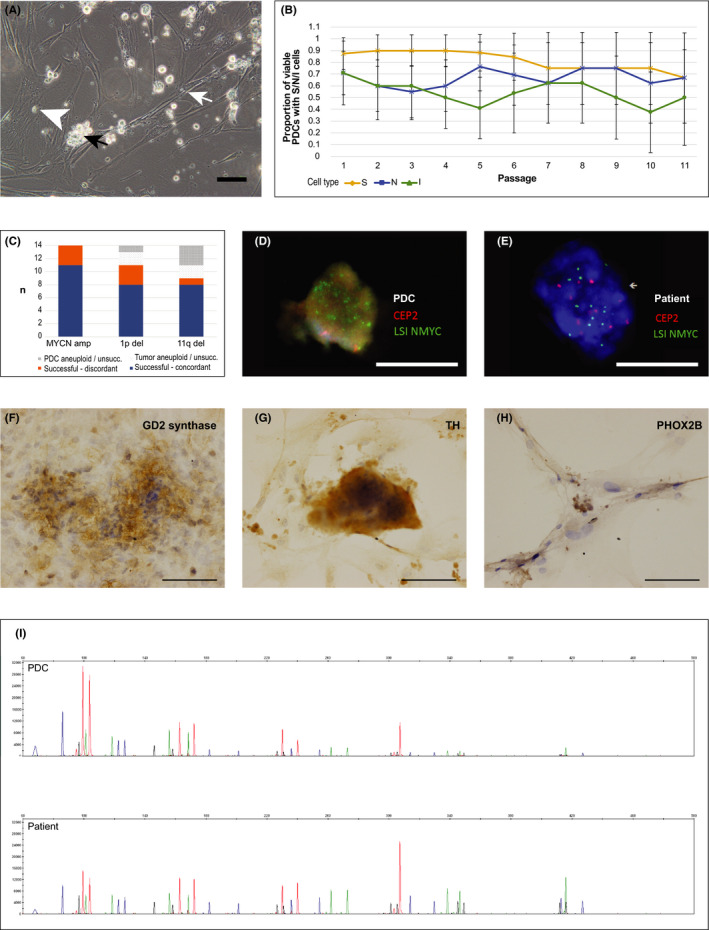
PDCs recapitulate established cytological characteristics of neuroblastoma. A, Representative phase‐contrast photomicrograph of S‐type (white arrow), N‐type (white arrowhead), and cluster of I‐type (black arrow) cells in PDC culture (NBL27‐0218A, Media 3 passage 5) (×20 magnification; bar, 100 µm). B, Proportion of viable PDCs grown in Media 3 with S‐, N‐, and I‐type cells identified, over the first 11 passages (adjusted Wald proportion, 95% CI). C, Comparison of success of FISH assays for MYCN amplification, 1p and 11q deletion for 14 PDCs grown in Media 3, and concordance with respective patient tumors. D, E, Representative fluorescence microscopy images demonstrating amplification of NMYC (green) compared with control (CEP2, red) in PDC and corresponding patient tumor (NBL06‐0318, Media 3) (×60 magnification; bars, 10 µm). F‐H, Representative photomicrographs of PDCs showing immunohistochemical expression of neuroblastoma markers GD2 synthase (NBL03‐0117), TH (NBL07‐0317), and PHOX2B (NBL23‐0418) (×20 magnification; bars,100 µm). I, Representative electropherograms from 21‐STR loci panels of PDC (upper panel) and corresponding patient tumor (lower panel) (NBL 10‐0518, Media 3)
To determine if the relative distribution of cell types differed over time and between medium conditions, we scored phase‐contrast microscopy images of PDCs for the presence of the 3 cell types. Over the first 10 passages, S‐, N‐ and I‐type cells were maintained at a near‐equal frequency in Media 3 (40.9 ± 1.4%, 35.1 ± 1.2% and 24.0 ± 1.7%, respectively) (Figure 2B). In other media, I‐type cells became relatively infrequent (≤20%) soon after the 2nd to 3rd passage before senescing (Figure S2G‐P). Having observed that stromal and neuroblastic cell populations were present and maintained in Media 3 PDCs over serial passages, we sought to determine if PDCs also maintained the cytological and molecular features of the original patient tumors.
We compared key cytogenetic characteristics of 14 PDC lines grown in Media 3 with the corresponding patient tumors. MYCN amplification, and 1p and 11q deletion status were concordant in 79% (11/14), 73% (8/11), and 89% (8/9) of PDC‐tumor pairs, respectively (Figures 2C‐E and S3A‐F and Table S2). Immunohistochemical staining of PDCs demonstrated membranous GD2 synthase expression, cytoplasmic TH expression, and nuclear PHOX2B expression (Figure 2F‐H), similar to corresponding tumor sections, but generally of weaker intensity (Figure S3G‐O). STR fingerprinting for all 16 PDC lines grown in Media 3 showed identical genotypes compared with the respective patient tumors (Figure 2I and Data S3 (Supplemental STR profiles)). These results showed recapitulation of individualized chromosomal and microsatellite markers in tumor‐PDC pairs. However, given the expected heterogeneity of original tumor cell populations, we investigated if PDCs might be enriched for particular subpopulations.
3.3. Neuroblastoma PDCs demonstrate a predominantly mesenchymal gene expression signature
We compared the differential mRNA expression of 780 established neuroblastoma‐ and cancer pathway‐associated genes in the NanoString® PanCancer Pathways panel among 11 tumor‐PDC pairs, and 5 commercial neuroblastoma cell lines (Table S3). Separate principal components (PCs) delineated the differentially expressed genes that distinguished PDCs, tumors, and cell lines (Figure 3A). The genes that distinguished PDCs and tumors from cell lines (represented by PC1) included E2F1, a known regulator of MYCN 25 ; CCNB1, a prognostic biomarker recently described in neuroblastoma 26 , 27 , 28 ; Wnt pathway genes, as well as multiple histone cluster family members (Figure 3B). The genes that distinguished PDCs and tumors (represented by PC2) were adrenergic‐type neuroblastoma genes PHOX2B and TH, as well as pro‐angiogenic factors such as IL‐6, LIF, FGF, and vascular endothelial growth factor (VEGF) (Figure 3C).
FIGURE 3.
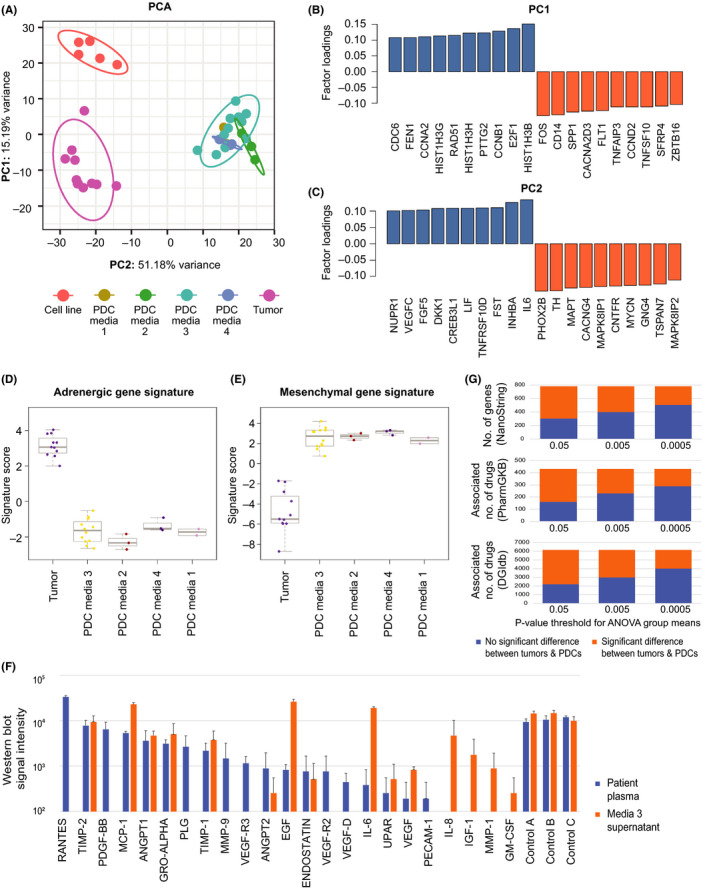
Neuroblastoma PDCs demonstrate a predominantly mesenchymal gene expression signature. A, Principal component analysis plot illustrating the relationships between NanoString® gene expression signatures of PDCs, commercial cell lines, and patient tumors, with factors summarizing linear combinations of original variables specimen type, medium, and passage. B, C, Genes with top and bottom loadings for PC1 and PC2; factor loadings being correlation coefficients between factors and above variables. D, E, Signature scores of condensed 43‐gene neuroblastoma adrenergic and mesenchymal gene expression signatures of PDCs and patient tumors. F, Comparison of semi‐quantitative western blot signal intensity of pro‐angiogenic factors and controls detected in paired samples of patient serum at the time of diagnosis, and supernatant of corresponding PDCs grown in Media 3. G, Comparison of number of genes from a 780‐gene NanoString panel with group means above or below statistical significance thresholds at P = .05, .005, and .0005, by between‐subjects ANOVA (top panel); number of drugs mapped to associated genes according to “associated” and “definite” drug‐gene linkages from PharmGKB and DGIdb databases (middle and lower panels)
As adrenergic (ADRN) and mesenchymal (MES) super‐enhancer transcription states are thought to represent distinct neuroblastoma cell types, 29 , 30 we evaluated the expression of genes from the neuroblastoma super‐enhancer signatures that were in the PanCancer Pathways panel in tumors and PDCs. Compared with the original tumors, PDCs showed decreased expression of genes from the adrenergic signature and increased expression of genes from the mesenchymal signature (Figures 3D,E and S4A‐C).
Given the high expression of pro‐angiogenesis genes in PDCs, we compared the expression of pro‐angiogenic proteins in the supernatant of PDCs grown in Media 3 and paired plasma samples drawn at the time of surgery in 2 patients. TIMP‐2, MCP1, ANGPT1, ANGPT2, GRO‐alpha, TIMP1, endostatin, UPAR, VEGF, EGF, and IL‐6 were detected in both media and plasma samples. Notably, IL‐8, IGF‐1, MMP‐1 and GM‐CSF were present in only in media, and RANTES—a chemokine associated with cell survival in neuroectodermal tumors 31 , 32 —was the most abundant plasma protein, but absent in media (Figures 3F and S5).
Next, we sought to assess how differences in gene expression between tumors and PDCs might relate to the latter's capacity to extrapolate potential clinical characteristics. First, we compared the group means of the expression of the above 780 genes between tumors and PDCs using between‐subjects ANOVA. At significance thresholds of P = .05, .005, and .0005, the expression of 38.8%, 50.9%, and 64.6% of genes, respectively, were not significantly different between tumors and PDCs (Figure 3G). Then we mapped each gene to associated drugs from 2 public domain pharmacogenomics databases as a surrogate measure of potential therapeutic predictions that might be estimated from gene expression. At the same significance thresholds, the percentage of corresponding drug‐gene linkages were similar, at 34.9%, 51.8%, and 59.7%, and 35.8%, 48.2%, and 64.9%, for linkages mapped via the PharmGKB and DGIdb databases, respectively (Figure 3G). 23 , 24 Notably, expression of actionable genes with available targeted agents were more similar between tumors and PDCs compared with commercial cell lines. These included tyrosine kinases RET, MET, and PIK3CA, checkpoint regulators ATM and ATR, and tumor suppressors TP73, BRCA1 and BRCA2 (Figure S4D).
Together, this suggested that PDCs were enriched for the mesenchymal cell subpopulation and were supported in vitro by pro‐angiogenic factors also present in the tumor microenvironment. Furthermore, at stringent statistical thresholds, the expression of clinically relevant genes did not significantly differ between tumors and PDCs.
3.4. Drug‐response phenotype of neuroblastoma PDCs reflect individual patients’ treatment response
To determine if PDCs would reflect individual patient's treatment responses, we tested PDCs with serum Cmax‐equivalent concentrations of chemotherapy from common first‐ and second‐line protocols, and correlated them with the tumor response on serial imaging. A 3‐y‐old child with high‐risk MYCN‐amplified disease demonstrated an enhanced response to a high‐dose cyclophosphamide‐based neoadjuvant regimen (2100 mg/m2, Modified N7), 33 mirroring the response seen in a non‐MYCN‐amplified tumor (96.4% and 96.6% post–chemotherapy volume reduction, respectively) (Figure 4A,B). Corresponding PDCs showed comparable cytotoxicity (median 1.8‐fold and 2.3‐fold normalized response, respectively) following 72 h treatment with Cmax‐equivalent concentrations of cyclophosphamide (383 µM) (Figure 4C,D). 34 The patient achieved complete remission with the high‐dose cyclophosphamide regimen, and remained disease‐free 3 years after completion of therapy.
FIGURE 4.
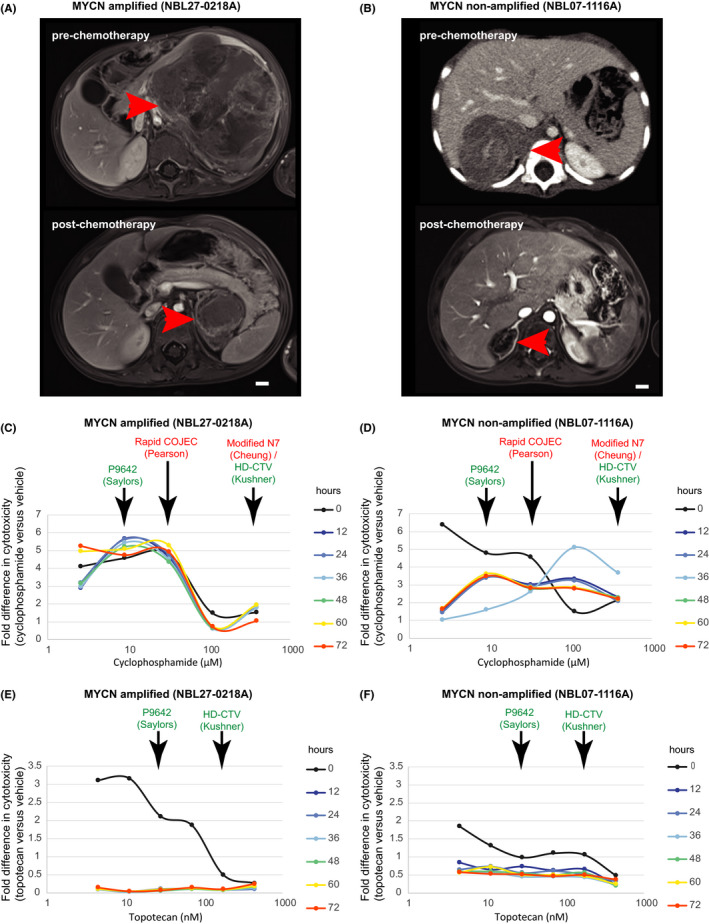
Phenotypic in vitro drug response of PDCs parallels patient response in dose‐dependent manner. Pre–chemotherapy and post–chemotherapy contrast‐enhanced axial MRI images of samples from patients with representative MYCN‐amplified (A) and non‐amplified (B) tumors, demonstrating tumor (arrows) response to 4 cycles of neoadjuvant chemotherapy (bars, 1 cm). Corresponding dose‐response curves of PDCs grown from the above patients’ tumors following exposure to clinically relevant doses of cyclophosphamide and topotecan over 72 h, showing fold difference in cytotoxicity‐induced fluorescence in PDCs exposed to chemotherapy vs vehicle (2.6, 8.9, 31.3, 109.4, or 383.0 µM cyclophosphamide; 4.5,11.2, 28.1, 70.2, 175.6, or 439.0 nM topotecan) (C‐F). Clinically relevant concentrations corresponding to the Cmax of doses used in common first‐ and second‐line chemotherapy regimens are indicated in red and green, respectively
Additionally, we explored PDC responses to other doses of cyclophosphamide, and to topotecan, modeling expected serum Cmax exposures if other treatment protocols were used. 35 , 36 , 37 , 38 At lower doses of cyclophosphamide, such as in alternative front‐line regimens (Rapid COJEC), or second‐line regimens (P9642), the MYCN‐amplified PDCs still showed increased cytotoxicity compared with non‐MYCN‐amplified PDCs (median 4.7‐fold and 5.4‐fold, vs 2.9‐fold and 3.5‐fold responses, respectively). We correlated the observed drug responses with the expression of genes known to be differentially regulated in cyclophosphamide resistance. Compared with a panel of 8 other neuroblastoma tumors, the index MYCN‐amplified tumor and corresponding PDC both showed increased expression of genes related to inflammation, apoptosis, TGF‐beta signaling and cell proliferation (ID1, ANGPT1, ITGA2, DUSP6, RRAS2, LAT, COL2A1, TNFSF10, CCNE2, BNIP3), a signature associated with sensitivity to cyclophosphamide (Figure S6C,D). 39 In contrast, at Cmax‐equivalent concentrations of topotecan from second‐line regimens (P9642 and HD‐CTV) (Figures 4E,F and S6A‐B), MYCN‐amplified PDCs showed less sustained response to topotecan compared to the MYCN non‐amplified PDCs, interestingly, as topotecan is known to induce senescence especially in MYCN‐amplified neuroblastoma cells. 40 Overall, these suggested that this anecdotal patient's fortunate and unique gene expression profile might have accounted for the high degree of tumor response observed, and demonstrated how the patient's gene expression profile and phenotypic response were both accurately reflected by his corresponding PDCs.
4. DISCUSSION
Individualized multilineage cultures could be generated from pre–chemotherapy and post–chemotherapy neuroblastoma specimens that reflected the original tumors’ cytogenetic characteristics and retained their gene expression profiles over multiple passages. Recapitulation of the in vivo tumor serum milieu appeared to be a critical factor to facilitate PDC generation. Despite the lack of a supporting matrix, neuroblastoma PDCs in aqueous media were able to engraft and propagate consistently as stable cultures. Typical of primitive small blue round cell tumors, neuroblastoma cells lacked a robust scaffold in vivo. In our tumor‐derived PDCs, stromal and neuroblastic cell subpopulations spontaneously formed semi‐adherent clusters, similar to the spheroid forms seen in neuroblastoma bone marrow metastasis‐derived primary cultures. 19 As early‐phase cultures, PDCs avoided the artificial adaptation associated with commercial cancer cell lines that resulted from selection pressures and mutational drift from repeated passaging or the use of non‐physiological conditions such as serum‐free medium. However, even in serum‐free medium, it has been shown that the gene expression profile of tumor cells from patients with neuroblastoma are still more similar to tumors from patients than to commercial cell lines. 21 Cancer cell lines also show a bias toward more aggressive tumor types and so may be less representative of true tumor heterogeneity. 41 Indeed, these factors have been identified as critical considerations to support the use of patient‐derived in vitro platforms for personalized‐medicine applications. 42 , 43 , 44
To justifiably use in vitro primary cultures for clinical phenotypic response prediction, PDCs must preserve clinically important tumor cell subpopulations and thereby conserve the global tumor heterogeneity and parent tumor fidelity. Our findings support the hypothesis that neuroblastomas are composed of a highly plastic, multilineage mix of stromal, neuroblastic and stem‐like cells. Arising from embryonal neural crest progenitors, these cells can interconvert and establish an equilibrium through inter‐population crosstalk. 14 , 16 , 45 , 46 , 47 Among them, the stromal cell population plays a central role in determining tumor behavior and proliferation. 15 This subpopulation is characterized by upregulation of Wnt pathway genes and are recognizable by their adherent, spindle forms; 29 , 48 they are associated with stroma‐poor tumor histology and increased resistance to chemotherapy. 46 Thus, for phenotypic drug‐response assays to meaningfully determine potential chemoresponsiveness, the patient‐derived avatar may need to adequately preserve this high‐risk population of cells that plays a central role in treatment success.
More recently mesenchymal and adrenergic states have been defined, 29 , 49 with the mesenchymal subpopulation principally responsible for mediation of immune response, chemoresistance and clinical relapse. 48 In contrast with established cell lines, which are predominantly adrenergic, 50 we found neuroblastoma PDCs to be enriched for the mesenchymal gene signature, with differential expression of Wnt pathway and histone cluster genes. Wnt signaling has been proposed to play a key role in regulating neuroblastoma mesenchymal and adrenergic cell lineages, 51 , 52 as well as induction and development of fetal neural crest cells, 53 , 54 while epigenetic alterations have been shown to block the apoptotic effect of cytotoxic chemotherapy in neuroblastoma, through functional suppression of p53‐induced apoptosis. 55 Correspondingly, in our uniquely chemosensitive high‐risk MYCN‐amplified patient, expression of Histone Cluster 1 H3 family genes were globally downregulated in comparison with other high‐risk patients in our study population. His PDCs, reflecting the same cyclophosphamide‐sensitive phenotype in vitro, supported the purported significance of the mesenchymal subpopulation in determining treatment response, and the potential for PDCs as a platform for individualized treatment response prediction.
The mainstay of personalized‐medicine strategies in current clinical use involved sequencing‐based mutational profiling of patient tumor specimens, rather than phenotypic drug‐response testing. While the former has shown benefit in adult cancers with predominant driver mutations, it may have limited value in genomically quiet embryonal cancers such as neuroblastoma. 56 Prior pediatric personalized‐medicine programs have had poor yield with neuroblastoma, with actionable genomic alterations detected in only 1 in 4 patients using whole exome sequencing and 3 in 8 patients using a targeted sequencing panels, with none in either study actually receiving the identified therapy. 57 , 58 Using genome‐wide mRNA expression profiles, targeted therapies prescribed by a molecular tumor board yielded a partial response in only 1 of 14 neuroblastoma patients. 59 Attempts at using cell line‐derived genomic predictors for personalized treatment‐response prediction have also met with varying success. 60 However, high and consistent engraftment rates and accurate chemotherapeutic response prediction have been achieved in PDCs of epithelial carcinomas, sarcomas, and neuroendocrine tumors. 60 , 61 Our findings add to the existing evidence that supports the potential for PDC‐based personalized treatment‐response prediction.
This study was most constrained by the limited size of the available tumor specimens and the number of cells generated at each passage, which had to be distributed sparingly for experiments, passaging, and cryopreservation. By limiting molecular and phenotypic characterization to only the initial passages, this further limited the number of technical replicates. Also, preclinical models may not fully capture the clonal heterogeneity of the original tumors. 8 , 62 In a panel of orthotopic pediatric solid tumor PDXs, only 31% maintained the original tumor's major clonal features, with the lowest temporal stability and clonal preservation among neuroblastoma PDXs. 6 However characteristic and clinically significant chromosomal changes such as MYCN amplification and 1p deletion remained well preserved between neuroblastoma tumors‐PDX pairs. 8 , 62 , 63 Similarly, PDCs preserved the key chromosomal features of original patient tumors, despite being enriched for the mesenchymal tumor cell subpopulation. Also, patient‐derived preclinical models are a snapshot of the tumor at 1 time point and cannot reliably predict treatment response at potential future relapses or at other anatomic sites. 64 In vitro drug‐response studies were limited by the scarce material. Also, only Cmax‐equivalent concentrations were tested as an exclusion study and may not fully represent dynamic in vivo physiological conditions. Future ex vivo systems that could model metastatic progression of tumor cells and predict potential changes in drug response could potentially benefit patients with metastatic disease or at high risk of future relapse. 65 To date, such models have been attempted in epithelial cancers, 66 , 67 , 68 but not for embryonal tumors, so further work in this area is needed.
We demonstrated that early‐phase neuroblastoma PDCs reflected the molecular and drug‐response phenotype of original multilineage tumor cell populations. These could potentially be used to provide individualized characterization and drug testing of tumors in an accelerated time frame, to facilitate the prediction of treatment outcomes and discover potential therapeutic alternatives.
DISCLOSURE
The authors have no conflict of interest.
Supporting information
Figure S1
Figure S2
Figure S3
Figure S4
Figure S5
Figure S6
Table S1
Table S2
Table S3
Data S1
Data S2
Data S3
ACKNOWLEDGMENTS
The authors thank Candy Choo, Wan Yi Seow, Khin Mar Cho, Josh Jie Hua Loh, Nur Fatimah Farzanah Binte Jalaludin, York Tien Lee, Richard Weijie Ong, Khurshid Merchant for technical support.
Hee E, Wong MK, Tan SH, et al. Neuroblastoma patient‐derived cultures are enriched for a mesenchymal gene signature and reflect individual drug response. Cancer Sci. 2020;111:3780–3792. 10.1111/cas.14610
Funding information
This study was funded by the National Medical Research Council Singapore (grant no. 0013/2015), SingHealth Duke‐NUS Surgery Academic Clinical Programme (grant no. GRSG14AL), and the VIVA Foundation for Children with Cancer (VIVA‐KKH Paediatric Brain and Solid Tumour Programme).
REFERENCES
- 1. Smith MA, Seibel NL, Altekruse SF, et al. Outcomes for children and adolescents with cancer: challenges for the twenty‐first century. J Clin Oncol. 2010;28(15):2625‐2634. [DOI] [PMC free article] [PubMed] [Google Scholar]
- 2. Perkins SM, Shinohara ET, DeWees T, Frangoul H. Outcome for children with metastatic solid tumors over the last four decades. PLoS One. 2014;9(7):e100396. [DOI] [PMC free article] [PubMed] [Google Scholar]
- 3. Ferrari A, Montello M, Budd T, Bleyer A. The challenges of clinical trials for adolescents and young adults with cancer. Pediatr Blood Cancer. 2008;50(5 Suppl):1101‐1104. [DOI] [PubMed] [Google Scholar]
- 4. Fern LA, Bleyer A. Dynamics and challenges of clinical trials in adolescents and young adults with cancer. Cancer J. 2018;24(6):307‐314. [DOI] [PubMed] [Google Scholar]
- 5. Pugh TJ, Morozova O, Attiyeh EF, et al. The genetic landscape of high‐risk neuroblastoma. Nat Genet. 2013;45(3):279‐284. [DOI] [PMC free article] [PubMed] [Google Scholar]
- 6. Stewart E, Federico SM, Chen X, et al. Orthotopic patient‐derived xenografts of paediatric solid tumours. Nature. 2017;549(7670):96‐100. [DOI] [PMC free article] [PubMed] [Google Scholar]
- 7. Bibby MC. Orthotopic models of cancer for preclinical drug evaluation: advantages and disadvantages. Eur J Cancer. 2004;40(6):852‐857. [DOI] [PubMed] [Google Scholar]
- 8. Braekeveldt N, Bexell D. Patient‐derived xenografts as preclinical neuroblastoma models. Cell Tissue Res. 2018;372(2):233‐243. [DOI] [PMC free article] [PubMed] [Google Scholar]
- 9. Kerbel RS. Human tumor xenografts as predictive preclinical models for anticancer drug activity in humans: better than commonly perceived‐but they can be improved. Cancer Biol Ther. 2003;2(4 Suppl 1):S134‐139. [PubMed] [Google Scholar]
- 10. Drost J, Clevers H. Organoids in cancer research. Nat Rev Cancer. 2018;18(7):407‐418. [DOI] [PubMed] [Google Scholar]
- 11. Saengwimol D, Rojanaporn D, Chaitankar V, et al. A three‐dimensional organoid model recapitulates tumorigenic aspects and drug responses of advanced human retinoblastoma. Sci Rep. 2018;8(1):15664. [DOI] [PMC free article] [PubMed] [Google Scholar]
- 12. Redden RA, Doolin EJ. Microgravity assay of neuroblastoma: in vitro aggregation kinetics and organoid morphology correlate with MYCN expression. Vitro Cell Dev Biol Anim. 2011;47(4):312‐317. [DOI] [PubMed] [Google Scholar]
- 13. Shimada H, Chatten J, Newton WA, et al. Histopathologic prognostic factors in neuroblastic tumors: definition of subtypes of ganglioneuroblastoma and an age‐linked classification of neuroblastomas. J Natl Cancer Inst. 1984;73(2):405‐416. [DOI] [PubMed] [Google Scholar]
- 14. Acosta S, Lavarino C, Paris R, et al. Comprehensive characterization of neuroblastoma cell line subtypes reveals bilineage potential similar to neural crest stem cells. BMC Dev Biol. 2009;9:12. [DOI] [PMC free article] [PubMed] [Google Scholar]
- 15. Ciccarone V, Spengler BA, Meyers MB, Biedler JL, Ross RA. Phenotypic diversification in human neuroblastoma cells: expression of distinct neural crest lineages. Cancer Res. 1989;49(1):219‐225. [PubMed] [Google Scholar]
- 16. Ross RA, Spengler BA, Domènech C, Porubcin M, Rettig WJ, Biedler JL. Human neuroblastoma I‐type cells are malignant neural crest stem cells. Cell Growth Differ. 1995;6(4):449‐456. [PubMed] [Google Scholar]
- 17. Bissig‐Choisat B, Kettlun‐Leyton C, Legras XD, et al. Novel patient‐derived xenograft and cell line models for therapeutic testing of pediatric liver cancer. J Hepatol. 2016;65(2):325‐333. [DOI] [PMC free article] [PubMed] [Google Scholar]
- 18. Wenger A, Larsson S, Danielsson A, et al. Stem cell cultures derived from pediatric brain tumors accurately model the originating tumors. Oncotarget. 2017;8(12):18626‐18639. [DOI] [PMC free article] [PubMed] [Google Scholar]
- 19. Hansford LM, McKee AE, Zhang L, et al. Neuroblastoma cells isolated from bone marrow metastases contain a naturally enriched tumor‐initiating cell. Cancer Res. 2007;67(23):11234‐11243. [DOI] [PubMed] [Google Scholar]
- 20. Coulon A, Flahaut M, Mühlethaler‐Mottet A, et al. Functional sphere profiling reveals the complexity of neuroblastoma tumor‐initiating cell model. Neoplasia. 2011;13(10):991‐1004. [DOI] [PMC free article] [PubMed] [Google Scholar]
- 21. Bate‐Eya LT, Ebus ME, Koster J, et al. Newly‐derived neuroblastoma cell lines propagated in serum‐free media recapitulate the genotype and phenotype of primary neuroblastoma tumours. Eur J Cancer. 2014;50(3):628‐637. [DOI] [PubMed] [Google Scholar]
- 22. Tumilowicz JJ, Nichols WW, Cholon JJ, Greene AE. Definition of a continuous human cell line derived from neuroblastoma. Cancer Res. 1970;30(8):2110‐2118. [PubMed] [Google Scholar]
- 23. Cotto KC, Wagner AH, Feng YY, et al. DGIdb 3.0: a redesign and expansion of the drug‐gene interaction database. Nucleic Acids Res. 2018;46(D1):D1068‐D1073. [DOI] [PMC free article] [PubMed] [Google Scholar]
- 24. Whirl‐Carrillo M, McDonagh EM, Hebert JM, et al. Pharmacogenomics knowledge for personalized medicine. Clin Pharmacol Ther. 2012;92(4):414‐417. [DOI] [PMC free article] [PubMed] [Google Scholar]
- 25. Strieder V, Lutz W. E2F proteins regulate MYCN expression in neuroblastomas. J Biol Chem. 2003;278(5):2983‐2989. [DOI] [PubMed] [Google Scholar]
- 26. Song H, Wu F, Li S, et al. Microarray expression analysis of MYCN‐amplified neuroblastoma cells after inhibition of CDK2. Neoplasma. 2017;64(3):351‐357. [DOI] [PubMed] [Google Scholar]
- 27. Liu Z, Rader J, He S, Phung T, Thiele CJ. CASZ1 inhibits cell cycle progression in neuroblastoma by restoring pRb activity. Cell Cycle. 2013;12(14):2210‐2218. [DOI] [PMC free article] [PubMed] [Google Scholar]
- 28. Han Z, Li B, Wang J, et al. Norcantharidin inhibits SK‐N‐SH neuroblastoma cell growth by induction of autophagy and apoptosis. Technol Cancer Res Treat. 2017;16(1):33‐44. [DOI] [PMC free article] [PubMed] [Google Scholar]
- 29. van Groningen T, Koster J, Valentijn LJ, et al. Neuroblastoma is composed of two super‐enhancer‐associated differentiation states. Nat Genet. 2017;49(8):1261‐1266. [DOI] [PubMed] [Google Scholar]
- 30. Veschi V, Verona F, Thiele CJ. Cancer stem cells and neuroblastoma: characteristics and therapeutic targeting options. Front Endocrinol (Lausanne). 2019;10:782. [DOI] [PMC free article] [PubMed] [Google Scholar]
- 31. Dedoni S, Campbell LA, Harvey BK, Avdoshina V, Mocchetti I. The orphan G‐protein‐coupled receptor 75 signaling is activated by the chemokine CCL5. J Neurochem. 2018;146(5):526‐539. [DOI] [PMC free article] [PubMed] [Google Scholar]
- 32. Somasundaram R, Herlyn D. Chemokines and the microenvironment in neuroectodermal tumor‐host interaction. Semin Cancer Biol. 2009;19(2):92‐96. [DOI] [PMC free article] [PubMed] [Google Scholar]
- 33. Mora J, Cruz O, Lavarino C, et al. Results of induction chemotherapy in children older than 18 months with stage‐4 neuroblastoma treated with an adaptive‐to‐response modified N7 protocol (mN7). Clin Transl Oncol. 2015;17(7):521‐529. [DOI] [PubMed] [Google Scholar]
- 34. Chinnaswamy G, Errington J, Foot A, Boddy AV, Veal GJ, Cole M. Pharmacokinetics of cyclophosphamide and its metabolites in paediatric patients receiving high‐dose myeloablative therapy. Eur J Cancer. 2011;47(10):1556‐1563. [DOI] [PubMed] [Google Scholar]
- 35. Pearson AD, Pinkerton CR, Lewis IJ, et al. High‐dose rapid and standard induction chemotherapy for patients aged over 1 year with stage 4 neuroblastoma: a randomised trial. Lancet Oncol. 2008;9(3):247‐256. [DOI] [PubMed] [Google Scholar]
- 36. Saylors RL, Stine KC, Sullivan J, et al. Cyclophosphamide plus topotecan in children with recurrent or refractory solid tumors: a Pediatric Oncology Group phase II study. J Clin Oncol. 2001;19(15):3463‐3469. [DOI] [PubMed] [Google Scholar]
- 37. Ashraf K, Shaikh F, Gibson P, Baruchel S, Irwin MS. Treatment with topotecan plus cyclophosphamide in children with first relapse of neuroblastoma. Pediatr Blood Cancer. 2013;60(10):1636‐1641. [DOI] [PubMed] [Google Scholar]
- 38. Kushner BH, Kramer K, Modak S, Qin LX, Cheung NK. Differential impact of high‐dose cyclophosphamide, topotecan, and vincristine in clinical subsets of patients with chemoresistant neuroblastoma. Cancer. 2010;116(12):3054‐3060. [DOI] [PubMed] [Google Scholar]
- 39. He X, Deng Y, Yue W. Investigating critical genes and gene interaction networks that mediate cyclophosphamide sensitivity in chronic myelogenous leukemia. Mol Med Rep. 2017;16(1):523‐532. [DOI] [PMC free article] [PubMed] [Google Scholar]
- 40. Taschner‐Mandl S, Schwarz M, Blaha J, et al. Metronomic topotecan impedes tumor growth of MYCN‐amplified neuroblastoma cells in vitro and in vivo by therapy induced senescence. Oncotarget. 2016;7(3):3571‐3586. [DOI] [PMC free article] [PubMed] [Google Scholar]
- 41. Gillet JP, Calcagno AM, Varma S, et al. Redefining the relevance of established cancer cell lines to the study of mechanisms of clinical anti‐cancer drug resistance. Proc Natl Acad Sci USA. 2011;108(46):18708‐18713. [DOI] [PMC free article] [PubMed] [Google Scholar]
- 42. Blumenthal RD, Goldenberg DM. Methods and goals for the use of in vitro and in vivo chemosensitivity testing. Mol Biotechnol. 2007;35(2):185‐197. [DOI] [PubMed] [Google Scholar]
- 43. Teicher BA. Tumor models for efficacy determination. Mol Cancer Ther. 2006;5(10):2435‐2443. [DOI] [PubMed] [Google Scholar]
- 44. Voskoglou‐Nomikos T, Pater JL, Seymour L. Clinical predictive value of the in vitro cell line, human xenograft, and mouse allograft preclinical cancer models. Clin Cancer Res. 2003;9(11):4227‐4239. [PubMed] [Google Scholar]
- 45. Walton JD, Kattan DR, Thomas SK, et al. Characteristics of stem cells from human neuroblastoma cell lines and in tumors. Neoplasia. 2004;6(6):838‐845. [DOI] [PMC free article] [PubMed] [Google Scholar]
- 46. Ross RA, Biedler JL, Spengler BA. A role for distinct cell types in determining malignancy in human neuroblastoma cell lines and tumors. Cancer Lett. 2003;197(1–2):35‐39. [DOI] [PubMed] [Google Scholar]
- 47. Ross RA, Spengler BA. Human neuroblastoma stem cells. Semin Cancer Biol. 2007;17(3):241‐247. [DOI] [PubMed] [Google Scholar]
- 48. Pelizzo G, Veschi V, Mantelli M, et al. Microenvironment in neuroblastoma: isolation and characterization of tumor‐derived mesenchymal stromal cells. BMC Cancer. 2018;18(1):1176. [DOI] [PMC free article] [PubMed] [Google Scholar]
- 49. van Nes J, Chan A, van Groningen T, van Sluis P, Koster J, Versteeg R. A NOTCH3 transcriptional module induces cell motility in neuroblastoma. Clin Cancer Res. 2013;19(13):3485‐3494. [DOI] [PubMed] [Google Scholar]
- 50. Ross RA, Spengler BA, Biedler JL. Coordinate morphological and biochemical interconversion of human neuroblastoma cells. J Natl Cancer Inst. 1983;71(4):741‐747. [PubMed] [Google Scholar]
- 51. van Groningen T, Akogul N, Westerhout EM, et al. A NOTCH feed‐forward loop drives reprogramming from adrenergic to mesenchymal state in neuroblastoma. Nat Commun. 2019;10(1):1530. [DOI] [PMC free article] [PubMed] [Google Scholar]
- 52. Szemes M, Greenhough A, Malik K. Wnt signaling is a major determinant of neuroblastoma cell lineages. Front Mol Neurosci. 2019;12:90. [DOI] [PMC free article] [PubMed] [Google Scholar]
- 53. Banerjee P, Dutta S, Pal R. Dysregulation of Wnt‐signaling and a candidate set of miRNAs underlie the effect of metformin on neural crest cell development. Stem Cells. 2016;34(2):334‐345. [DOI] [PubMed] [Google Scholar]
- 54. Leung AW, Murdoch B, Salem AF, Prasad MS, Gomez GA, García‐Castro MI. WNT/β‐catenin signaling mediates human neural crest induction via a pre‐neural border intermediate. Development. 2016;143(3):398‐410. [DOI] [PMC free article] [PubMed] [Google Scholar]
- 55. Chesler L, Goldenberg DD, Collins R, et al. Chemotherapy‐induced apoptosis in a transgenic model of neuroblastoma proceeds through p53 induction. Neoplasia. 2008;10(11):1268‐1274. [DOI] [PMC free article] [PubMed] [Google Scholar]
- 56. Bosse KR, Maris JM. Advances in the translational genomics of neuroblastoma: from improving risk stratification and revealing novel biology to identifying actionable genomic alterations. Cancer. 2016;122(1):20‐33. [DOI] [PMC free article] [PubMed] [Google Scholar]
- 57. Worst BC, van Tilburg CM, Balasubramanian GP, et al. Next‐generation personalised medicine for high‐risk paediatric cancer patients ‐ The INFORM pilot study. Eur J Cancer. 2016;65:91‐101. [DOI] [PubMed] [Google Scholar]
- 58. Pincez T, Clément N, Lapouble E, et al. Feasibility and clinical integration of molecular profiling for target identification in pediatric solid tumors. Pediatr Blood Cancer. 2017;64(6):e26365. [DOI] [PubMed] [Google Scholar]
- 59. Saulnier Sholler GL, Bond JP, Bergendahl G, et al. Feasibility of implementing molecular‐guided therapy for the treatment of patients with relapsed or refractory neuroblastoma. Cancer Med. 2015;4(6):871‐886. [DOI] [PMC free article] [PubMed] [Google Scholar]
- 60. Liedtke C, Wang J, Tordai A, et al. Clinical evaluation of chemotherapy response predictors developed from breast cancer cell lines. Breast Cancer Res Treat. 2010;121(2):301‐309. [DOI] [PubMed] [Google Scholar]
- 61. Lee JY, Kim SY, Park C, et al. Patient‐derived cell models as preclinical tools for genome‐directed targeted therapy. Oncotarget. 2015;6(28):25619‐25630. [DOI] [PMC free article] [PubMed] [Google Scholar]
- 62. Braekeveldt N, von Stedingk K, Fransson S, et al. Patient‐derived xenograft models reveal intratumor heterogeneity and temporal stability in neuroblastoma. Cancer Res. 2018;78(20):5958‐5969. [DOI] [PubMed] [Google Scholar]
- 63. Stewart E, Shelat A, Bradley C, et al. Development and characterization of a human orthotopic neuroblastoma xenograft. Dev Biol. 2015;407(2):344‐355. [DOI] [PMC free article] [PubMed] [Google Scholar]
- 64. Schramm A, Köster J, Assenov Y, et al. Mutational dynamics between primary and relapse neuroblastomas. Nat Genet. 2015;47(8):872‐877. [DOI] [PubMed] [Google Scholar]
- 65. Schulte M, Köster J, Rahmann S, Schramm A. Cancer evolution, mutations, and clonal selection in relapse neuroblastoma. Cell Tissue Res. 2018;372(2):263‐268. [DOI] [PubMed] [Google Scholar]
- 66. Sharma A, Cao EY, Kumar V, et al. Longitudinal single‐cell RNA sequencing of patient‐derived primary cells reveals drug‐induced infidelity in stem cell hierarchy. Nat Commun. 2018;9(1):4931. [DOI] [PMC free article] [PubMed] [Google Scholar]
- 67. Ben‐David U, Ha G, Tseng YY, et al. Patient‐derived xenografts undergo mouse‐specific tumor evolution. Nat Genet. 2017;49(11):1567‐1575. [DOI] [PMC free article] [PubMed] [Google Scholar]
- 68. Lee SH, Hu W, Matulay JT, et al. Tumor evolution and drug response in patient‐derived organoid models of bladder cancer. Cell. 2018;173(2):515‐528.e517. [DOI] [PMC free article] [PubMed] [Google Scholar]
Associated Data
This section collects any data citations, data availability statements, or supplementary materials included in this article.
Supplementary Materials
Figure S1
Figure S2
Figure S3
Figure S4
Figure S5
Figure S6
Table S1
Table S2
Table S3
Data S1
Data S2
Data S3