Abstract
The pioneering work from Lieping Chen’s laboratory identified Siglec‐15 as a novel tumor immune suppressor, while the regulatory mechanisms underlying the broad upregulation of Siglec‐15 in human cancers remain obscure. Here we found that long non–coding RNA (lncRNA) LINC00973 was higher in Siglec‐15‐positive clear‐cell renal cell carcinoma (ccRCC), and LINC00973 positively regulated Siglec‐15 expression at transcriptional level. This effect was evidently dependent on miR‐7109‐3p (designated as miR‐7109 hereafter), and we provided evidence that Siglec‐15 is a direct target of miR‐7109. Through sponging miR‐7109, LINC00973 functioned as competing endogenous RNA (ceRNA) to control cell surface abundance of Siglec‐15, and, consequently, was involved in cancer immune suppression. We further demonstrated that LINC00973 and miR‐7109 expression in ccRCC antagonistically influenced immune activation of co–cultured Jurkat cells. Our study highlighted the importance of LINC00973‐miR‐7109‐Siglec‐15 in immune evasion in ccRCC, which offers significant opportunity for both therapeutic intervention and diagnostic/prognostic exploitations.
Keywords: clear‐cell renal cell carcinoma, competing endogenous RNA, LINC00973, miR‐7109‐3p, Siglec‐15
Through sponging miR‐7109, LINC00973 functioned as competing endogenous RNA (ceRNA) to control cell surface abundance of Siglec‐15, and, consequently, was involved in cancer immune suppression. LINC00973 and miR‐7109 expression in ccRCC antagonistically influenced immune activation of co–cultured Jurkat cells.

1. INTRODUCTION
Immunotherapy, especially immune checkpoint blockade, has achieved unprecedent success in the clinical management of multiple forms of human cancer, 1 , 2 which has highlighted the critical importance of understanding molecular mechanisms underlying local immunosuppressive microenvironment formation. 3 It is increasingly acknowledged that immune evasion of tumor cells could be attributed to numerous distinct but cooperative mechanisms, including deficiency in immune cell infiltration, and expansion of regulatory T cells, tumor‐associated macrophages, and myeloid‐derived suppressive cells. 4 , 5 More fundamentally, several upregulated immunosuppressive and downregulated immunostimulatory molecules have been identified in immune evasion of tumor cells, some of which have been targeted for therapeutic purposes. For example, programmed death‐ligand 1 (PD‐L1) was selectively and predominantly induced by interferon‐gamma derived from T‐lymphocytes in the tumor microenvironment, and blockaded immune responses locally via interaction with programmed death‐1 (PD‐1) molecules on T cells. 6 , 7 Antibodies against the PD‐1‐PD‐L1 axis have been approved for multiple tumor types and are under evaluation in hundreds of clinical trials worldwide. 8 , 9 , 10 However, based on the recent definition in tumor immunity classification, dysregulated PD‐1‐PD‐L1 signaling accounted for impairment of normal immunity in less than 40% of solid tumors, 11 which motivated the endeavors to identify other potential immunosuppressive molecules.
The pioneering study by Wang et al (2019) 12 identified Siglec‐15 as a critical immune suppressor, which is commonly high in human cancer cells and intratumoral myeloid cells. Notably, high expression of Siglec‐15 appeared mutually exclusive to PD‐L1 upregulation, making it a perfect candidate target for immunotherapy in some PD‐L1‐negative cancer patients. The authors further demonstrated that both genetic knockout and antibody‐based blockade of Siglec‐15 significantly amplified local anti–tumor immune responses and inhibited tumor progression in a mice model. Most importantly, encouraging efficacy was reported in a phase I trial of NC318, a Siglec‐15 antibody, with complete responses in non–small cell lung cancer patients refractory to PD‐1 blockade (NCT03665285). However, as an emerging hot topic of research and therapeutic exploitation, the molecular mechanisms underlying Siglec‐15 expression and regulation remain largely elusive.
Siglec‐15 was first identified as immune system sialic acid binding Ig like lectin (Siglec) with high conservation in vertebrate. 13 Here, we focus on understanding the molecular mechanisms underlying the aberrantly high expression of Siglec‐15 in clear‐cell renal cell carcinoma (ccRCC). We found that long non–coding RNA (lncRNA) LINC00973 positively correlated with Siglec‐15 in both our clinical samples collection and kidney renal clear cell carcinoma (KIRC) in The Cancer Genome Atlas (TCGA) database. We also demonstrated that LINC00973 functioned as competing endogenous RNA (ceRNA) against miR‐7109‐3p (designated as miR‐7109 hereafter), which was consequently involved in Siglec‐15 regulation and tumor immune suppression.
2. MATERIALS AND METHODS
2.1. Clear‐cell renal cell carcinoma patients and tissues
A total of 100 ccRCC patients were enrolled in this study in Longgang District People’s Hospital of Shenzhen from 2005 to 2018. All participants were naïve to prior chemotherapy or radiotherapy. The clinicopathological characteristics are summarized in Table 1. Written informed consent was obtained from all enrolled patients. This study was approved by the Ethics Committee of Longgang District People’s Hospital of Shenzhen (reference number: LG2019KY‐002) and conducted in accordance with the Declaration of Helsinki.
TABLE 1.
Correlation between the clinicopathological features and LINC00973 level
| Variable | Number of cases | LINC00973 | ||
|---|---|---|---|---|
| High | Low | P‐value | ||
| 100 | 62 | 38 | ||
| Age (y) | ||||
| <60 | 48 | 32 | 16 | 0.4125 |
| >60 | 52 | 30 | 22 | |
| Gender | ||||
| Male | 65 | 42 | 23 | 0.5202 |
| Female | 35 | 20 | 15 | |
| Tumor size | ||||
| <4 cm | 35 | 18 | 21 | 0.0116* |
| ≥4 cm | 65 | 44 | 17 | |
| Tumor stage | ||||
| T1, T2 | 59 | 23 | 23 | 0.0252* |
| T3, T4 | 41 | 39 | 15 | |
| Lymphatic metastasis | ||||
| Negative | 46 | 24 | 24 | 0.0234* |
| Positive | 54 | 38 | 14 | |
Denotes significance
2.2. Cell culture
Eight human ccRCC cell lines (786‐0, 769‐p, A704, A498, ACNH, Caki‐1, Caki‐2, and RCC4) and an immortalized kidney proximal tubule epithelial cell line HK‐2 were obtained from the ATCC. Cell identities were authenticated by Sun Yat‐sen University with short tandem repeats profiling. All cells were maintained in RPMI modified medium containing 10% FBS and 1% penicillin/streptomycin (Hyclone).
All constructs including shRNA targeting LINC00973 and Siglec‐15 along with scramble control were obtained from GenePharma. The pcDNA 3.1 vector for Siglec‐15 overexpression and pLncEXP for LINC00973 expression were ordered from Synbio‐Tech. The oligonucleotides used in this study, including miR‐7109 mimic, miR‐7109‐specific inhibitor, and scramble control, were purchased from RiboBio. Cell transfection was performed with Lipofectamine 2000.
2.3. Real‐time PCR
For LINC00973 and Siglec‐15 quantitation, total RNA was extracted using TRIzol (Invitrogen) and reverse‐transcribed into cDNA with a High‐Capacity cDNA Reverse Transcription Kit (ThermoFisher). Quantitation was performed with PowerUp SYBR Green Master Mix (Applied Biosystems). For miR‐7109 quantitation, an All‐in‐One miRNA qRT‐PCR Detection Kit (GeneCopoeia) was used and U6 served as endogenous control. A real‐time PCR assay was conducted using the CFX96 Touch PCR Detection System (Bio‐Rad) and relative expression was calculated using the 2−∆∆ Ct method. The primer sequences were as follows: LINC00973 forward 5′‐CAGCTGTGTTACTCCTTCGC‐3′, reverse 5′‐AGCCAGAGATCAGGGTTGAC‐3′; Siglec‐15 forward 5′‐GTCACGGCCACCTAGTGA‐3′, reverse 5′‐TGGAAGCGGAACAGGTAGAC‐3′; GAPDH forward 5′‐GGAGCGAGATCCCTCCAAAAT‐3′, reverse 5′‐GGCTGTTGTCATACTTCTCATGG‐3′.
2.4. Immunofluorescence
A498 cells (control, LINC00973, miR‐7109 mimic, miR‐7109 inhibitor alone, or in combination, as indicated in figure legends) were plated on cover slips and allowed to attach overnight. Cells were then fixed with 4% PFA for 10 minutes and permeabilized with 0.3% Triton X‐100 for 15 minutes. The cells were incubated with anti–Siglec‐15 antibody (PA5‐50759, ThermoFisher) at 4°C overnight after brief blocking with 5% BSA, followed by probing with fluorescent secondary antibody (anti–rabbit 488, ThermoFisher). The coverslips were finally assembled on glass slides and mounted with ProLong Gold Antifade Mountant with DAPI (ThermoFisher). The images were captured under a confocal microscope (Leica).
2.5. Flow cytometry
The indicted cells were prepared into single‐cell suspension in staining buffer (2% BSA in PBS) and the concentration was adjusted to 106 cells/100 μL. Each aliquot was incubated with anti–Siglec‐15 antibody (NBP2‐41162, Novus Biologicals) at 4°C in the dark for 20 minutes. After washing, cells were incubated with PE‐labeled anti–rabbit secondary antibody (ThermoFisher) on ice in the dark for 30 minutes. Cell suspension was then washed and analyzed with Gallios flow cytometry (Beckman Coulter).
2.6. Immunohistochemistry
Human kidney tumor tissues were prepared into 5‐μm sections and mounted on glass slides. The immunohistochemistry (IHC) procedure was performed using the Biotin‐Streptavidin HRP Detection System (ZSGB‐BIO) following the manufacturer’s protocol and signals were detected by diaminobenzidine development. Representative images were acquired using a DMi8 Inverted Microscope (Leica).
2.7. Western blots analysis
Cells lysates were prepared in ice‐cold RIPA buffer supplemented with proteinase inhibitor cocktail (Roche) for 30 minutes and cell debris was discarded after centrifugation. Samples were resolved by 12% SDS‐PAGE and transferred onto PVDF membrane (Millipore). Membrane was blocked with 5% skim milk and probed with primary antibodies (rabbit anti–Siglec‐15, PA5‐50759, ThermoFisher; mouse anti–GAPDH, sc‐32233) at 4°C overnight. After incubation with specific secondary antibodies (goat anti–rabbit, 7074 and horse anti–mouse, 7076 from Cell Signaling Technology) for another hour at room temperature, the blots were visualized using enhanced chemiluminescence reagent (ECL, Millipore).
2.8. RNA pulldown
The pLncEXP‐LINC00973 plasmids (wild‐type or mutant) were linearized, transcribed, and biotin‐labeled in vitro with T7 RNA polymerase and biotin RNA labeling mix (MEGAscript T7 transcription Kit, ThermoFisher). RNA probes were recovered using an RNeasy Mini Kit (Qiagen). The biotin‐labeled miR‐7109 and scramble control were synthesized by Synbio Technologies. The nuclear extracts from indicated cells were incubated with LINC00973 probes at 4°C for 1 hour, and interacting RNA species were isolated with streptavidin magnetic beads. The relative enrichment of miR‐7109 and LINC00973 transcript was determined by real‐time PCR as described previously.
2.9. Luciferase assays
The Siglec‐15 promoter, LINC00973 reporter plasmids, and parallel reference secreted alkaline phosphatase‐driven Gaussia luciferase plasmid were obtained from GeneCopoeia (Guangzhou, China). The point‐directed mutations were generated by mutagenesis PCR method. Siglec‐15 promoter reporter or LINC00973‐fused luciferase (wild‐type or putative miR‐7109‐recognizing site mutant) plasmids were co–transfected with scramble control, miR‐7109 mimic, or miR‐7109 inhibitor into HEK293T for 24 hours. The culture medium was collected for luciferase activity measurement with the Secrete‐Pair Luminescence Assay Kit (GeneCopoeia) following the manufacturer’s instructions.
2.10. Interleukin‐2/tumor necrosis factor‐α production assay
The Jurkat/cancer cell co–culture system was adopted to monitor immune cell activation in response to Siglec‐15 expression. Jurkat cells were transduced with MART‐I‐specific 1D3 T cell receptor (TCR). The indicated ccRCC cells were pre–loaded with MART‐I peptides (10 ng/mL) at 37°C for 1 hour. Co–culture incubation was performed at a ratio of 2:1 (Jurkat: ccRCC cells) at 37°C. The antibody blocking assay was performed with 20 μg/mL Siglec‐15 antibody (ThermoFisher). The secretory interleukin‐2 (IL‐2) and tumor necrosis factor‐α (TNF‐α) were determined 48 and 72 hours later with the IL‐2 Human ELISA Kit and the TNF alpha Human ELISA Kit (Invitrogen), following the manufacturer’s instructions.
2.11. Statistical analysis
Data processing and analysis were performed with GraphPad Prism 7.0. The unpaired, two‐tailed Student’s t‐test was used for statistical comparison, and P < 0.05 was considered statistically significantly different.
3. RESULTS
3.1. Upregulation of LINC00973 in clear‐cell renal cell carcinoma
First, we analyzed the relative expression of LINC00973 in ccRCC tumor samples, and our results showed significant upregulation of LINC00973 in tumor tissues in comparison with adjacent normal controls (Figure 1A), which suggested potentially pro–tumoral properties of this lncRNA in kidney cancers. We then equally divided all patients into LINC00973‐high and LINC00973‐low groups and compared overall survival. The Kaplan‐Meier survival curve showed remarkably unfavorable outcomes associated with higher LINC00973 (Figure 1B). By data‐mining the publicly available TCGA database, we uncovered an evident linkage between high LINC00973 and advanced tumor stages in KIRC (Figure 1C). Similar results in respect to overall survival were observed in the KIRC group as well (Figure 1D), which indicated the prognostic value of LINC00973 in this disease. High LINC00973 was significantly linked to tumor progression (P = 0.0116), clinical stage (P = 0.0252), and lymphatic metastasis (P = 0.0234, Table 1) in our ccRCC collection. Quantification of the panel of ccRCC cell lines revealed consistent upregulation of LINC00973 compared to the immortalized normal kidney proximal tubule epithelial cell line, HK‐2 (Figure 1E). Notably, based on fractionized quantitative PCR, we demonstrated that the majority of LINC00973 transcripts were located in cytosol in both 769‐p and Caki‐1 cells (Figure 1F), suggesting that LINC00973 exerted pathophysiologic roles mainly outside nuclear.
FIGURE 1.
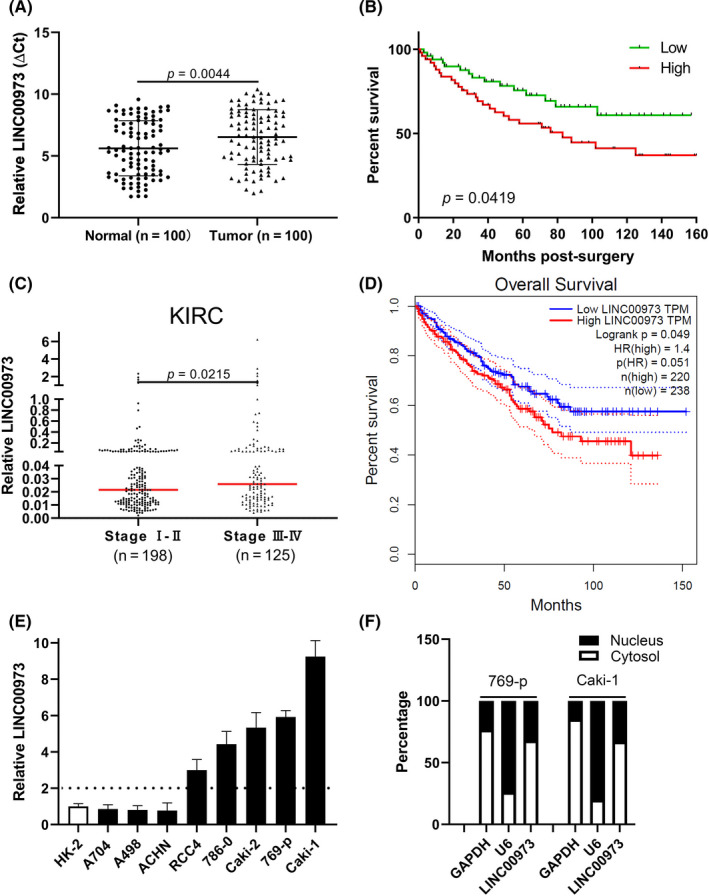
High expression of LINC00973 in clear‐cell renal cell carcinoma (ccRCC). A, Real‐time PCR analysis of relative expression of LINC00973 in ccRCC tumor tissues and paired adjacent normal tissues. B, Kaplan‐Meier survival curve of ccRCC patients with either high or low level of LINC00973. C, Correlation analysis of relative LINC00973 level with tumor stage of ccRCC patients (KIRC) in the publicly available TCGA database. D, Overall survival analysis of KIRC dataset in respect to LINC00973 levels with Gepia (http://gepia.cancer‐pku.cn/). E, Quantitative PCR analysis of relative expression of LINC00973 in panel of ccRCC cell lines including 769‐p, Caki‐1, Caki‐2, A498, A704, ACHN, RCC4, and 786‐0. F, Subcellular localization of LINC00973 was determined by fractionization analysis with GAPDH as a cytosol marker and U6 as a nucleus marker, respectively
3.2. LINC00973 upregulated Siglec‐15 in clear‐cell renal cell carcinoma cells
Next, we sought to understand the mechanistic contributions of the aberrant LINC00973 level to ccRCC at molecular level. We noticed that a novel immune suppressor, Siglec‐15, positively correlated with LINC00973 in ccRCC tumor samples, and significantly high abundance of LINC00973 was detected in Siglec‐15‐positive cases (Figure 2A). The representative IHC staining results of endogenous Siglec‐15 protein are presented in Figure 2B. We then retrieved expression data for both LINC00973 and Siglec‐15 in kidney cell lines curated in TCGA database. Relative expression of LINC00973 and Siglec‐15 was significantly and positively correlated in 34 available cell lines (Figure 2C). The correlation was confirmed in our ccRCC sample collection as well (Figure 2D). To further clarify the potential regulatory relation between LINC00973 and Siglec‐15, we specifically established LINC00973‐knockdown cell lines in both 769‐p and Caki‐1 (Figure 2E), and LINC00973‐overexpression cell lines in A704 and A498 cells (Figure 2F). Quantitative analysis showed notable downregulation of endogenous Siglec‐15 in LINC00973‐deficient cells and upregulation in LINC00973‐proficient cells (Figure 2G, H). The positive regulation of LINC00973 in Siglec‐15 was further confirmed at protein level by western blot analysis (Figure 2I). The cell surface Siglec‐15 was then analyzed with flow cytometry. Signals were tremendously compromised in LINC00973‐silenced 769‐p and Caki‐1 cells (Figure 2J,K) while intensified in LINC00973‐overexpressed A704 and A498 cells (Figure 2L,M). Again, we determined Siglec‐15 abundance on A498 cell surface with cell immunofluorescence, and a consistent increase of Siglec‐15 was noticed in LINC00973‐overexpressing cells in comparison with empty vector control (Figure 2N). Therefore, our data unambiguously showed that LINC00973 positively regulated Siglec‐15 expression at transcript levels in ccRCC.
FIGURE 2.
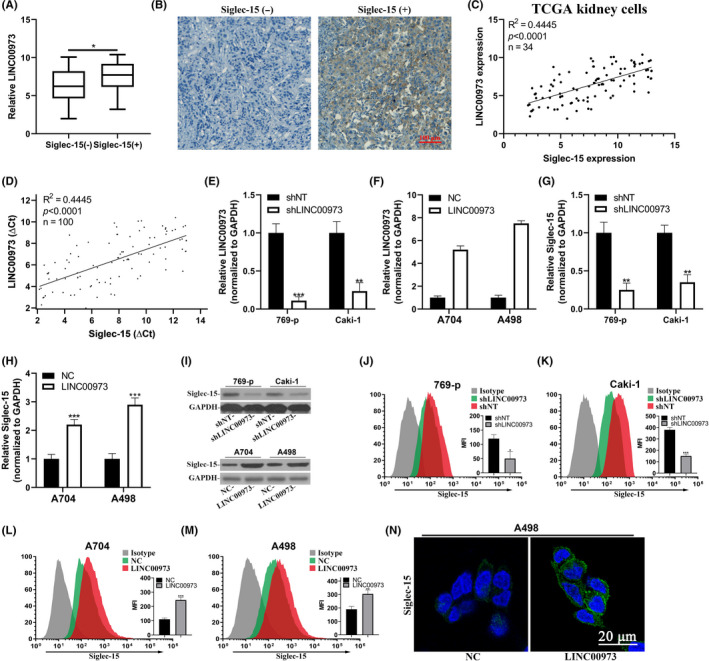
LINC00973 upregulated Siglec‐15 in clear‐cell renal cell carcinoma (ccRCC) cells. (A) Comparison of LINC00973 abundance in Siglec‐15 negative and positive ccRCC tumors. (B) Representative images of Siglec‐15 immunohistochemistry (IHC) staining results. (C) Correlation analysis of endogenous LINC00973 and Siglec‐15 expression in publicly available TCGA kidney cells (n = 34). (D) Correlation analysis of LINC00973 and Siglec‐15 in clinical ccRCC tumor samples (n = 100). (E) Establishment of LINC00973‐knockdown cell lines in 769‐p and Caki‐1 cells was validated by real‐time PCR. (F) Establishment of LINC00973‐overexpressing cell lines in A704 and A498 cells was validated by real‐time PCR. (G) Relative expression of Siglec‐15 transcripts in LINC00973‐deficient 769‐p and Caki‐1 cells. (H). Relative expression of Siglec‐15 transcripts in LINC00973‐proficient A704 and A498 cells. (I) Western blot analysis of Siglec‐15 protein in LINC00973 knockdown or overexpressing cells. Flow cytometry analysis of cell surface Siglec‐15 abundance in response to LINC00973 knockdown in 769‐p (J) and Caki‐1 (K) cells, and LINC00973‐overexpressing in A704 (L) and A498 (M). N. Immunofluorescence staining of cell surface Siglec‐15 of A498 in response to either control (NC) or LINC00973 overexpression
3.3. LINC00973‐upregulated Siglec‐15 was dependent on miR‐7109
The mode of action as a ceRNA against miR has been increasingly acknowledged as a major pathophysiologic role of lncRNA. 14 , 15 Next, we attempted to elucidate molecular mechanisms underlying the regulation of Siglec‐15 by LINC00973 and identified miR‐7109 as a potential candidate through close inspection of both LINC00973 transcript and 3ʹUTR of Siglec‐15. Therefore, we specifically inhibited miR‐7109 in the context of LINC00973 deficiency or overexpressed miR‐7109 mimic in the context of LINC00973 proficiency in ccRCC cells. As shown in Figure 3A,B, employment of miR‐7109 inhibitor efficiently decreased miR‐7109 in LINC00973‐silenced 769‐p and Caki‐1 cells, and miR‐7109 mimic potently increased miR‐7109 in LINC00973‐overexpressing A704 and A498 cells. Notably, we found that the inhibited expression of Siglec‐15 by LINC00973 depletion was significantly restored by co–transfection with miR‐7109 inhibitor in both 769‐p and Caki‐1 cells (Figure 3C). Consistently, the stimulated upregulation of Siglec‐15 by LINC00973 overexpression in A704 and A498 cells was reversed by co–introduction of miR‐7109 mimics (Figure 3D). The alterations of Siglec‐15 transcript in response to the combination of LINC00973 and miR‐7109 were further consolidated at protein level by western blot analysis (Figure 3E). Direct staining with fluorescent affinity antibody showed that cell surface Siglec‐15 induced by LINC00973 was dramatically decreased by miR‐7109 mimics (Figure 3F). Consistently, flow cytometry analysis exhibited a significant increase in the response to the combination of LINC00973 knockdown and miR‐7109 inhibitor, and an evident decrease in the response to the combination of LINC00976 overexpression and miR‐7109 mimics (Figure 3G, H). Taken together, our results clearly demonstrated that miR‐7109 played important roles in regulating Siglec‐15 expression downstream of LINC00973 in ccRCC cells.
FIGURE 3.
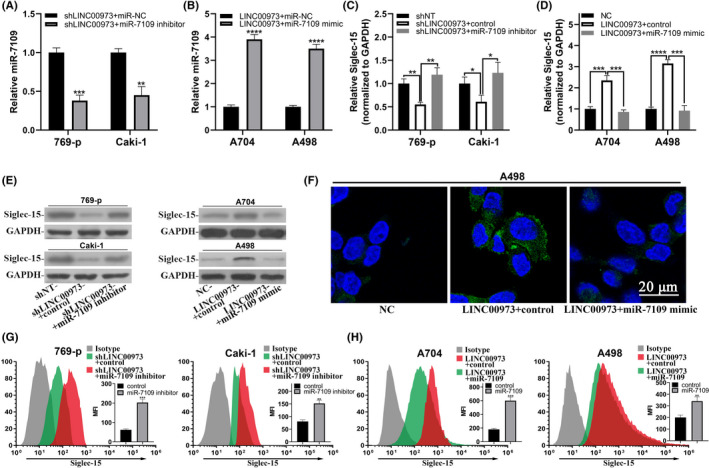
LINC00973‐upregulated Siglec‐15 was dependent on miR‐7109. (A) Real‐time PCR analysis of endogenous miR‐7109 in LINC00973‐deficient 769‐p and Caki‐1 cells in response to either negative control or miR‐7109 inhibitor. (B) Real‐time PCR analysis of endogenous miR‐7109 in LINC00973‐proficient A704 and A498 cells in response to either control or miR‐7901 mimic. (C) Quantitative analysis of Siglec‐15 transcript in LINC00973 intact or depleted 769‐p and Caki‐1 cells treated with control or miR‐7109 inhibitor. (D) Quantitative analysis of Siglec‐15 transcript in LINC00973 naïve or overexpressing A704 and A498 cells treated with control or miR‐7109 mimics. (E) Western blot results of Siglec‐15 protein in the cells as described in C and D. (F) Immunofluorescence staining of cell surface Siglec‐15 in A498 cells expressing either naïve or ectopic LINC00973, and transfected with either control or miR‐7109 mimics. (G, H) Flow cytometry analysis of cell surface abundance of Siglec‐15 in cells as specified in panel E
3.4. Siglec‐15 was a direct target of miR‐7109 in clear‐cell renal cell carcinoma
Next, we sought to clarify whether miR‐7109 directly targeted and regulated Siglec‐15 in ccRCC. We first analyzed miR‐7109 in clinical ccRCC samples and found that miR‐7109 was significantly decreased in tumors in comparison with paired adjacent normal tissues (Figure 4A, n = 100). Strong and negative correlation between miR‐7109 and Siglec‐15 was noticed in our sample collection (Figure 4B). We then directly silenced miR‐7109 through employment of miR‐7109 inhibitor in A704 and A498 cells, and forced overexpression of miR‐7109 via transfection with miR‐7109 mimic in 769‐p and Caki‐1 cells, respectively (Figure 4C,D). The endogenous Siglec‐15 was induced in both A704 and A498 cells by miR‐7109 inhibition (Figure 4E) and suppressed in both 769‐p and Caki‐1 cells by introduction of miR‐7109 mimic (Figure 4F). Consistent changes were also observed at protein level, as indicated by western blot analysis (Figure 4G). The slight but significant increase of cell surface Siglec‐15 in response to miR‐7109 inhibitor in both A704 and A498 cells (Figure 4H) resembled the results acquired for LINC00973‐proficient cells, as shown in Figure 2L,M. In contrast, ectopic introduction of miR‐7109 alone was sufficient to inhibit cell surface Siglec‐15 in both 769‐p and Caki‐1 cells (Figure 4I), which was akin to the scenarios wherein LINC00973 was silenced by specific shRNA in Figure 2J,K. We further consolidated our observations with cell immunofluorescence, and remarkable increase of Siglec‐15 staining intensity was detected in A498 cells transfected with miR‐7109 inhibitor (Figure 4J). These data suggested that miR‐7109 was capable of regulating Siglec‐15 expression irrespective of LINC00973 expression status. Close inspection of 3ʹUTR of Siglec‐15 revealed a potential miR‐7109‐binding site, based on which we constructed luciferase reporter plasmids with either intact or mutated 3ʹUTR of Siglec‐15 (Figure 4K). Co–transfection with miR‐7109 mimic into 293T cells inhibited while miR‐7109 inhibitor stimulated the luciferase activities of wild‐type reporter (Figure 4L, left). However, the regulatory effects of miR‐7109 on Siglec‐15 were completely abolished by mutation introduced into putative binding sites on 3ʹUTR of Siglec‐15 (Figure 4L, right). Our results provided evidence of the direct and negative regulation of Siglec‐15 by miR‐7109 in ccRCC.
FIGURE 4.
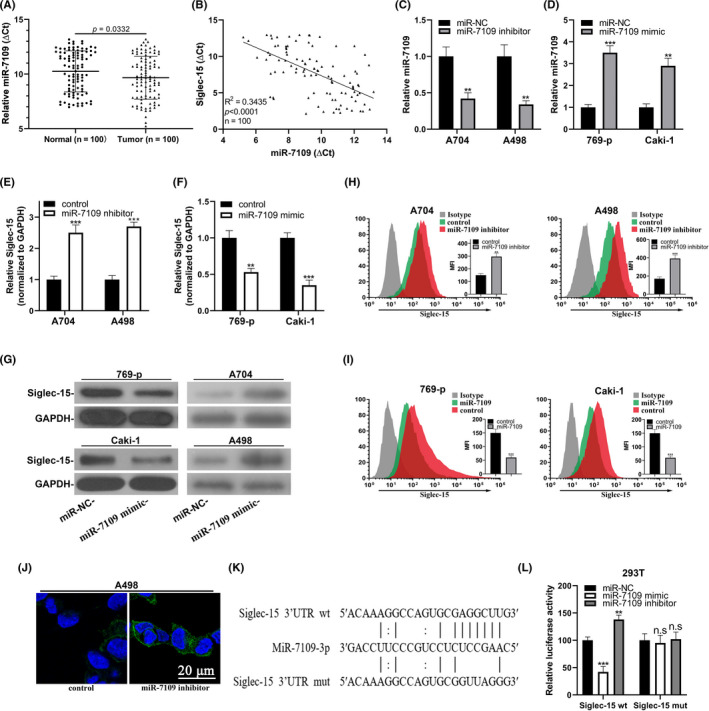
Siglec‐15 was a direct target of miR‐7109 in clear‐cell renal cell carcinoma (ccRCC). (A) Real‐time PCR analysis of miR‐7109 expression in ccRCC tumor samples with paired adjacent normal tissues. (B) Correlation analysis between miR‐7109 and Siglec‐15 in ccRCC tissue samples (n = 100). (C) Change of miR‐7109 expression in both A704 and A498 cells in response to miR‐7109 inhibitor. (D) Change of miR‐7109 expression in both 769‐p and Caki‐1 cells in response to miR‐7109 mimic. (E) Endogenous Siglec‐15 transcripts were quantified in both A704 and A498 cells transfected with either control or miR‐7109 inhibitor. (F) Endogenous Siglec‐15 transcripts were quantified in both 769‐p and Caki‐1 cells transfected with either control or miR‐7109 mimics. (G) Western blot analysis of Siglec‐15 proteins in the same cells as in panel E and F. (H) Flow cytometry analysis of cell surface Siglec‐15 abundance in A704 and A498 cells in response to miR‐7109 inhibitor. (I) Flow cytometry analysis of cell surface Siglec‐15 abundance in 769‐p and Caki‐1 cells in response to miR‐7109 mimics. (J) Immunofluorescence staining of cell surface Siglec‐15 in A498 cells transfected with either control or miR‐7109 inhibitor. (K) Alignment between miR‐7109 seed region and both wild‐type and putative binding site‐mutated Siglec‐15 3ʹUTR. (L) Luciferase reporter analysis of the potential regulatory effects of miR‐7109 on Siglec‐15 in 293T cells, which were transfected with control, miR‐7109 mimics, and miR‐7109 inhibitors, respectively
3.5. LINC00973 functioned as ceRNA against miR‐7109 in clear‐cell renal cell carcinoma
To clarify the possible competitive relation between miR‐7109 and LINC00973 in the regulation of Siglec‐15, we first analyzed the reciprocal regulation of these two RNA molecules in ccRCC. As demonstrated in Figure 5A,B, endogenous miR‐7109 was greatly upregulated in LINC00973‐silenced 769‐p and Caki‐1 cells while downregulated by ectopic overexpression of LINC00973 in both A704 and A498 cells. The direct association between miR‐7109 and LINC00973 was exhibited by biotin‐labeled RNA‐pulldown assay, wherein there was significant enrichment of miR‐7109 in RNA species recovered from wild‐type rather than mutant LINC00973 probes in both cell lines (Figure 5C). Likewise, pre–incubation of nuclear extracts with miR‐7109 inhibitor completely abolished the association between miR‐7109 and LINC00973 as well. In contrast, relative expression of LINC00973 was induced by transfection of miR‐7109 inhibitor in both A704 and A498 cells (Figure 5D), and suppressed by introduction of miR‐7109 mimic in both 69‐p and Caki‐1 cells (Figure 5E). In line with results of LINC00973‐probed pulldown assay, we showed tremendous enrichment of LINC00973 transcript in miR‐7109‐mediated pulldown complex as well in both 769‐p and Caki‐1 cells (Figure 5F). Supplementation with miR‐7109 competitor in nuclear extracts significantly suppressed the interaction between LINC00973 and miR‐7109. The reciprocal RNA‐pulldown results provided solid evidence of the direct interaction between LINC00973 and miR‐7109, which was eventually involved in Siglec‐15 regulation in ccRCC. Furthermore, downregulated miR‐7109 appeared to be negatively correlated with high LINC00973 in our clinical ccRCC samples (Figure 5G). We also used a luciferase reporter assay to investigate the regulatory effects of miR‐7109 on LINC00973. Alignment between miR‐7109 and the putative binding region of LINC00973 is illustrated in Figure 5H. Co–transfection with miR‐7109 mimic significantly inhibited the reporter activities of wild‐type LINC00973, while miR‐7109 inhibitor exerted stimulatory effects (Figure 5I, left). This regulatory effect was completely abrogated by mutation introduced into the putative binding site. Therefore, our results suggested that LINC00973 functioned as ceRNA against miR‐7109, which was jointly involved in Siglec‐15 regulation at transcript level.
FIGURE 5.
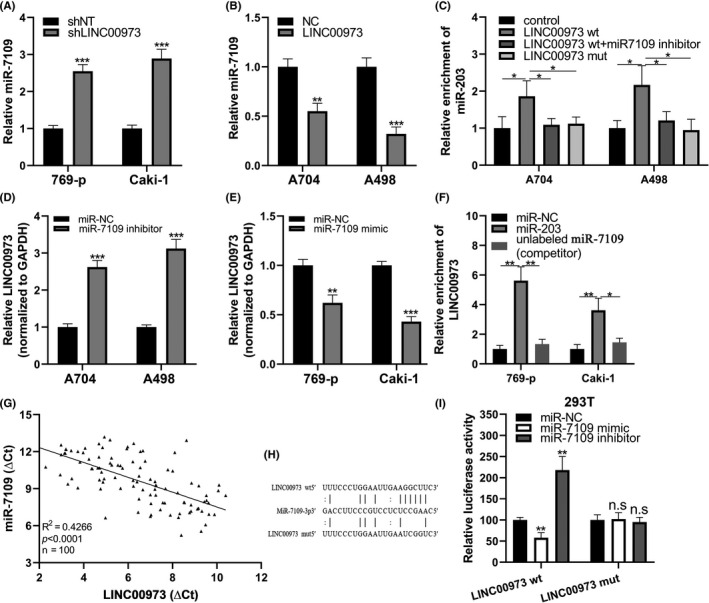
LINC00973 functioned as ceRNA against miR‐7109 in clear‐cell renal cell carcinoma (ccRCC). (A) Relative expression of miR‐7109 in both 769‐p and Caki‐1 cells transfected with either negative control or LINC00973‐specific shRNA. (B) Relative expression of miR‐7109 in both A704 and A498 cells transfected with either control or LINC00973‐expressing plasmids. (C) RNA‐pulldown results in both A704 and A498 cells with control, wild‐type LINC0973 fragment, or corresponding mutant, respectively. (D) Relative expression of LINC00973 in both A704 and A498 cells transfected with either negative control or miR‐7109 inhibitors. (E) Relative expression of LINC00973 in both 769‐p and Caki‐1 cells transfected with either control or miR‐7109 mimics. (F) RNA‐pulldown results in both 769‐p and Caki‐1 cells with either control or miR‐7109. (G) Reverse correlation analysis between endogenous miR‐7109 and LINC00973 in ccRCC tumor samples (n = 100). (H) Illustration of aligned miR‐7109 with both wild‐type and mutated LINC00973. (I) Luciferase reporter results in 293T cells co–transfected with LINC00973 (wt and mut) and miR‐NC, miR‐7109 mimic, and miR‐7109 inhibitor, respectively
3.6. LINC00973‐miR‐7109‐Siglec‐15 axis involved in immune activations in clear‐cell renal cell carcinoma cells
We then sought to address the influences of LINC00973 and, therefore, Siglec‐15 on immune response in ccRCC. We established Siglec‐15 overexpression and knockdown cell lines derived from A704, A498, 769‐p, and Caki‐1, respectively (Figure 6A‐C), and confirmed the immune suppressive effects of Siglec‐15 by examining IL‐2 production in the Jurkat ccRCC cell co–culture system. The specificity of effector T cells was established by transfection of Jurkat cells with MART‐I‐specific 1D3 TCR, which potently recognized MART‐I peptides with pre–loaded ccRCC cells. IL‐2 secreted by Jurkat cells was significantly decreased in response to Siglec‐15 overexpression in A704 and A498 cells (Figure 6D). In contrast, Siglec‐15 knockdown augmented IL‐2 production in co–culture medium (Figure 6E). These results were in agreement with a previous report 12 and testified our system to monitor immune activation in vitro. Notably, co–transfection of LINC00973 with control miR significantly inhibited IL‐2 production, which was readily reversed by simultaneous transfection with miR‐7109 mimics (Figure 6F). In contrast, IL‐2 production was significantly stimulated by co–transfection with both shLINC00973 and control miR in 769‐p and Caki‐1 cells, and inhibited by the introduction of miR‐7109 inhibitor (Figure 6G). Our results unambiguously showed that LINC00973‐miR‐7109 was involved in immune suppression in ccRCC through regulation of Siglec‐15, which was readily compromised by supplementation with Siglec‐15 antibodies in the co–culture system (Figure 6D,F,H). In addition, we evaluated the secretion of TNF‐α in the same scenarios as well. Consistent with IL‐2 production, TNF‐α secretion by Jurkat cells was tremendously inhibited by ectopic overexpression of LINC00973 in both A704 and A498 cells, which was almost completely restored by miR‐7109 mimic (Figure 6H). In contrast, LINC00973‐deficiency in both 769‐p and Caki‐1 cells remarkably stimulated TNF‐α secretion of Jurkat, and this effect was abrogated by co–transfection with miR‐7109 inhibitor (Figure 6I). Therefore, our data not only consolidated the immune suppressive role of Siglec‐15 in ccRCC but also highlighted the critical contributions of the aberrant LINC00973‐miR‐7109 signaling.
FIGURE 6.
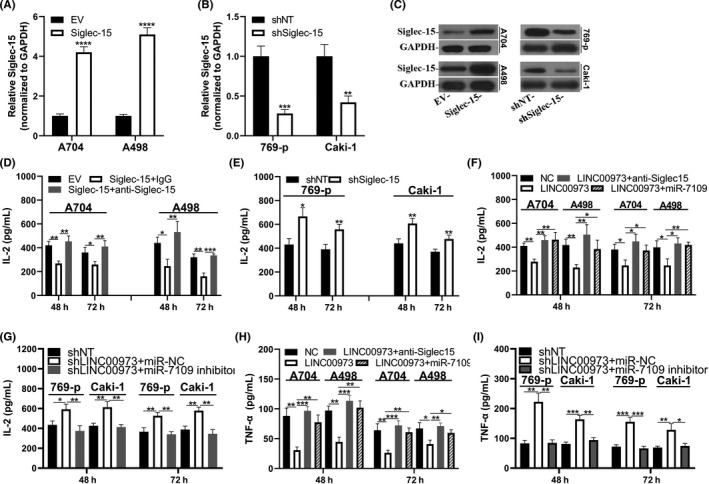
LINC00973‐miR‐7109‐Siglec‐15 axis involved in immune activations in clear‐cell renal cell carcinoma (ccRCC) cells. (A) Establishment of Siglec‐15 overexpression cells in A704 and A498 was confirmed by real‐time PCR. (B) Establishment of Siglec‐15 knockdown cells in 769‐p and Caki‐1 cells was confirmed by real‐time PCR. (C) Western blot results of relative expression of Siglec‐15 protein in cells described in (A) and (B). (D) Interleukin‐2 (IL‐2) production analysis in Jurkat: A704/A498 (EV or Siglec‐15, 2:1) co–culture system. IL‐2 was quantified with an ELISA kit at 48 and 72 h, respectively. (E) IL‐2 production analysis in Jurkat: 769‐p/Caki‐1 (shNT or shSiglec‐15, 2:1) co–culture system. (F) IL‐2 production analysis of Jurkat co–culture system with both A704 and A498 cells transfected with control or LINC00973 in combination with either miR‐NC or miR7109 mimics. (G) IL‐2 production analysis of Jurkat co–culture system with both 769‐p and Caki‐1 cells transfected with negative control or shLINC0973 in combination with either miR‐NC or miR‐7109 inhibitor. (H) Tumor necrosis factor‐α (TNF‐α) secretion analysis of Jurkat co–culture system with both A704 and A498 cells transfected with control or LINC00973 in combination with either miR‐NC or miR‐7109 mimics. (I) TNF‐α secretion analysis of Jurkat co–culture system with both 769‐p and Caki‐1 cells transfected with either negative control or shLINC00973 in combination with either miR‐NC or miR‐7109 inhibitors
4. DISCUSSION
The breakthrough in the search for a novel tumor immune suppressor achieved by Wang et al 12 identified Siglec‐15 as a potential target for normalization cancer immunotherapy. In this study, we identified LINC00973 as positively regulating cell surface Siglec15 in ccRCC. Mechanistically, we revealed that miR‐7109 critically mediated the regulatory action of LINC00973 on Siglec‐15. We further revealed Siglec‐15 to be a direct target of miR‐7109 and identified the target sequence in 3ʹUTR of Siglec‐15. LINC00973 functioned as ceRNA against miR‐7109, and mutual regulation between LINC00973 and miR‐7109 was consequently involved in Siglec‐15 modulation. Most importantly, we provided evidence that abundant LINC00973 in ccRCC cells greatly suppressed the immune activation of Jurkat cells via Siglec‐15, which was greatly antagonized by miR‐7109. In summary, our study uncovered the regulatory mechanism of LINC00973‐miR7109 underlying the high level of Siglec‐15 and consequent contributions to immune suppression in ccRCC (Figure 7).
FIGURE 7.
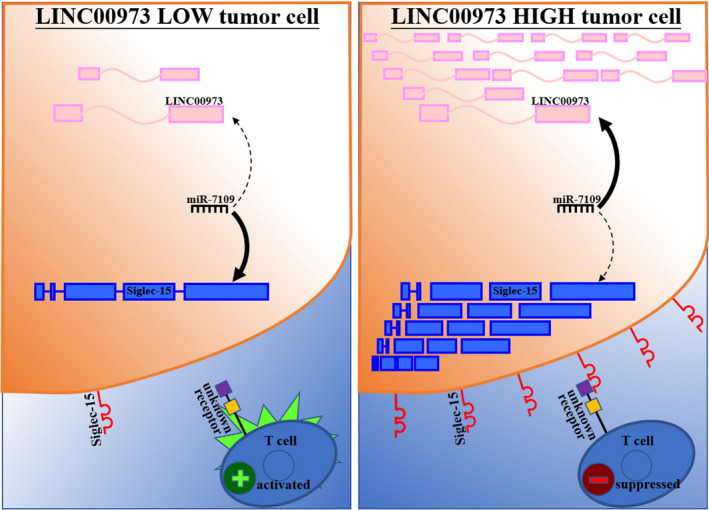
Graphic model of LINC00973‐miR‐7109‐Siglec‐15 involved in immune suppression. LINC00973 proficiency competitively suppressed miR‐7109, and, therefore, upregulated cell surface Siglec‐15, which consequently contributed to the formation of the immune suppressive microenvironment of clear‐cell renal cell carcinoma (ccRCC)
Despite a number of miR being identified as playing fundamental roles in tumor biology in a variety of human malignancies, 16 no report has thus far addressed the pathophysiological activities of miR‐7109. Noteworthily, here we employed online bioinformatic algorithms to predict the regulatory action of miR‐7109 on Siglec‐15 and revealed its competitive relationship with LINC00973. Our data implicated a tumor suppressor role of miR‐7109 in ccRCC through positive activation of immune response, and demonstrated that ectopic introduction of miR‐7109 mimics in ccRCC cells greatly stimulates both IL‐2 and TNF‐α production of co–cultured immune cells. In this regard, we proposed the therapeutic values of miR‐7109 in immune suppressive tumors, especially with a high level of Siglec‐15 and low PD‐L1. Therefore, further investigation with animal models is warranted.
We would also like to emphasize that LINC00973, akin to miR‐7109, was less recognized in respect to its biological functions. The studies performed by both Jing et al 17 and Zinovieva et al 18 suggested intimate an association between high LINC00973 and resistance to an array of chemotherapeutic drugs in colorectal cancer cells. These results could be reconciled with our observations of the involvement of LINC00973 in tumor immune suppression through the dependence of conventional anticancer agents on reactivation of tumor‐targeting immune responses. In addition to direct cytostatic and cytotoxic effects, the therapeutic efficacies of chemical drugs greatly relies on their capacity to increase the immunogenicity of malignant cells or inhibit the immunosuppressive circuitries in the tumor microenvironment. 19 Our results suggested that in LINC00973‐high ccRCC, the established immune suppression via upregulation of Siglec‐15 was inert to reactivation by conventional chemotherapies, and, therefore, exhibited significant drug resistance in colorectal cancer. Therefore, as we mentioned above, we hypothesized that combinational administration with miR‐7109 mimic might be the optimal way to circumvent this issue in resistant cancers.
Our study highlighted the ceRNA network consisting of previously less‐informed LINC00973 and miR‐7109 in immune modulation of ccRCC through regulating Siglec‐15. The importance of ceRNA in the initiation and the progression of ccRCC has also been increasingly highlighted in multiple investigations, and our data showed a novel model of ceRNA participating in immune modulation in cancer, offering new insight into the complex regulatory network of tumor immune evasion. More importantly, the synergistic effects of miR‐7109 with Siglec‐15 antibody‐based immunotherapy warrants further investigation and pre–clinical studies, at least in ccRCC.
In summary, we revealed that a high level of LINC00973 positively regulated the novel immune suppressor gene, Siglec‐15, through competing with miR7109 in ccRCC. Understanding the importance of LINC00973‐miR‐7109‐Siglec‐15 in tumor immune evasion in ccRCC presents the opportunity for both therapeutic interventions and diagnostic/prognostic exploitation.
DISCLOSURE
All the other authors have no conflicts of interest to disclose.
ETHICAL CONSIDERATIONS
This study was approved by the Ethics Committee of Longgang District People’s Hospital of Shenzhen (reference number: LG2019KY‐002) and conducted in accordance with the Declaration of Helsinki.
ACKNOWLEDGEMENTS
This work was supported by the National Natural Science Foundation of China (No. 81672796 to YBL). We are grateful to Professor Qian Yue (University of California, Santa Cruz) for proofreading this manuscript.
Liu Y, Li X, Zhang C, Zhang H, Huang Y. LINC00973 is involved in cancer immune suppression through positive regulation of Siglec‐15 in clear‐cell renal cell carcinoma. Cancer Sci. 2020;111:3693–3704. 10.1111/cas.14611
REFERENCES
- 1. Ribas A, Wolchok JD. Cancer immunotherapy using checkpoint blockade. Science. 2018;359:1350‐1355. [DOI] [PMC free article] [PubMed] [Google Scholar]
- 2. Pardoll DM. The blockade of immune checkpoints in cancer immunotherapy. Nat Rev Cancer. 2012;12:252‐264. [DOI] [PMC free article] [PubMed] [Google Scholar]
- 3. Palucka AK, Coussens LM. The basis of oncoimmunology. Cell. 2016;164:1233‐1247. [DOI] [PMC free article] [PubMed] [Google Scholar]
- 4. Gajewski TF, Schreiber H, Fu YX. Innate and adaptive immune cells in the tumor microenvironment. Nat Immunol. 2013;14:1014‐1022. [DOI] [PMC free article] [PubMed] [Google Scholar]
- 5. Mittal D, Gubin MM, Schreiber RD, Smyth MJ. New insights into cancer immunoediting and its three component phases–elimination, equilibrium and escape. Curr Opin Immunol. 2014;27:16‐25. [DOI] [PMC free article] [PubMed] [Google Scholar]
- 6. Dong H, Strome SE, Salomao DR, et al. Tumor‐associated B7–H1 promotes T‐cell apoptosis: a potential mechanism of immune evasion. Nat Med. 2002;8:793‐800. [DOI] [PubMed] [Google Scholar]
- 7. Kim TK, Herbst RS, Chen L. Defining and understanding adaptive resistance in cancer immunotherapy. Trends Immunol. 2018;39:624‐631. [DOI] [PMC free article] [PubMed] [Google Scholar]
- 8. Goodman A, Patel SP, Kurzrock R. PD‐1‐PD‐L1 immune‐checkpoint blockade in B‐cell lymphomas. Nat Rev Clin Oncol. 2017;14:203‐220. [DOI] [PubMed] [Google Scholar]
- 9. Souquet PJ, Couraud S. Immune checkpoint inhibitors: a game changer for metastatic non–small‐cell lung cancer. Lancet Oncol. 2019;20:1334‐1335. [DOI] [PubMed] [Google Scholar]
- 10. Manfredi S, Drouillard A. Immune‐checkpoint inhibition for digestive cancers. Lancet Oncol. 2017;18:561‐562. [DOI] [PubMed] [Google Scholar]
- 11. Zhang Y, Chen L. Classification of advanced human cancers based on tumor immunity in the MicroEnvironment (TIME) for cancer immunotherapy. JAMA Oncol. 2016;2:1403‐1404. [DOI] [PMC free article] [PubMed] [Google Scholar]
- 12. Wang J, Sun J, Liu LN, et al. Siglec‐15 as an immune suppressor and potential target for normalization cancer immunotherapy. Nat Med. 2019;25:656‐666. [DOI] [PMC free article] [PubMed] [Google Scholar]
- 13. Angata T, Tabuchi Y, Nakamura K, Nakamura M. Siglec‐15: an immune system Siglec conserved throughout vertebrate evolution. Glycobiology. 2007;17:838‐846. [DOI] [PubMed] [Google Scholar]
- 14. Thomson DW, Dinger ME. Endogenous microRNA sponges: evidence and controversy. Nat Rev Genet. 2016;17:272‐283. [DOI] [PubMed] [Google Scholar]
- 15. Tay Y, Rinn J, Pandolfi PP. The multilayered complexity of ceRNA crosstalk and competition. Nature. 2014;505:344‐352. [DOI] [PMC free article] [PubMed] [Google Scholar]
- 16. Bracken CP, Scott HS, Goodall GJ. A network‐biology perspective of microRNA function and dysfunction in cancer. Nat Rev Genet. 2016;17:719‐732. [DOI] [PubMed] [Google Scholar]
- 17. Jing C, Ma R, Cao H, et al. Long noncoding RNA and mRNA profiling in cetuximab‐resistant colorectal cancer cells by RNA sequencing analysis. Cancer Med. 2019;8:1641‐1651. [DOI] [PMC free article] [PubMed] [Google Scholar]
- 18. Zinovieva OL, Grineva EN, Prokofjeva MM, et al. Expression of long non–coding RNA LINC00973 is consistently increased upon treatment of colon cancer cells with different chemotherapeutic drugs. Biochimie. 2018;151:67‐72. [DOI] [PubMed] [Google Scholar]
- 19. Galluzzi L, Buque A, Kepp O, Zitvogel L, Kroemer G. Immunological effects of conventional chemotherapy and targeted anticancer agents. Cancer Cell. 2015;28:690‐714. [DOI] [PubMed] [Google Scholar]


