

Abstract
We constructed a data set of EGFR‐mutant non–small‐cell lung carcinoma (NSCLC) patients, and compared the overall survival of first‐generation (1G), and second‐generation (2G) EGFR‐tyrosine kinase inhibitors (TKIs) in clinical practice using a propensity score. We reviewed the clinical data of consecutive EGFR‐mutated NSCLC patients who received EGFR‐TKI therapy between January 2008 and August 2017 at 11 institutions in Japan. The primary endpoint was overall survival (OS). When comparing OS between 1G and 2G EGFR‐TKIs, propensity score analyses were performed using 2 methods: matching and inverse probability of treatment weighting (IPTW). (Clinical Trial information: UMIN000030121) In total, 1400 patients from 11 institutions were enrolled in this study, and the data from the 1366 patients who received only EGFR‐TKI therapy were analyzed (gefitinib [GEF], N = 732; erlotinib [ERL], N = 416; afatinib, N = 218). Median OS times (months [95%CI]) were 29.7 [27.5‐33.5] in the 1G group (gefitinib, 32.0 [28.1‐35.8]; erlotinib, 27.5 [23.9‐31.7]), and 38.6 [32.2‐NR] in the 2G group (afatinib), respectively. The trend of longer OS for afatinib against 1G EGFR‐TKIs remained, even after adjusted by propensity score. (unadjusted, hazard ratio [HR] 0.676, P = .0023; adjusted by IPTW, HR 0.685 P < .0001; adjusted by matching, HR 0.725, P = .0418). Exploratory analysis showed that OS using the 2G EGFR‐TKI was superior to that of the 1G EGFR‐TKIs, suggesting the potential of sequential therapy of 2G EGFR‐TKI followed by osimertinib. (HR 0.419, P = .0519) Real‐world data analysis using 1354 data records, using propensity scoring, indicated that 2G EGFR‐TKI had a trend of longer OS compared with 1G EGFR‐TKIs.
Keywords: EGFR‐TKI, non–small‐cell lung cancer, propensity scoring analysis, real‐world data
![]()
1. INTRODUCTION
Lung cancer is the leading cause of death worldwide. Targeted therapy for lung cancer has improved the survival benefit for patients with lung cancer harboring a driver oncogene. Epidermal growth factor receptor (EGFR), one of the targeted driver oncogene molecules, is the distinct molecular subset of non–small‐cell lung cancer, and EGFR‐tyrosine kinase inhibitors (TKI) have been proven in prospective clinical trials to have potent anti‐tumor activity for NSCLC harboring EGFR mutation.
Two first‐generation (1G) EGFR‐TKIs, gefitinib and erlotinib, have been approved for the treatment of EGFR‐mutant NSCLC, based on the evidence of prolonged progression‐free survival (PFS) compared with chemotherapy. 1 , 2 , 3 , 4 , 5 , 6 Clinical trials to compare the clinical benefit between gefitinib and erlotinib have been conducted, showing no difference in PFS and overall survival (OS) between the 2 groups. 7 , 8 Afatinib, one of the second‐generation (2G) EGFR‐TKIs, has also been proven to have prolonged PFS over chemotherapy in 2 clinical trials, LUX‐Lung3 and LUX‐Lung 6. 9 , 10 , 11 The LUX‐Lung 7 trial was designed as a randomized phase IIb trial to compare the clinical benefits of afatinib vs gefitinib. The results of this trial indicated that PFS, time to treatment failure (TTF), and overall response rate (ORR) were significantly improved in the afatinib group, with no significant difference in OS. 12 , 13 The other 2G EGFR‐TKI, dacomitinib, was investigated by comparing it with gefitinib in a randomized phase III trial, ARCHER1050. 14 , 15 Similar to the results of LUX‐Lung 7, dacomitinib showed significantly prolonged PFS compared with gefitinib with a 0.59 HR. The ARCHER1050 study, however, excluded patients with brain metastasis, a possible reason for the discrepancy between the trial results and clinical practice. There are currently no more clinical trials to evaluate 2G against 1G EGFR‐TKIs, clinical questions that were not addressed in previous trials remain unclear. Osimertinib, a third‐generation (3G) EGFR‐TKI, was proven to be more effective than 1G EGFR‐TKIs in the FLAURA trial, while a comparative analysis of osimertinib against 2G EGFR‐TKIs had not yet been done. In addition, the subgroup analysis in the FLAURA trial indicated that a superiority of survival benefit for osimertinib against 1G EGFR‐TKIs was not shown in an Asian population. Therefore, a study of the survival benefit of 2G‐TKIs using large‐scale data in clinical practice is of value, and should be discussed.
The unsolved clinical questions can be evaluated using practical data as retrospective research, and recently real‐world data (RWD), by which real‐world evidence (RWE) has been established, is often available to evaluate efficacy and safety in clinical practice. RWD/RWE includes patients who are usually excluded in the prospective clinical trials, and reflect the practical outcomes. The advantage can be obvious, especially for analysis of safety, or for specific patients such as the elderly or those with poor performance status. The United States Food and Drug Administration announced guidance for the use of RWD/RWE, in which they provisionally defined RWD/RWE, and mentioned the utility of RWD for the evaluation of safety. 16 Recently, a retrospective study using RWD indicated that afatinib therapy with dose‐adjusting in practice had c. 19.5 mo of time on treatment, 17 and other RWD demonstrated that the combined time on treatment of afatinib followed by osimertinib was 28.1 mo. 18 , 19
When evaluating efficacy or safety comparatively using RWD, however, there are inevitable biases due to the background of patients not being uniform. Propensity scoring is one of the methods in retrospective research for comparative analysis, in which calculated propensity score is used for adjusting the background among groups.
We systematically reviewed the large amount of RWD from multiple institutions, and we compared the overall survival (OS) between 1G and 2G EGFR‐TKIs using propensity score.
2. MATERIAL AND METHODS
2.1. Patients and clinical data
We reviewed the data of consecutive patients who received EGFR‐TKI therapy between January 2008 and August 2017 at 11 institutions in Japan. EGFR‐TKI therapy as first EGFR‐TKI was defined as treatment with gefitinib, erlotinib, or afatinib, and patients who were treated with an investigational drug that was not approved at the time of analysis were excluded. The data were available from the electronic medical databases of each enrolled institution, and the data cut‐off was defined as December 2017. Patients who did not receive any EGFR‐TKI or whose EGFR mutational status was unknown in detail were excluded from this analysis. Although this research permitted patients who were treated with the combination therapy of erlotinib plus bevacizumab to be enrolled, this analysis excluded these patients with the aim of evaluating EGFR‐TKI monotherapy. The 1G EGFR‐TKI group included patients treated with gefitinib or erlotinib, and the 2G EGFR‐TKI group included patients treated with afatinib.
2.2. Clinical outcome
The primary endpoint was OS, and the secondary endpoint was TTF. According to the criteria in Response Evaluation Criteria in Solid Tumors (RECIST) v.1.1, OS was defined as the period from the start of treatment to death due to any cause, and TTF was defined as the period from the start of treatment to the discontinuation of the drug due to any cause. In this study, progression was not defined as an event to evaluate cases with oligometastasis continued EGFR‐TKI therapy after local therapy beyond progression of disease. The response rate was also estimated in accordance with RECIST criteria. OS and TTF were compared between the 1G EGFR‐TKI and 2G EGFR‐TKIs and, for these outcomes, subgroup analyses were also conducted in patients with brain metastasis, exon19 deletion, and exon21 L858R point mutation, respectively. Exploratory analysis was conducted in the subgroup of patients who received their first EGFR‐TKI therapy after the approval in Japan of afatinib and osimertinib, respectively. PFS was also evaluated in this analysis, however the PFS analysis required the exclusion of patients without an evaluable lesion, which could be considered selection bias. Moreover, PFS is not reliable in this research due to the nature of retrospective design. Conversely, TTF can reflect an adverse event because TTF is defined as the discontinuation of treatment due to any cause as an event. Therefore, TTF is defined as a secondary endpoint.
2.3. Study registration and data collecting
First, the investigators in each institution enrolled the number of patients who met the eligible criteria without the use of detailed clinical data. Second, according to the number of enrolled patients, the individual data of the patients was collected by paper or electronic case report forms in detail. This two‐step registry course was conducted to avoid patient selection bias. This study was registered before the enrollment of patient data. (Clinical Trial Information: UMIN000030121) The statistical protocol had been previously opened in UMIN before data collection was finished. The clinical data were collected and forwarded to the data center and research secretariat (KI), and analyzed by the designated statistician (KM). The full protocol was approved by the institutional review board in each institution. This research was funded by Boehringer Ingelheim Japan.
2.4. Data adjustment for TTF analysis and OS analysis
There were 93 instances of patients’ data missing information details at the first data cleaning, when we checked the dates of the OS and TTF data. The missing data were confirmed and the patient data updated. Patient data with detail information for either TTF or OS were included for analysis when appropriate. Eventually, 2 data records that were missing both OS and TTF were excluded from this analysis (Figure 1).
FIGURE 1.

Consort flow diagram of patients. 1400 patients were enrolled in this study, eventually 1366 patients were analyzed in this study
2.5. Statistical analysis
Comparative analysis of OS between 1G and 2G was performed both unadjusted and adjusted with propensity score, respectively. Propensity score was estimated using 9 factors as follows: age, sex, histologic subtype, smoking history, EGFR mutational status, clinical stage, line of treatment, ECOG PS, and the presence of brain metastasis. Adjusting by propensity score was conducted using 2 methods, IPTW and matching. In addition, stabilized IPTW and truncated (at the 99th percentile) IPTW were also conducted in the OS analysis and the TTF analysis. The matching method was performed using 3 ratios; 1:1, 1:2, and 1:3 without replacement, respectively. The list of standardized difference, which was calculated in matching methods, is shown in Table S1. All survival curves were calculated by Kaplan‐Meier method. HR was calculated with the Cox hazard model and a comparison of the survival curves was performed with the log‐rank test. A significant difference was defined as a P value of less than .05. All statistical analyses were performed using SAS v.9.4 software (SAS Institute Inc.).
3. RESULTS
3.1. Discography
In total, 1400 patients were enrolled in this research, and the data of 1366 patients were analyzed for comparative analysis between 1G and 2G EGFR‐TKIs (Figure 1). Mean age was 69 [range: 28‐99], and the majority were female (61.3%). 1299 patients (95.1%) were pathologically diagnosed with adenocarcinoma. The mutational status of exon 19 deletion existed in 679 patients, L858R in 573 patients, and minor or compound mutation existed in 114 patients. In total, 1105 patients (80.9%) with 0 or 1 of ECOG PS and the 203 patients (14.9%) with 2 or 3 of ECOG PS were included. Out of these, 979 patients (71.7%) had been treated with an EGFR‐TKI in first‐line settings, and 373 patients (27.3%) had been diagnosed with brain metastasis at the time of receiving their first EGFR‐TKI therapy. When comparing patient backgrounds in the 3 groups based on EGFR‐TKI, there were significant differences between 1G and 2G in age, ECOG PS, and EGFR mutational subtype with a P value of <.005 by Fischer exact test (Table 1).
TABLE 1.
Demographics of patients
|
All N = 1366 |
1G N = 1148 |
2G N = 218 |
P value | |
|---|---|---|---|---|
| Mean age [range] | 69.21 [28‐99] | 70.15 [28‐99] | 64.29 [34‐87] | <.001 |
| Sex F/M | 838/528 | 722/426 | 116/102 | .008 |
| Smoking status Never/Current or Former/Unknown | 773/502/91 | 660/408 /80 | 113/94/11 | .133 |
| Histologic subtype ADC/Non‐ADC | 1299/67 | 1091/57 | 208/10 | .322 |
| ECOG PS (at starting EGFR‐TKI) 0‐1/2‐4/Unknown | 1106/215/45 | 903/203/42 | 203/12/3 | <.001 |
| Clinical stage (initial diagnosis) 1A‐3A/3B/4/Unknown | 312/60/991/1 | 273/49/823/1 | 39/11/168/0 | .235 |
| EGFR mutational status Ex19del/L858R/Minor or compound | 679/573/114 | 538/526/84 | 141/47/30 | <.001 |
| Line of treatment First/Second/Third or more | 979/315/72 | 809/274/65 | 170/41/7 | .066 |
| Brain metastasis Yes/No or Unknown | 373/993 | 321/827 | 52/166 | .073 |
3.2. Overall survival
For the OS analysis, 29 out of 1366 patients’ data records were excluded due to an absence of detail in their OS information. As a result, 1337 patients (97.9%) were included for OS analysis. Median follow‐up period was 19.8 mo in 1G and 19.4 mo in 2G, respectively. The Kaplan‐Meier curve without adjustment showed longer OS for the 2G EGFR‐TKI compared with the 1G EGFR‐TKIs (median OS, months, 38.6 [95%CI 32.2, NR] in 2G, 29.7 [95%CI 27.5, 33.5] in 1G; HR, 0.676 [95%CI 0.526, 0.870], P = .0023) (Figure 2). Among the 3 EGFR‐TKIs, the OS curve of afatinib remained superior to the other 2 1G EGFR‐TKI curves (32.0 [95%CI 28.1, 35.8] in gefitinib, 27.5 [23.9, 31.7] in erlotinib, 38.6 [95%CI 32.2, NR] in afatinib). The HR adjusted by propensity scoring indicated that all hazard ratios (HR) were less than 0.75, regardless of the method of propensity scoring used (Table 2A). In the IPTW method including stabilized IPTW and truncated IPTW, which can use the largest sample size for analysis, the P value was calculated to be less than .01 (Table 2A).
FIGURE 2.
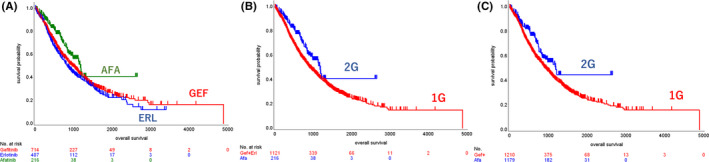
Kaplan‐Meier curves of OS. A, Unadjusted Kaplan‐Meier curves of the 1G and 2G EGFR‐TKI groups. B, Kaplan‐Meier curves adjusted by propensity score in the 1G and 2G EGFR‐TKI groups. C, Unadjusted Kaplan‐Meier curves of 3 groups based on EGFR‐TKI
TABLE 2.
Hazard ratios
| A, Hazard ratios of OS and TTF between 1G and 2G in all patients | ||||||
|---|---|---|---|---|---|---|
| Method | OS | TTF | ||||
| N | HR [95%CI] | P value | N | HR [95%CI] | P value | |
| Unadjusted | 1368 | 0.676 [0.526, 0.870] | .0023 | 1368 | 0.817 [0.685, 0.975] | .0247 |
| IPTW | 1207 | 0.685 [0.603, 0.780] | <.0001 | 1206 | 0.793 [0.722, 0.872] | <.0001 |
| Stabilized IPTW | 1207 | 0.683 [0.521, 0.894] | .0055 | 1206 | 0.788 [0.651, 0.952] | .0137 |
| Truncated IPTW | 1195 | 0.739 [0.644, 0.848] | <.0001 | 1195 | 0.830 [0.751, 0.918] | .0003 |
| Matching (1:1) | 410 | 0.740 [0.539, 1.016] | .0626 | 410 | 0.912 [0.725, 1.148] | .4336 |
| Matching (1:2) | 540 | 0.725 [0.532, 0.988] | .0418 | 540 | 0.910 [0.735, 1.127] | .3861 |
| Matching (1:3) | 440 | 0.658 [0.453, 0.956] | .0279 | 448 | 0.823 [0.634, 1.067] | .1413 |
| B, Hazard ratios of OS and TTF between 1G and 2G in subgroup | ||||||
|---|---|---|---|---|---|---|
| OS | TTF | |||||
| Subgroup | ||||||
| Method | N | HR [95%CI] | P value | N | HR [95%CI] | P value |
| Unadjusted | 367 | 0.757 [0.471, 1.215] | .2481 | 365 | 0.782 [0.549, 1.113] | .1725 |
| A, Brain metastasis | ||||||
| IPTW | 338 | 0.651 [0.513, 0.826] | .0004 | 335 | 0.765 [0.639, 0.915] | .0034 |
| Matching (1:1) | 98 | 0.975 [0.514, 1.851] | 0.9390 | 98 | 0.850 [0.533, 1.355] | .4942 |
| Unadjusted | 667 | 0.597 [0.424, 0.840] | .0030 | 667 | 0.818 [0.653, 1.026] | .0820 |
| B, Exon 19 deletion | ||||||
| IPTW | 600 | 0.551 [0.448, 0.676] | <.0001 | 598 | 0.864 [0.754, 0.990] | .0348 |
| Matching (1:1) | 268 | 1.043 [0.675, 1.611] | .8506 | 268 | 1.114 [0.833, 1.489] | .4668 |
| Unadjusted | 558 | 0.862 [0.534, 1.390] | .5420 | 561 | 0.845 [0.590, 1.211] | .3592 |
| C, Exon 21 L858R | ||||||
| IPTW | 506 | 0.905 [0.746, 1.097] | .3091 | 509 | 0.834 [0.716, 0.971] | .0192 |
| Matching (1:1) | 90 | 1.077 [0.581, 1.997] | .8144 | 90 | 0.918 [0.566, 1.490] | .7296 |
3.3. Time to treatment failure
For the TTF analysis, 27 out of 1366 patients’ data records were excluded due to an absence of detail in their TTF information. As a result, 1339 patients (98.0%) were included for TTF analysis. Median follow‐up period was 9.6 mo in 1G and 10.8 mo in 2G, respectively. The Kaplan‐Meier curve without adjustment showed longer TTF for the 2G EGFR‐TKI compared with the 1G EGFR‐TKIs (median TTF, months, 14.4 [95%CI 11.4, 17.2] in 2G, 10.6 [95%CI 9.8, 11.3] in 1G; HR, 0.817 [95%CI 0.685, 0.975], P = .0247) (Figure 3). Among the 3 EGFR‐TKIs, the TTF curve of afatinib remained superior to the other 2 1G EGFR‐TKI curves (14.4 [95%CI 11.4, 17.2] in gefitinib, 10.6 [95%CI 9.3, 12.2] in erlotinib, 14.4 [95%CI 11.4, 17.2] in afatinib). The HR of TTF adjusted by propensity scoring indicated that all HRs were less than 1.00 regardless of the method of propensity scoring used (Table 2A). A significant difference, however, in TTF between 1G and 2G EGFR‐TKIs was found only by the IPTW methods, with an HR value of 0.788 to 0.830 (Table 2A).
FIGURE 3.
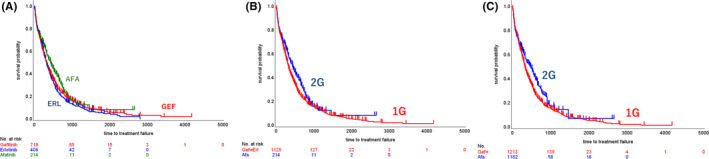
Kaplan‐Meier curves of TTF. A, Unadjusted Kaplan‐Meier curves of the 1G and 2G EGFR‐TKI groups. B, Kaplan‐Meier curves adjusted by propensity score in the 1G and 2G EGFR‐TKI groups. C, Unadjusted Kaplan‐Meier curves of 3 groups based on EGFR‐TKI
3.4. Subgroup analysis
Subgroup analyses in the groups with exon 19 deletion (Ex19del), exon 21 L858R point mutation (L858R), or brain metastasis (BRA) were conducted both with and without adjusting by propensity scoring. The Kaplan‐Meier curves indicated prolonged OS and TTF with the 2G EGFR‐TKI in the Ex19del and BRA subgroups (Figure 4), with favoring HR even after propensity scoring (HR after propensity scoring, OS, 0.651 in Ex19del and 0.651 in BRA; TTF, 0.765 in Ex19del and 0.765 in BRA). The subgroup of patients with ECOG PS of 2 or 3, and patients who received EGFR‐TKIs as first‐line treatment, were analyzed as sensitivity analyses. The subgroup of patients who received EGFR‐TKIs in first‐line settings also showed prolonged OS and TTF among patients who received 2G EGFR‐TKIs compared with those who received 1G EGFR‐TKIs (HR of OS, 0.617 [95%CI, 0.452 to 0.841]; HR of TTF, 0.769 [95%CI, 0.625 to 0.945]). Meanwhile, there was no significant difference in OS and TTF in the subgroup of patients with ECOG PS 0f 2 or 3 (HR of OS, 0.458 [95%CI, 0.188 to 1.118]; HR of TTF, 0.724 [95%CI, 0.382 to 1.372]) (Figure S1).
FIGURE 4.
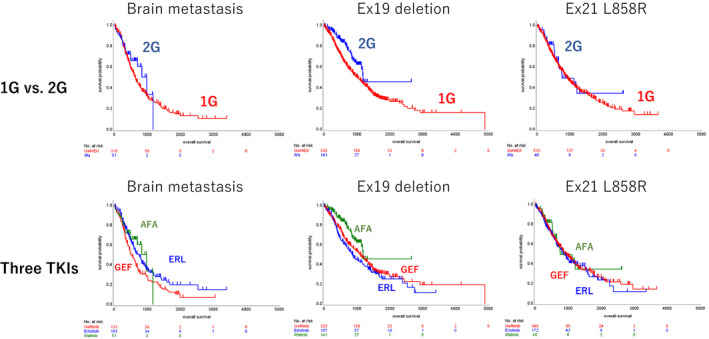
Kaplan‐Meier curves of OS in subgroup analysis. The uppers are comparison between 1G and 2G, and lowers are among 3 TKIs. A, Brain metastasis; B, Ex 19 deletion; C, L858R
3.5. Exploratory analysis
The start date of treatment generally had an impact on OS due to the treatment options available at that time, or other developments in medicine. To adjust for bias due to the start date of treatment, an analysis using the limited population who started their first EGFR‐TKI therapy after the approval of afatinib, or after the approval of osimertinib, respectively, was conducted as an exploratory analysis.
In patients who received their first EGFR‐TKI after the approval of afatinib, the unadjusted Kaplan‐Meier curves showed that the both TTF and OS had superior survival benefit in the 2G EGFR‐TKI group compared with 1G EGFR‐TKI group, with P values of < .0001 in TTF analysis and .0022 in OS analysis, respectively (Figure S2).
In patients who received their first EGFR‐TKI after the approval of osimertinib, the unadjusted Kaplan‐Meier curves showed that OS using the 2G EGFR‐TKI was superior to that of the 1G EGFR‐TKIs with an HR value of 0.419 [95%CI 0.174, 1.007] and a P value of .0519 (Figure S3). Kaplan‐Meier curves of TTF in this population were also calculated for exploratory purposes, favoring the 2G EGFR‐TKI against 1G EGFR‐TKIs with an HR value of 0.663 [95%CI 0.431, 1.022] and a P value of .0627. The number of patients treated with osimertinib was 17/151 (11.26%) in the 1G group, and 3/68 (4.41%) in the 2G group. All 4 patients in the 2G group were alive and receiving ongoing EGFR‐TKI therapy at the point of data cut‐off.
4. DISCUSSION
This is a multicenter research report with a large sample size of over 1300 EGFR‐mutated NSCLC patients’ RWD to compare the OS between 1G and 2G EGFR‐TKIs by multiple propensity score analysis. To our best knowledge, the sample size of our study is the largest in the retrospective studies to compare 1G and 2G EGFR‐TKIs, including over 200 patients who received 2G EGFR‐TKI. In addition, we examined the reliability of propensity scoring analysis by comparing it with the historical data of prospective trials.
In the OS analysis between unadjusted data and data adjusted by propensity score, all OS HRs favored the 2G EGFR‐TKI compared with the 1G EGFR‐TKIs across methods of propensity scoring. Using the IPTW method HR was calculated at 0.676 in unadjusted, and 0.685 in adjusted with a P value of less than .05. LUX‐Lung 7 indicated HR in OS of 0.73 between gefitinib and afatinib, which is consistent with our data. TTF analysis also favored HR in the 2G EGFR‐TKI group in all methods of propensity scoring. Although the background of patients showed significant differences in age, ECOG PS, and EGFR mutational subtype between 1G and 2G, these factors were included in the adjusting factors in the propensity scoring. Our study indicated that the 2G EGFR‐TKI group had statistically longer OS and TTF compared with the 1G EGFR‐TKIs even after adjusting these factors by propensity score. Multivariate analysis showed HR of 0.756 with a P value of .0432 (Table S2).
The secondary endpoint of the present study was TTF, which reflects both clinical benefit and adverse event simultaneously. PFS is not reliable for evaluating the survival benefit because the period of evaluation of efficacy by computed tomography scan or magnetic resonance imaging varies among institutions and physicians in clinical practice. Especially in the case of oligometastasis, EGFR‐TKI therapy is often continued with local therapy even after progressive disease (PD), therefore we selected TTF as the secondary endpoint in our study, and the results for TTF were consistent with the results of OS in the present study.
When discussing the method of propensity scoring, the IPTW method, preserving sample size, showed a superior survival outcome for the 2G EGFR‐TKI group compared with 1G EGFR‐TKIs in all analyses. Meanwhile, the matching method decreased the sample number due to selecting as well balancing the samples, resulting in it being statistically under‐powered for detecting a significant difference. Matching by a 1:1 ratio decreased the sample size to 410, resulting in a failure to show a statistical significance, and matching by a 1:2 ratio used 540 patients’ data, resulting in a P value of less than .05. The matching method decreased the number of patients for analysis in a well balanced manner and analyzed the selected patients in a similar fashion to a subgroup analysis. Therefore, the results of the matching method can be interpreted as a sensitivity analysis. The sensitivity analysis by matching method across the ratios also favored the 2G EGFR‐TKI, and the IPTW method indicated a similar trend with statistically significant differences. The C‐statistic is a probability of concordance between predicted and observed treatment (ie G1 or G2), with c = 0.5 for random predictions and c = 1 for a perfectly discriminating model. The C‐statistic of the model was 0.743(95%CI 0.708‐0.778), which indicated that the logistic model is accurate.
In the subgroup analysis as an exploratory analysis, the Ex19del and BRA subgroups demonstrated that the 2G EGFR‐TKI had longer OS and TTF compared with the 1G EGFR‐TKIs. The BRA group showed a statistically significant difference in both OS and TTF with P values of less than .05 by IPTW method. Subgroup analysis of the Ex19del group demonstrated a significant superiority of OS benefit in the 2G EGFR‐TKI group over the 1G EGFR‐TKIs, with HR of 0.551 by IPTW method, suggesting patients with the Ex19del can be candidates for afatinib therapy. Meanwhile, L858R seems to be recognized as a disadvantage for afatinib therapy due to results of the LUX‐Lung 3, and LUX‐Lung 6 trials. The results of the LUX‐Lung 7 trial, however, favored afatinib in the subgroup with the L858R mutation, leading to values of 0.71 and 0.75 of HR in PFS and OS, respectively. 12 , 13
Our study showed that the Kaplan‐Meier curves of OS in the 1G EGFR‐TKI group and 2G EGFR‐TKI group overlapped almost parallel in the L858R subgroup, and the propensity scoring analysis of TTF by IPTW method indicated 0.834 for HR with a P value of .0192, which suggested that L858R cannot be a reason for excluding afatinib therapy as treatment option. The FLAURA trial showed no significant difference in OS between 3G and 1G EGFR‐TKIs in the subgroup analysis of patients with the L858R mutation. 20 Previous reports of the combination therapy of erlotinib plus anti‐VEGF antibodies showed survival benefit compared with erlotinib alone, even in the subgroup of patients with the L858R mutation. 21 , 22 Therefore, further investigation is required, and the treatment strategy for patients with L858R mutation should be discussed individually. Other subgroup analyses indicated that 2G EGFR‐TKIs had better survival outcomes compared with 1G EGFR‐TKIs even in first‐line settings, but no significant difference in patients with poor EGOG PS was indicated.
Overall survival generally depends on the timing of induction of EGFR‐TKI therapy due to sequential therapy after the first EGFR‐TKI, including osimertinib, or other medical improvement. We analyzed the patients who began EGFR‐TKI therapy after the approval of afatinib in May 2014, or the approval of osimertinib in April 2016, respectively. In the patients who began EGFR‐TKI after the approval of afatinib, both TTF and OS analysis indicated that the 2G EGFR‐TKI had superior survival benefit compared with 1G EGFR‐TKIs. The OS of 1G EGFR‐TKIs in our study, 34.7 mo in GEF and 31.3 mo in ERL, seems to be slightly improved compared with previous studies conducted before approval of afatinib and reported that the OS of 1G EGFR‐TKIs was 29.5 mo. 23 This is probably due to the efficacy of 2G EGFR‐TKIs compared with 1G EGFR‐TKIs in the late phase of TTF, or the influence of the sequential therapy after 1G or 2G EGFR‐T KI therapy, including osimertinib therapy.
Therefore, we assessed the influence of osimertinib therapy on OS to evaluate the patients who started EGFR‐TKI therapy after the approval of osimertinib. As mentioned in the introduction, a previous report demonstrated the combined time on treatment of afatinib and osimertinib was calculated to have a median value of 27.6 in a retrospective analysis using RWD. 17 The research suggested that prior afatinib therapy prolonged the time on treatment of osimertinib therapy, which was supportive for the strategy of sequential therapy, however sequential therapy was applied only for T790M‐positive patients. Therefore, for the aim of evaluating sequential therapy regardless of T790M status, we analyzed the OS of all patients who had been treated with their first EGFR‐TKI since April 2016, in which osimertinib was approved in Japan. The patients who started to receive their first EGFR‐TKI since osimertinib was available as second‐line treatment should be candidates for analysis for the purpose of excluding selection bias. As shown in Figure S3, all patients were alive with longer TTF. The follow‐up period, however, was too short, and the sample size was too small to adjust using propensity score. Therefore, further investigation is warranted to confirm the benefit of sequential therapy using followed osimertinib therapy.
As a final step we assessed whether this RWD is consistent with the data in previous studies. We reviewed the OS, PFS, ORR, and HR or odds ratio in each outcome in the previous randomized phase 3 trials shown in Table S3. According to this table, we concluded that our RWD remains comparatively concordant with the historical data. The results indicated that the propensity scoring analysis using large RWD can be considered as being reliably close to prospective trials, especially for unfeasible clinical trials.
There are some limitations, especially due to the nature of retrospective design. Unfortunately, RWD often includes patient records with missing data. For instance, we tried to reduce the proportion of patients with unknown ECOG PS by requesting queries, with the result that 3.3% (45/1366) of patients had no information about ECOG PS in their medical records. We selected TTF instead of PFS as the secondary endpoint due to the advantage of TTF, and disadvantage of PFS, previously described. This research used a large sample size, consecutive patients without selection, and various assessment by multiple adjusting methods. Although these factors can decrease the bias compared with a conventional retrospective study, the reliability of the results was lower compared with prospective trials.
The dramatic improvement of OS of patients with lung cancer required a larger sample size for detecting a significant difference in OS than exists in prospective clinical trials. RWD is available to evaluate the efficacy of treatment options in practice, however the problem of biases due to the nature of retrospective design arises. Propensity scoring is useful to address this issue by adjusting the biases between the options. Present research showed various results based on the type of propensity scoring method. The IPTW method can optimize the resource of sample data, meanwhile the matching method, which selects a well balanced section of patients, results in decreasing the sample size to one similar to a subgroup analysis, and can be interpreted as a sensitivity analysis. Our RWD analysis using a large sample size and adjusting by propensity scoring indicated that the 2G EGFR‐TKI had a statistically better OS benefit compared with the 1G EGFR‐TKIs, regardless of the methodology of analysis. Further investigation with a longer follow‐up period and a larger number of patients is needed to confirm the clinical benefit of sequential therapy.
5. ETHICAL CONSIDERATIONS
The full protocol was approved by the institutional review board in each institution. The protocol was carried out in accordance with the Declaration of Helsinki. The data were anonymized before analysis.
DISCLOSURES
K Ito received research funding from Boehringer, Chugai, Novartis, Ono Pharma, Daiichi‐Sankyo, GSK, Byer, Kyorin, and lecture fees from Boehringer Ingelheim, Chugai Pharm, Eli Lily Japan, MSD, AstraZeneca, Ono Pharm, Pfizer. K Murotani received lecture fees from Boehringer Ingelheim, Chugai Pharm, MSD, Taiho Pharm. A Kubo received research funding from Boehringer Ingelheim, Chugai, Novartis, Ono Pharma, Lilly, and lecture fees from Boehringer Ingelheim, Chugai, Lilly, MSD, Novartis, AstraZeneca, Ono Pharm. H Taniguchi received lecture fees from Boehringer Ingelheim, Chugai Pharm, MSD, AstraZeneca, GSK, Daiichi‐Sankyo, Kyorin, Kyouwahakko‐kirin. J Shindoh received lecture fees from Boehringer Ingelheim, Chugai Pharm, AstraZeneca, Ono Pharm, Eli Lilly Japan, MSD, Bristol‐Myers Squibb. Kazuhiro Asada received lecture fees from Boehringer, Chugai, Novartis, Ono Pharma, Taiho, MSD, Eli Lily, Mochida. K Imaizumi received research funding from Boehringer, MSD, Taiho. K Takahashi received lecture fees from AstraZeneca, Boehringer Ingelheim, Chugai Pharm, Eli Lily Japan, MSD, Taiho Pharma. Naoki Inui received research funding from Chugai, and lecture fees from Boehringer Ingelheim, Chugai Pharm, AstraZeneca, Ono Pharm, Taiho Pharma. Osamu Hataji received research funding from Boehringer, Chugai, Novartis, Ono Pharma, Daiichi‐Sankyo, GSK, Byer, Kyorin, and lecture fees from Boehringer Ingelheim, Chugai Pharm, Novartis, MSD, AstraZeneca, Ono Pharm, Pfizer, Kyorin. Takafumi Suda received research funding from Boehringer, Ono Pharm, and lecture fees from Boehringer Ingelheim, MSD, AstraZeneca. Teppei Yamaguchi received lecture fees from Nippon Boehringer Ingelheim, Chugai Pharm, Eli Lily Japan, MSD, AstraZeneca, Taiho Pharmaceutical, Novartis Pharma, and Bristol‐Meyers Squibb. Tomoki Kimura received lecture fees from Boehringer Ingelheim, Chugai Pharm, Novartis, MSD, AstraZeneca, Ono Pharm, Pfizer, Kyorin. Toyoaki Hida received the research fund from Chugai Pharmaceutical, MSD, Eli Lilly, Ono Pharmaceutical, Novartis, Taiho Pharmaceutical, AstraZeneca, Nippon Boehringer Ingelheim, Bristol‐Meyers Squibb, Clovis Oncology, Eisai, Takeda Bio, Dainippon Sumitomo Pharma, Abbvie, Merck Serono, Ignyta, Kissei, Kyowa Hakko Kirin, Daiichi‐Sankyo, Servier, Astellas, Bayer, Janssen, and Pfizer, and lecture fees from Chugai Pharmaceutical, MSD, Eli Lilly, Ono Pharmaceutical, Novartis, Taiho Pharmaceutical, AstraZeneca, Kissei, Nippon Boehringer Ingelheim, Pfizer, Bristol‐Meyers Squibb, and Clovis Oncology. The other co‐authors have no disclosure. This work was supported through funding from Boehringer Ingelheim Japan.
Supporting information
Fig S1
Fig S2
Fig S3
Table S1
Table S2
Table S3
Acknowledgments
We appreciate for funding by Boehringer Ingelheim Japan, and we thank the staff, patients, and their families who contributed to this research at all investigational sites. This manuscript was revised in English by Shane LeGros.
Ito K, Murotani K, Kubo A, et al. Propensity score analysis of overall survival between first- and second-generation EGFR-TKIs using real-world data. Cancer Sci. 2020;111:3705–3713. 10.1111/cas.14560
REFERENCES
- 1. Maemondo M, Inoue A, Kobayashi K, et al. Gefitinib or chemotherapy for non‐small‐cell lung cancer with mutated EGFR. N Engl J Med. 2010;362:2380–2388. [DOI] [PubMed] [Google Scholar]
- 2. Mitsudomi T, Morita S, Yatabe Y, et al. Gefitinib versus cisplatin plus docetaxel in patients with non‐small‐cell lung cancer harbouring mutations of the epidermal growth factor receptor (WJTOG3405): an open label, randomised phase 3 trial. Lancet Oncol. 2010;11:121–128. [DOI] [PubMed] [Google Scholar]
- 3. Mok TS, Wu YL, Thongprasert S, et al. Gefitinib or carboplatin‐paclitaxel in pulmonary adenocarcinoma. N Engl J Med. 2009;361:947–957. [DOI] [PubMed] [Google Scholar]
- 4. Rosell R, Carcereny E, Gervais R, et al. Erlotinib versus standard chemotherapy as first‐line treatment for European patients with advanced EGFR mutation‐positive non‐small‐cell lung cancer (EURTAC): a multicentre, open‐label, randomised phase 3 trial. Lancet Oncol. 2012;13:239–246. [DOI] [PubMed] [Google Scholar]
- 5. Wu YL, Zhou C, Liam CK, et al. First‐line erlotinib versus gemcitabine/cisplatin in patients with advanced EGFR mutation‐positive non‐small‐cell lung cancer: analyses from the phase III, randomized, open‐label, ENSURE study. Ann Oncol. 2015;26:1883–1889. [DOI] [PubMed] [Google Scholar]
- 6. Zhou C, Wu YL, Chen G, et al. Erlotinib versus chemotherapy as first‐line treatment for patients with advanced EGFR mutation‐positive non‐small‐cell lung cancer (OPTIMAL, CTONG‐0802): a multicentre, open‐label, randomised, phase 3 study. Lancet Oncol. 2011;12:735–742. [DOI] [PubMed] [Google Scholar]
- 7. Urata Y, Katakami N, Morita S, et al. Randomized phase III study comparing gefitinib with erlotinib in patients with previously treated advanced lung adenocarcinoma: WJOG 5108L. J Clin Oncol. 2016;34:3248–3257. [DOI] [PubMed] [Google Scholar]
- 8. Yang JJ, Zhou Q, Yan HH, et al. A phase III randomised controlled trial of erlotinib vs gefitinib in advanced non‐small cell lung cancer with EGFR mutations. Br J Cancer. 2017;116:568–574. [DOI] [PMC free article] [PubMed] [Google Scholar]
- 9. Sequist LV, Yang JC, Yamamoto N, et al. Phase III study of afatinib or cisplatin plus pemetrexed in patients with metastatic lung adenocarcinoma with EGFR mutations. J Clin Oncol. 2013;31:3327–3334. [DOI] [PubMed] [Google Scholar]
- 10. Wu YL, Zhou C, Hu CP, et al. Afatinib versus cisplatin plus gemcitabine for first‐line treatment of Asian patients with advanced non‐small‐cell lung cancer harbouring EGFR mutations (LUX‐Lung 6): an open‐label, randomised phase 3 trial. Lancet Oncol. 2014;15:213–222. [DOI] [PubMed] [Google Scholar]
- 11. Yang JC, Wu YL, Schuler M, et al. Afatinib versus cisplatin‐based chemotherapy for EGFR mutation‐positive lung adenocarcinoma (LUX‐Lung 3 and LUX‐Lung 6): analysis of overall survival data from two randomised, phase 3 trials. Lancet Oncol. 2015;16:141–151. [DOI] [PubMed] [Google Scholar]
- 12. Park K, Tan E‐H, O'Byrne K, et al. Afatinib versus gefitinib as first‐line treatment of patients with EGFR mutation‐positive non‐small‐cell lung cancer (LUX‐Lung 7): a phase 2B, open‐label, randomised controlled trial. Lancet Oncol. 2016;17:577–589. [DOI] [PubMed] [Google Scholar]
- 13. Paz‐Ares L, Tan EH, O'Byrne K, et al. Afatinib versus gefitinib in patients with EGFR mutation‐positive advanced non‐small‐cell lung cancer: overall survival data from the phase IIb LUX‐Lung 7 trial. Ann Oncol. 2017;28:270–277. [DOI] [PMC free article] [PubMed] [Google Scholar]
- 14. Mok TS, Cheng Y, Zhou X, et al. Improvement in overall survival in a randomized study that compared dacomitinib with gefitinib in patients with advanced non‐small‐cell lung cancer and EGFR‐activating mutations. J Clin Oncol. 2018;36:2244–2250. [DOI] [PubMed] [Google Scholar]
- 15. Wu Y‐L, Cheng Y, Zhou X, et al. Dacomitinib versus gefitinib as first‐line treatment for patients with EGFR‐mutation‐positive non‐small‐cell lung cancer (ARCHER 1050): a randomised, open‐label, phase 3 trial. Lancet Oncol. 2017;18:1454–1466. [DOI] [PubMed] [Google Scholar]
- 16. Food & Drug Administration . https://www.fda.gov/science‐research/science‐and‐research‐special‐topics/real‐world‐evidence. Accessed April 1, 2020.
- 17. Halmos B, Tan E, Soo R, et al. P1.01‐28 impact of afatinib dosing on safety and efficacy real‐world in patients with EGFR mutation‐positive advanced NSCLC. J Thorac Oncol. 2018;13:S470–S471. [Google Scholar]
- 18. Hochmair MJ, Morabito A, Hao D, et al. Sequential treatment with afatinib and osimertinib in patients with EGFR mutation‐positive non‐small‐cell lung cancer: an observational study. Future Oncol (London, England). 2018;14:2861–2874. [DOI] [PubMed] [Google Scholar]
- 19. Hochmair MJ, Morabito A, Hao D, et al. Sequential afatinib and osimertinib in patients with EGFR mutation‐positive non‐small‐cell lung cancer: updated analysis of the observational GioTag study. Future Oncol (London, England). 2019;15:2905–2914. [DOI] [PubMed] [Google Scholar]
- 20. Ramalingam SS, Vansteenkiste J, Planchard D, et al. Overall survival with osimertinib in untreated, EGFR‐mutated advanced NSCLC. N Engl J Med. 2019;382:41–50. [DOI] [PubMed] [Google Scholar]
- 21. Saito H, Fukuhara T, Furuya N, et al. Erlotinib plus bevacizumab versus erlotinib alone in patients with EGFR‐positive advanced non‐squamous non‐small‐cell lung cancer (NEJ026): interim analysis of an open‐label, randomised, multicentre, phase 3 trial. Lancet Oncol. 2019;20:625–635. [DOI] [PubMed] [Google Scholar]
- 22. Nakagawa K, Garon EB, Seto T, et al. Ramucirumab plus erlotinib in patients with untreated, EGFR‐mutated, advanced non‐small‐cell lung cancer (RELAY): a randomised, double‐blind, placebo‐controlled, phase 3 trial. Lancet Oncol. 2019;20:1655–1669. [DOI] [PubMed] [Google Scholar]
- 23. Okamoto I, Morita S, Tashiro N, et al. Real world treatment and outcomes in EGFR mutation‐positive non‐small cell lung cancer: Long‐term follow‐up of a large patient cohort. Lung Cancer (Amsterdam, Netherlands). 2018;117:14–19. [DOI] [PubMed] [Google Scholar]
Associated Data
This section collects any data citations, data availability statements, or supplementary materials included in this article.
Supplementary Materials
Fig S1
Fig S2
Fig S3
Table S1
Table S2
Table S3