Abstract
Radiation resistance is a major cause of esophageal cancer relapse or metastasis. Transcriptional coactivator with PDZ binding domain (TAZ) is a final effector of the Hippo signaling pathway and plays critical roles in several types of cancer, but how it participates in the progression and radiation resistance of esophageal cancer remains unclear. Here, we revealed that TAZ was the strongest prognostic factor among Hippo pathway members. Overexpression of TAZ predicted poor outcome and adverse pathological features. In cell and animal models, TAZ facilitated cell proliferation, motility, and radiation resistance. Additionally, TAZ promoted expression of nonhomologous end joining (NHEJ)‐related genes, which are the main contributors to repair irradiation‐induced DNA breaks and result in radiation resistance. Amplification of the TAZ gene occurred in 2.5%‐3.2% of esophageal cancers. In addition, the CpG islands of the TAZ gene were demethylated in esophageal cancer under thymine DNA glycosylase (TDG) regulation. Knockdown of TDG inhibited cell growth, motility, and radiation resistance, which were overridden by TAZ overexpression. Collectively, these findings suggest that the TDG/TAZ/NHEJ axis is a critical player in esophageal cancer progression and radiation resistance, as well as a potential target for radiotherapy.
Keywords: esophageal cancer, nonhomologous end joining, radiation resistance, TAZ, TDG
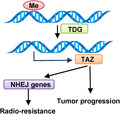
Transcriptional coactivator with PDZ binding domain (TAZ) was oncogenic in esophageal cancer. Thymine DNA glycosylase (TDG) acted as a regulator of the aberrant TAZ expression by demethylating its CpG islands, and further participated in radiation resistance by regulating expression of a broad range of nonhomologous end joining (NHEJ)‐related genes. The TDG/TAZ/NHEJ axis is a critical player in esophageal cancer progression and radioresistance, and is a potential treatment target for esophageal cancer.
1. INTRODUCTION
Esophageal cancer is the ninth most common malignancy and the sixth‐leading cause of cancer‐related mortality in the world. 1 Although improved by current comprehensive treatment regimens, the prognosis for patients with esophageal cancer is still poor; the 5‐year survival rate is only 15%‐25%, and the recurrence rate is approximately 40%, even when tumors were radically resected. 2 Radiation therapy is one of the primary treatment strategies to relieve symptoms and prolong survival. Nevertheless, radiation resistance frequently occurs and results in treatment failure in radical, perioperative, or palliative treatments. 3 Therefore, we must find specific predictive markers of radiation sensitivity and potential targets for radiation sensitization in esophageal cancer urgently.
The Hippo signaling pathway is a conserved regulator of organ size and plays essential roles in tumorigenesis and progression. 4 , 5 The final effector, transcriptional coactivator with PDZ binding domain (TAZ), is a transcription coactivator that binds with multiple transcription factors, including TBX5, PAX3, PPARs, the RUNX family, and the TEAD family. 6 , 7 , 8 , 9 , 10 It regulates many biological processes, such as cell proliferation, organ size, stem cell differentiation, anoikis resistance, and cell mitosis. 11 , 12 , 13 , 14 In cancers, TAZ was reported to be oncogenic in certain cancers and to contribute to chemotherapy resistance. 15 However, the roles of TAZ in esophageal cancer and whether TAZ is involved in radiation resistance are unknown.
Thymine DNA glycosylase (TDG) is a base excision repair enzyme with a dual role in both DNA demethylation for epigenetic stability and DNA repair for genomic stability. 16 At the epigenetic level, TDG maintains CpG islands in their unmethylated state downstream of the ten‐eleven translocation (TET) family of dioxygenases. 17 , 18 Dysregulated TDG could result in abnormal DNA methylation and pathogenic expression of oncorelated genes in cancers. 19 Whether TDG participates in dysregulation of esophageal cancer and radiation resistance is unclear.
So far, the biological role of the Hippo pathway in esophageal cancer pathogenesis and radiation resistance remains unclear. In the present study, we screened all components of the Hippo pathway and identified that TAZ was the strongest risk factor for esophageal cancer prognosis. As a result, we focused on the functions of TAZ in tumor progression and radiation resistance in esophageal cancer. In addition, we identified TDG as a regulator of aberrant TAZ expression and nonhomologous end joining (NHEJ)‐related genes as potential participants in TAZ‐induced radiation resistance.
2. MATERIALS AND METHODS
2.1. Cell culture and transfection
Eca‐109, Kyse‐150, and TE‐1 cell lines were obtained from the Cell Bank of the Chinese Academy of Sciences. The transient overexpressing pCMV2‐GV146 plasmid containing TAZ, siRNAs against TAZ (siTAZ1, GUACUUCCUCAAUCACAUA; siTAZ2, CUAGGAAGGCGAUGAAUCA), and lentivirus containing three shRNAs against TDG (shTDG, ATCCATGCAGCAGTGAACCTT) were purchased from Shanghai Genechem. Lentivirus containing TAZ and the empty vector were purchased from GenePharma. Transfection was carried out as described previously. 20
2.2. Clinical samples
The clinical part of this study was approved by the Medical Ethical Committee of Qilu Hospital, Shandong University. Paraffin‐embedded esophageal cancer tissues were deposited in the Department of Pathology, Qilu Hospital of Shandong University.
2.3. Immunohistochemistry
Immunohistochemistry was undertaken using the Enhanced Polymer Assay Kit (PV‐9001; ZSGB‐BIO) following the manufacturer’s protocol. The concentration of anti‐TAZ Ab (Abcam) was 1:50. Three researchers, including one pathologist, independently evaluated the staining results. According to staining intensities, the results were scaled as negative (−), weak (+), moderate (++), and strong staining (+++).
2.4. Cell proliferation
We seeded 5 × 10³ cells into each well of a 24‐well plate in triplicate and cultured them for 1‐6 days. Cells were trypsinized and converted to a single cell suspension to calculate cell numbers with a hemocytometer (Qiujing). Cell growth curves were constructed according to cell numbers.
2.5. Colony formation
Cells were prepared in single cell suspension and transferred to 24‐well plates with 2000 cells/well in triplicate. Cells were cultivated for 14 days until visible cell colonies formed. After fixing with methanol and staining with 0.1% crystal violet (Beyotime), colonies were photographed and manually counted.
2.6. Wound healing
Straight lines were drawn gently on cells by a standard 200‐µL pipette tip. Detached cells were washed away by PBS. The lines were photographed and measured under the microscope at 0, 24, 48, and 72 hours post‐scratch.
2.7. Invasion assay
We covered the upper chambers of a Transwell system (Corning) with Matrigel (BD Biosciences) and added 1 × 10⁵ cells in 200 µL serum‐free medium. To the lower chambers, we added 500 µL medium containing 20% FBS (Gibco) as a chemoattractant. After 48 hours, the invaded cells were fixed with methanol, stained with 0.1% crystal violet, and observed under a microscope.
2.8. Irradiation
Irradiation was undertaken using a linear accelerator (Varian) at a dose rate of 300 MU/minute in Qilu Hospital of Shandong University. Cells were exposed to different doses (0‐10 Gy) of radiation the day after inoculation. Mice were exposed to 4 Gy X‐rays every other day when the diameter of tumor xenografts reached 0.5 cm.
2.9. Cell viability detection
Cell suspensions were added to 96‐well plates at a density of 1 × 10⁴ cells/well. After 24 hours, cells received varying doses of irradiation (0, 2, 4, 6, and 10 Gy) and were cultured for 48 hours. Cells were incubated with 10 µL CCK‐8 reagents and 100 µL medium for 1 hour. Absorption at 450 nm was measured by an automatic microplate reader (Bio‐Rad), and the fraction of viable cells was calculated based on the optical density value. Experiments were repeated at least three times.
2.10. Flow cytometry
Cells were seeded in 6‐well plates by 4 × 10⁵ cells/well and irradiated with 6 Gy X‐rays when confluence reached 60%‐70%. After 24 hours of incubation, cells were harvested and stained with an Annexin‐V‐APC/PI Staining Kit (BestBio) following the manufacturer’s protocol. Data analysis was carried out using FlowJo software (Tree Star).
2.11. Immunofluorescence
Cells at 2, 6, 12, or 24 hours post‐irradiation were fixed by paraformaldehyde, preformatted by 0.1% Triton X‐100, blocked by goat serum, and incubated with anti‐γ‐H2AX (Cell Signaling Technology) and the secondary Ab. Cells were photographed after DAPI staining and analyzed by ImageJ.2.12.
2.12. Animal studies
All animal procedures were carried out according to the guidelines of the Association for Assessment and Accreditation of Laboratory Animal Care International. Two‐month‐old BALB/c male nude mice were purchased from Vital River. For tumor growth assays, mice were randomly assigned (n = 6 for each group) and s.c. inoculated with 2 × 10⁷ cells. Mice were killed 16 days post‐injection. Tumor volumes were calculated as (length × width2)/2.
For radiation resistance assays, control cells (n = 6) were injected 2 days before TAZ‐overexpressing TE‐1 cells (n = 6). When they showed similar average sizes, tumor volume‐matched mice were divided into two subgroups (n = 3 for each); one group received irradiation and the other did not.
2.13. DNA methylation analysis
Genomic DNA was extracted by a genomic DNA extraction kit (Tiangen Biotech) and incubated with McrBC (New England Biolabs) or solvent at 37°C for 2 hours. After a PCR reaction, the PCR products were semiquantified by 1.5% agarose gel electrophoresis. The primers of TAZ CpG islands were designed by MethPrimer and annotated with CpG1 to 5 (https://www.urogene.org/methprimer/), with the following sequences: CpG1‐forward (F), TGGACCCTGTGTCAAACAAA; CpG1‐reverse (R), GACCGACTGTCGCAAAGC; CpG2‐F, AGTCAGGGGCCAGTGTCTC; CpG2‐R, GGTCCAGAAGCAGCTGTAGG; CpG3‐F, TGCTTCTGGACCAGTGAGTG; CpG3‐R, TACAGCACCTCCCTGTTGTG; CpG4‐F, CACAACAGGGAGGTGCTGTA; CpG4‐R, GAAGGGGTTTGTTCTGACGA; CpG5‐F, TGGGGGTTGGACATAGGATA; CpG5‐R, GTCAGCAGAGCAGGAACCTC; and the control primers (Ctr_F, CTCACCGGATGCACCAATGTT; Ctr_R, CGCGTTGCTCACAATGTTCAT).
2.14. Graphs and statistics
Scatter plots were graphed by ImageGP (http://www.ehbio.com/ImageGP). Flow cytometer plots were graphed by FlowJo version 10 (Tree Star). Other plots and all statistical analyses were undertaken using GraphPad Prism6. Differences between groups were analyzed by Student’s t test. Univariate analyses were carried out by χ2 tests. Survival data were compared by log rank tests. A P value less than .05 was considered statistically significant.
3. RESULTS
3.1. Overexpression of TAZ associated with poor outcomes in esophageal cancer
To identify the key Hippo pathway molecules in esophageal cancer, we first analyzed the prognostic values of the main components of this pathway in The Cancer Genome Atlas (TCGA) esophageal carcinoma (ESCA) datasets by Cox regression (Figure 1A). The membrane protein DCHS2 (Cox coefficient = −0.378) and the final effector YAP1 (Cox coefficient = −0.426) negatively correlated with survival time, whereas TAZ positively correlated with prognosis (Cox coefficient = 0.297; Figure 1A). Thus, we chose TAZ for further investigation. Pan‐cancer analysis indicated that TAZ also has a significant prognostic role in kidney cancer (Cox coefficient = 0.394) and cervical carcinoma (Cox coefficient = −0.381) (Figure 1B).
FIGURE 1.
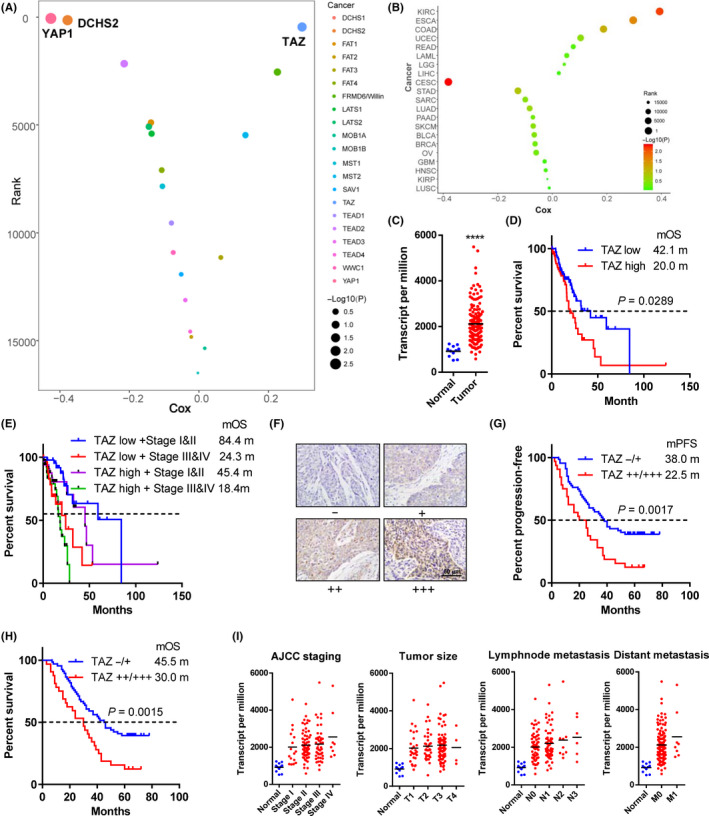
Transcriptional coactivator with PDZ binding domain (TAZ) is overexpressed and associated with poor outcomes in esophageal cancer. A, Correlations of Hippo pathway members with survival time in patients with esophageal cancer. X‐axis, Cox coefficients; y‐axis, gene rank among total genes in esophageal cancer. Dot size represents the value of –Log(P value). B, Pan‐cancer analysis of prognostic values of TAZ. C, TAZ mRNA level in tumor and normal tissues. D, E, Kaplan‐Meier curves of survival data in patients with different TAZ expression (D) and TAZ‐American Joint Committee on Cancer (AJCC) staging combination (E). F, Representative immunohistochemical staining of TAZ in esophageal cancer samples with intensities −, +, ++, and +++ (200×). G, H, Kaplan‐Meier curves of recurrence (G) and survival data (H) in our patient cohort with TAZ (++/+++) vs (−/+) staining. I, TAZ mRNA levels in normal and tumor tissues. Tumor samples were sub‐grouped according to AJCC staging, T staging, N staging, and M staging. Data in A‐E and I were derived from The Cancer Genome Atlas databases. Log rank tests were used to compare survival data in D, E, G, and H. ****P < .0001
The TCGA databases showed that TAZ expression was significantly upregulated in esophageal cancer compared to normal tissues (Figure 1C). Survival analysis showed that patients with high TAZ expression had a higher risk of death (hazard ratio [HR] = 1.747) and a shorter median overall survival (mOS, 20.0 vs 42.1 months) than those with low TAZ expression (Figure 1D). The combination of TAZ expression and the American Joint Committee on Cancer (AJCC) staging showed a better prediction effect. For example, among patients with stage I or II disease, those with low TAZ expression have a mOS almost twice as long as patients with high TAZ expression (84.4 months vs 45.4 months, respectively; Figure 1E).
To further explore the prognostic role of TAZ, we undertook immunohistochemical staining of 99 patients from our esophageal cancer cohort (Figure 1F). Patients with TAZ (++/+++) staining showed a high risk of progression (HR = 2.092; Figure 1G) and death (HR = 2.123; Figure 1H). The median progression‐free survival and mOS in patients with TAZ (++/+++) expression were only 22.5 and 30.0 months, whereas those of other patients were up to 38.0 and 45.0 months.
3.2. Overexpression of TAZ associated with adverse pathological features of esophageal cancer
To further determine the clinical relevance of TAZ, the correlation between TAZ expression and clinical/pathological features were examined. TAZ expression correlated with AJCC stage (P = .0157), T stage (P = .0409), N stage (P = .0247), and differentiation (P = .0028; Table 1). By contrast, no significant correlation was found between TAZ level and gender, age, smoking, or drinking history.
TABLE 1.
Transcriptional coactivator with PDZ binding domain (TAZ) expression correlates with clinicopathological features in esophageal cancer
| Number a | TAZ expression a | P value b | ||
|---|---|---|---|---|
| Low (n = 67) | High (n = 32) | |||
| Age (y) | ||||
| <65 | 50 (50.5) | 34 (68.0) | 16 (32.0) | .8844 |
| ≥65 | 49 (49.5) | 33 (67.3) | 16 (32.7) | |
| Gender | ||||
| Female | 35 (35.4) | 26 (74.3) | 9 (25.7) | .4151 |
| Male | 64 (64.6) | 41 (64.1) | 23 (35.9) | |
| Smoking | ||||
| No | 42 (42.4) | 31 (73.8) | 11 (26.2) | .3668 |
| Yes | 57 (57.6) | 36 (63.2) | 21 (36.8) | |
| Drinking | ||||
| No | 49 (49.5) | 36 (73.5) | 13 (26.5) | .3149 |
| Yes | 50 (50.5) | 31 (62.0) | 19 (38.0) | |
| Differentiation | ||||
| Well | 40 (40.4) | 29 (72.5) | 11 (27.5) | .0028** |
| Moderate | 28 (28.3) | 24 (85.7) | 4 (14.3) | |
| Poor | 31 (31.3) | 14 (45.2) | 17 (54.8) | |
| T stage | ||||
| T1 | 10 (10.1) | 9 (90.0) | 1 (10.0) | .0409* |
| T2 | 38 (38.4) | 29 (76.3) | 9 (23.7) | |
| T3 | 33 (33.3) | 21 (63.6) | 12 (36.4) | |
| T4 | 18 (18.2) | 8 (44.4) | 10 (55.6) | |
| N stage | ||||
| N0 | 38 (38.4) | 32 (84.2) | 6 (15.8) | .0247* |
| N1 | 21 (21.2) | 13 (61.9) | 8 (38.1) | |
| N2 | 30 (30.3) | 15 (50.0) | 15 (50.0) | |
| N3 | 10 (10.1) | 7 (70.0) | 3 (30.0) | |
| AJCC stage | ||||
| I | 11 (11.1) | 9 (81.8) | 2 (18.2) | .0157* |
| II | 26 (26.3) | 23 (88.5) | 3 (11.5) | |
| III | 40 (40.4) | 24 (60.0) | 16 (40.0) | |
| IV | 22 (22.2) | 11 (50.0) | 11 (50.0) | |
Abbreviation: AJCC, American Joint Committee on Cancer.
Data are presented as number (%).
P values calculated by the χ2 test or Fisher’s exact test.
P < .05.
P < .01.
We also investigated the differential expression of TAZ in esophageal cancer patients with different stages in TCGA datasets. Patients with all pathological features had relatively higher TAZ expression than normal controls (Figure 1I). The TAZ expression increased gradually from stage I to IV, from T1 to 3, from N0 to 3, and from M0 to 1, but the differences did not reach statistical significance (Figure 1I).
3.3. Esophageal cancer growth and motility promoted in vitro and in vivo
Based on the relative expression level (Figure 2A), ectopic expression of TAZ was established in TE‐1 cells using lentivirus (Figure 2B). Overexpression of TAZ stimulated cell proliferation (P < .05 from day 2; Figure 2C) and colony formation (P = .0045; Figure 2D). Overexpression of TAZ also promoted migratory ability in wound healing assays (P = .0173 after 24 hours and .0017 after 48 hours; Figure 2E) and invading ability in Transwell assays (170 vs 96 cells on average, P = .0087; Figure 2F).
FIGURE 2.
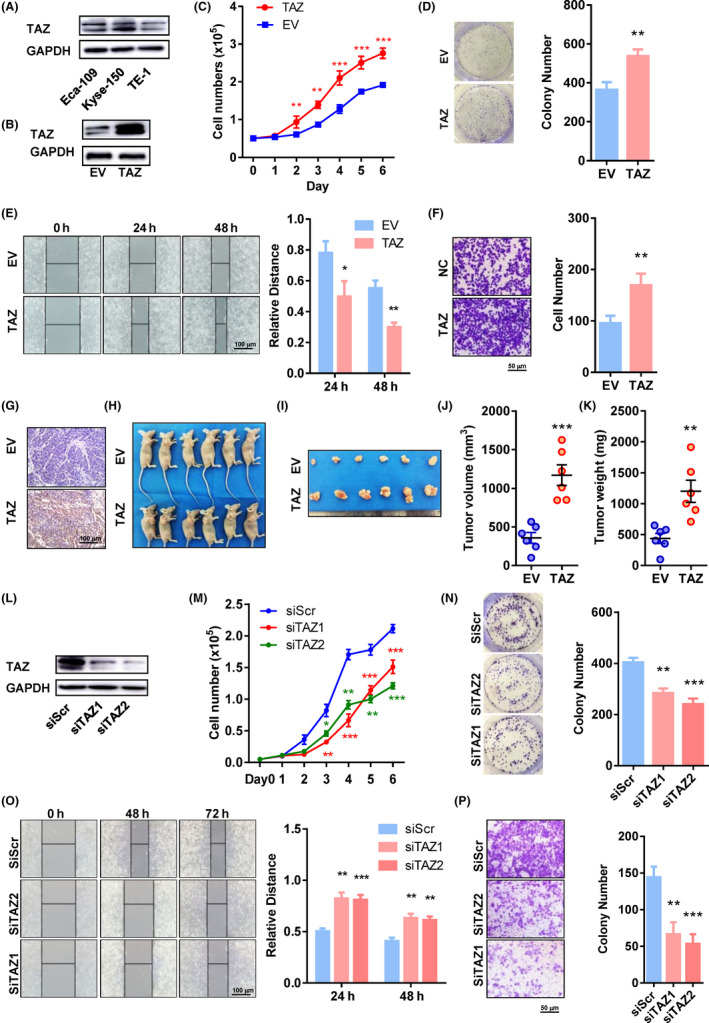
Transcriptional coactivator with PDZ binding domain (TAZ) promotes cell proliferation and mobility in vitro and in vivo. A, Protein levels of TAZ in Eca‐109, Kyse‐150, and TE‐1 cell lines. B, Protein levels of TAZ in TAZ‐overexpressing and control TE‐1 cells. C, Proliferation curves of TAZ‐overexpressing and control cells. D‐F, Colony formation (D), wound healing (E), and invasion assays (F) of TAZ‐overexpressing and control cells. Representative pictures are shown on the left, and quantification histograms on the right. G, Immunohistochemical staining of TAZ in tumors derived from TAZ‐overexpressing and control cells (200×). H, I, Photographs of mice (H) and tumors (I) 3 wk post‐injection of tumor cells. J, K, Volumes (J) and weights (K) of xenografts 3 wk post‐injection of tumor cells. Each dot represents one sample. L, Protein levels of TAZ in TAZ‐depleted and control Kyse‐150 cells. M, Proliferation curves of TAZ‐overexpressing and control cells. N‐P, Colony formation (N), wound healing (O), and invasion assays (P) of TAZ‐depleted and control cells. Representative pictures are shown on the left, and quantification histograms on the right. *P < .05, **P < .01, ***P < .001. EV, empty vector; siScr, scramble siRNA; siTAZ1/2, siRNA against TAZ mRNA 1/2; TAZ, lentivirus containing TAZ
We further evaluated the effect of TAZ on tumor growth in animals. Overexpression of TAZ was verified by immunohistochemistry (Figure 2G). Palpable tumors were identified in all mice, with or without TAZ overexpression (Figure 2H). Tumors with TAZ overexpression were remarkably bigger (1171.0 vs 358.0 mm3, P = .0003; Figure 2I‐J) and heavier (1202.0 vs 437.6 mg, P = .0032; Figure 2K).
Expression of TAZ was also downregulated in Kyse‐150 cells using two different siRNAs targeting TAZ mRNA (Figure 2L). As expected, TAZ downregulation by both siRNAs impaired cell proliferation (P < .05 from day 2; Figure 2M) and colony formation (P = .0081 and 0.0016; Figure 2N). In addition, the TAZ‐depleted Kyse‐150 cells had inferior ability to migrate in wound healing assays (P = .0010 and .0006, respectively, at 24 hours; P = .0019 and 0.0018, respectively, at 48 hours) and Transwell assays (P = .0033 and .0012).
3.4. Radiation resistance of esophageal cancer cells promoted by TAZ
To explore the role of TAZ in radiation resistance of esophageal cancer, cells with different levels of TAZ were subjected to X‐ray irradiation, and their viability was examined 24 hours later. Irradiation had a dose‐dependent inhibitory effect on cell viability of all cells (Figure 3A,B). The TAZ‐overexpressing TE‐1 cells showed higher survival rates than control cells after irradiation (all P < .05; Figure 3A). Accordingly, TAZ‐depleted cells by both siRNA showed inferior survival ability compared to control cells when irradiated (all P < .05; Figure 3B).
FIGURE 3.
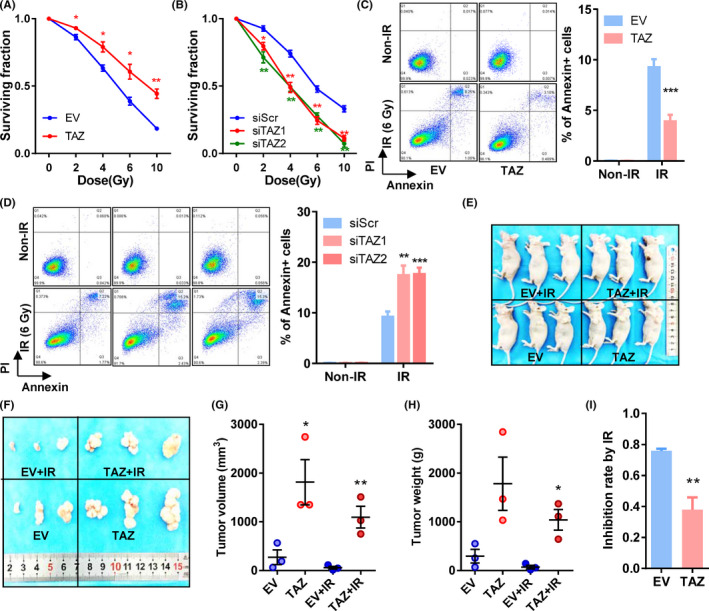
Transcriptional coactivator with PDZ binding domain (TAZ) overexpression is associated with radiation resistance in esophageal cancer cells. A, B, Cell surviving fractions of TAZ‐overexpressing cells (A), TAZ‐depleted cells (B), and their respective control cells. C, D, Apoptotic assays of TAZ‐overexpressing cells (C), TAZ‐depleted cells (D), and their respective control cells post‐irradiation (6 Gy). Left panels, representative pictures; right panels, quantifications of annexin‐positive cells. E, F, Photographs of mice (E) and tumors (F) with or without irradiation. G, H, Volume (G) and weight (H) of xenografts with or without irradiation. Each dot represents one sample. I, Inhibition rate of irradiation on xenograft tumors. Inhibition rate = 1 − tumor weight with irradiation / tumor weight without irradiation. Mean ± SD of at least three independent experiments. *P < .05, **P < .01, ***P < .001. EV, empty vector; IR, irradiation; siScr, scramble siRNA; siTAZ1/2, siRNA against TAZ mRNA 1/2; TAZ, plasmid containing TAZ
Then we tested the irradiation‐induced apoptosis. Overexpression of TAZ decreased apoptotic cells (annexin‐positive) after irradiation with 6 Gy (P = .0008; Figure 3C). Downregulation of TAZ increased apoptotic cells after radiation in Kyse‐150 cells (P = .0029 and P = .0010; Figure 3D).
We further examined TAZ and radioresistance in animal models (Figure 3E,F). In both TAZ‐overexpressing and control cells, irradiation reduced tumor volumes and weights (Figure 3F‐H). When inhibition rates (1 – tumor weight with irradiation / tumor weight without irradiation) were considered, the inhibitory effects of radiation were reduced in TAZ‐overexpressing tumors (P = .0090; Figure 3I).
3.5. Expression of multiple genes involved in NHEJ promoted by TAZ
The dysregulated double‐strand break (DSB) repair is a principal cause of radioresistance, and NHEJ is its most crucial mechanism. 21 To elucidate the association between TAZ and DSB repair, we examined the dynamic levels of γ‐H2AX, a hallmark of DSB, post‐irradiation. Overexpression of TAZ significantly reduced the γ‐H2AX signals within 12 hours post‐irradiation, whereas downregulation of TAZ produced the opposite effect (Figure 4A,B). We undertook an in silico analysis on expression data of 25 NHEJ‐associated genes derived from the TCGA database. Among them, 20 correlated positively with TAZ expression (correlation coefficient > 0.16 and false discovery rate (FDR) < 0.05; Figure 4C). The top 10 TAZ‐correlated genes are shown in Figure 4D. The average correlation coefficients of TAZ with NHEJ‐associated genes are significantly higher than those with all the other mRNAs (Figure 4E).
FIGURE 4.
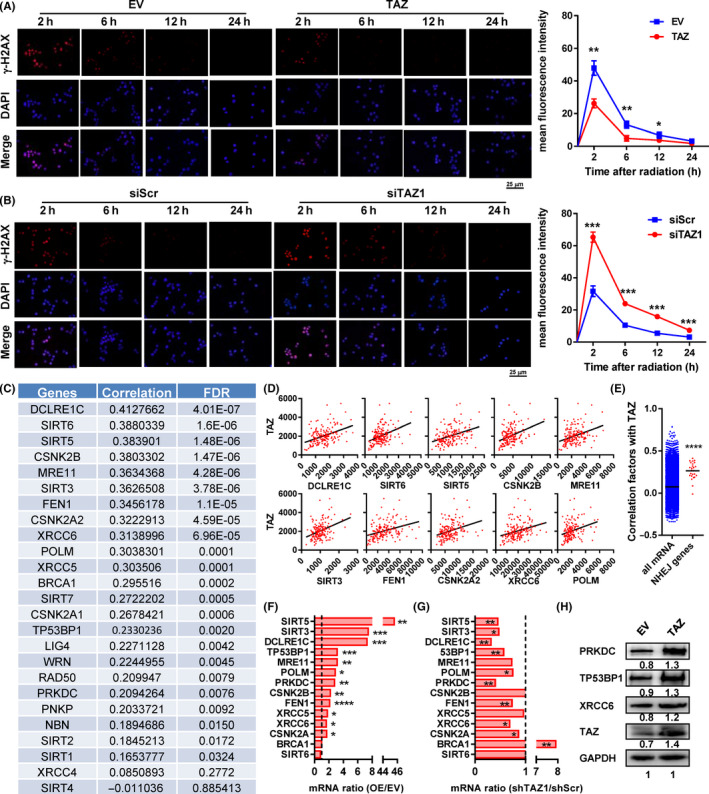
Transcriptional coactivator with PDZ binding domain (TAZ) promoted the expression of multiple genes involved in nonhomologous end joining (NHEJ). A, B, Dynamic levels of γ‐H2AX in TAZ‐overexpressing TE‐1 (A) and TAZ‐depleted Kyse‐150 (B) cells 2, 6, 12, and 24 h post‐irradiation. C, D, Correlation between TAZ and NHEJ‐associated genes in esophageal cancer sequencing data. C, Correlation factors of all genes. D, Correlation between TAZ (y‐axis) and 10 TAZ‐correlated NHEJ genes. E, Correlation coefficients between mRNA levels of NHEJ‐associated genes/all the other genes and those of TAZ. F, G, Fold change of mRNA of 12 NHEJ‐associated genes in TAZ‐overexpressing (F) and TAZ‐depleted cells (G) to their corresponding control cells. H, Protein levels of PRKDC, TP53BP1, and XRCC6 in TAZ‐overexpressing cells. Data in C‐E were derived from The Cancer Genome Atlas esophageal cancer mRNA expression data. Data in F and G were derived from RT‐PCR results in vitro. *P < .05, **P < .01, ***P < .001, ****P < .0001. EV, empty vector; FDR, false discovery rate; OE, TAZ‐overexpressing; siScr, scramble siRNA; siTAZ1/2, siRNA against TAZ mRNA1/2; TAZ, plasmid containing TAZ
To validate this, we undertook RT‐PCR and found 12 of 14 NHEJ‐associated genes were upregulated in TAZ‐overexpressed cells (Figure 4F). Nine of 12 genes were downregulated in the TAZ‐depleted cells (Figure 4G). These genes overlapped well with each other. The results of three important components of the NHEJ pathway, including TP53BP1, PRKDC, and XRCC6, were also confirmed by western blot analysis (Figure 4H).
3.6. Thymine DNA glycosylase is an upstream regulator of TAZ by DNA methylation
To find the mechanisms that account for TAZ overexpression in esophageal cancer, we used the TCGA ESCA cohort to screen regulators of miRNA level, DNA mutation and copy number variation levels, and DNA methylation level. No specific TAZ‐targeting miRNAs were found to correlate significantly with TAZ expression. In two cohorts containing esophageal cancer, 2.5%‐3.2% of them showed TAZ gene amplification, and only 0.17%‐0.53% of them showed TAZ deletion (Figure 5A). The mRNA levels in cancers with TAZ amplification were significantly higher than those in cancers with TAZ diploids (P = .0098; Figure 5B).
FIGURE 5.
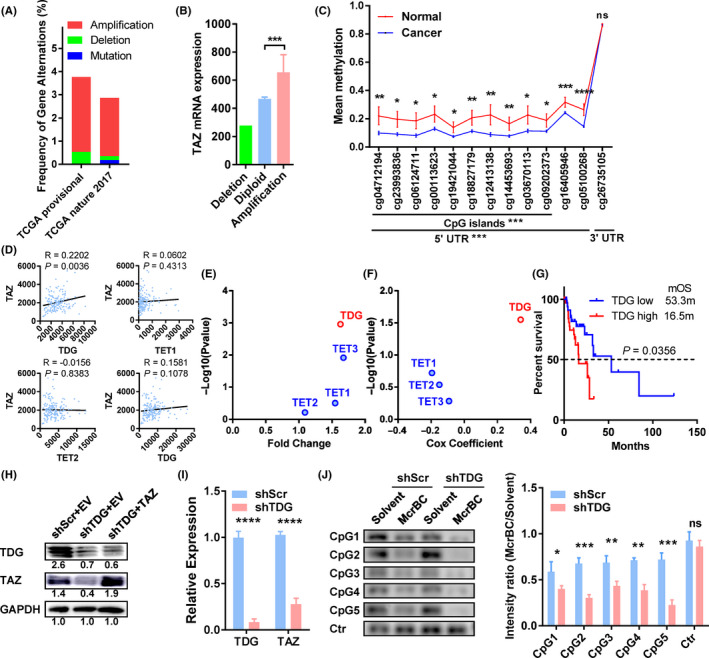
Thymine DNA glycosylase (TDG) regulates transcriptional coactivator with PDZ binding domain (TAZ) expression by DNA methylation of its CpG islands. A, Genetic changes in gastric cancer cohorts from The Cancer Genome Atlas (TCGA) provisional dataset (esophageal cancer [ESCA], n = 186) and TCGA nature 2017 dataset (esophageal/stomach cancer, n = 556). B, TAZ mRNA levels of esophageal cancer with different DNA copy numbers. C, Methylation rates of DNA around the TAZ gene in esophageal cancer and normal tissues. Probes and their locations are shown along the x‐axis. D, Correlation of TAZ mRNA (y‐axis) with demethylase mRNA (x‐axis) in esophageal cancer. E, Fold change of demethylases in esophageal tumor vs normal tissues (x‐axis), with P values indicated on the y‐axis. F, Association of demethylases with survival in esophageal cancer patients. G, Kaplan‐Meier curve of patient survival compared to their TDG expression. H, Protein levels of TDG and TAZ in the indicated cells. Results were quantified by ImageJ and shown below the bands. I, TDG and TAZ mRNA levels in TDG‐depleted and control cells. J, McrBC‐PCR results with five primers targeting the CpG islands of the TAZ gene in TDG‐depleted and control (Ctr) cells. Representative pictures are shown on the left, and quantification bars on the right. Data in A and B were extracted from cBioPortal. Data in C‐G were derived from TCGA ESCA methylation data, mRNA expression data, and clinical data. Data in H‐J resulted from in vitro studies. *P < .05, **P < .01, ***P < .001, ****P < .0001. EV, empty vector; ns, no significance; shScr, lentivirus containing scramble shRNA; shTDG, lentivirus containing shRNA against TDG; TAZ, plasmid containing TAZ
With respect to DNA methylation, we found extensive downregulation of DNA methylation in the CpG islands and 5′‐UTR of the TAZ gene in tumors compared to normal tissues (P < .05 for all probes; Figure 5C). In contrast, methylation levels in the 3′‐UTR showed no significant difference between tumor and normal tissues (Figure 5C). As a control, we did not observe significant changes in methylation of the CpG islands near the YAP gene (data not shown).
To seek regulators of the increased demethylation in TAZ CpG islands, we screened demethylases (TDG, TET1, TET2, and TET3) in the TCGA cohort and identified that TDG expression significantly correlated with TAZ (P = .0036, R = 0.2202; Figure 5D). In addition, TDG was differentially expressed in esophageal cancers (Figure 5E) and correlated with patient prognosis (Figure 5F). The TDG‐high patients showed increased risk of death compared to TDG‐low patients (HR = 2.129, P = .0356; Figure 5G). In contrast, TET1, TET2, or TET3 did not show such features (Figure 5D‐F).
To verify the regulatory role of TDG, we used a lentivirus to reduce TDG expression in esophageal cancer cells. Downregulation of TDG remarkably repressed TAZ expression at protein (Figure 5H) and RNA levels (Figure 5I). In addition, we applied McrBC, an endonuclease that cleaves DNA containing methylcytosine, to detect the methylation modification in the CpG islands of the TAZ gene. Compared to control cells, TDG‐depleted cells showed less PCR product from the CpG islands of TAZ, indicating an overmethylated modification in this region in TDG‐depleted cells (Figure 5J).
3.7. Tumor suppression mediated by TDG knockdown is reversed by TAZ overexpression
To test whether TDG promotes tumor progression by TAZ, we undertook rescue experiments by reintroducing the TAZ‐overexpressing plasmid (Figure 5H). Knockdown of TDG significantly impeded cell growth (all P < .05 from day 2, Figure 6A), whereas TAZ overexpression counteracted this effect (Figure 6A). Similarly, TDG downregulation also impaired colony formation (855.3 vs 307.3, P = .0011; Figure 6B) and invasion in Matrigel (162.3 vs 67.0, P = .0050; Figure 6B). Overexpression of TAZ completely rescued the anchorage‐independent growth and invasion caused by TDG knockdown (all P > .05; Figure 6B,C).
FIGURE 6.
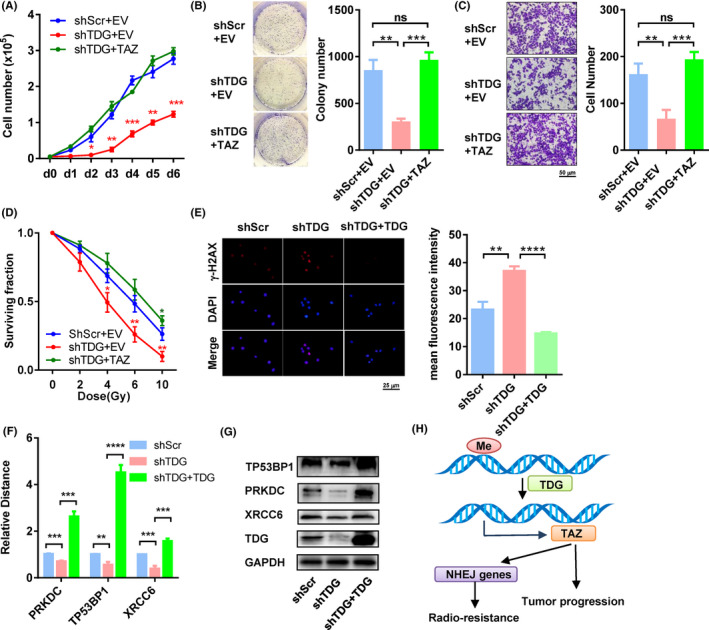
Thymine DNA glycosylase (TDG)‐KO‐mediated tumor suppression is reversed by transcriptional coactivator with PDZ binding domain (TAZ) overexpression. A, Proliferation curves of cells expressing control vector, lentivirus containing shRNA against TDG (shTDG), and shTDG + TAZ. B, C, Colony formation assays (B) and invasion assays (C) of cells expressing control vector, shTDG, and shTDG + TAZ. Representative pictures are shown on the left, and quantification histograms on the right. D, Cell surviving fractions of cells expressing control vector, shTDG, and shTDG + TAZ under irradiation. E, γ‐H2AX levels in cells with shTDG and shTDG + TDG 6 h post‐irradiation. F, G, mRNA (F) and protein (G) levels of PRKDC, TP53BP1, and XRCC6 in cells with shTDG and shTDG + TDG. H, Model of TDG‐regulated TAZ in tumor progression and radioresistance in esophageal cancer. *P < .05, **P < .01, ***P < .001, ****P < .0001. EV, empty vector; Me, methylation; NHEJ, nonhomologous end joining; ns, no significance; shScr, lentivirus containing scramble shRNA; TAZ, plasmid containing TAZ; TDG, plasmid containing shTDG‐resistant TDG
In addition, TDG downregulation also decreased survival rates of cells exposed to radiation (4‐10 Gy, all P < .05; Figure 6D). Overexpression of TAZ completely rescued this effect and resulted in even better survival than the TDG‐depleted cells when treated with 10 Gy (0.26 vs 0.36, P = .0460; Figure 6D). Knockdown of TDG significantly elevated the level of γ‐H2AX at 6 hours post‐irradiation, indicating a deficient DSB repair (Figure 6E). In addition, TDG knockdown also reduced levels of several key NHEJ components, including PRKDC (DNA‐PKcs), TP53BP1 (53BP1), and XRCC6 (Ku80) (Figure 6F,G). These effects of TDG knockdown on NHEJ were further validated by complementation experiments using an shTDG‐resistant TDG plasmid (Figure 6E‐G).
4. DISCUSSION
Hippo pathway dysregulation occurs in a broad range of human carcinomas and treatment resistance. 22 In this study, we uncovered the vital role of TAZ in esophageal cancer. To date, we are the first to systematically report the oncopromoting roles of TAZ in esophageal carcinoma. Indeed, these data are plausible because TAZ was reported to be an oncogene in other cancers. 23 Interestingly, YAP, the other final effector of the Hippo pathway and an oncogene, correlated with a better prognosis in our analysis. Usually, TAZ and YAP are coregulated and function synergistically. 24 However, some studies have reported that TAZ and YAP show different functional roles during cancer progression, especially when they are altered at transcriptional levels. 25 In this case, the mechanisms underlying the association between YAP and patient prognosis need to be elucidated in esophageal cancer.
Downregulation of TAZ inhibited tumor progression and enhanced the radiosensitivity of tumor cells. Therefore, it is likely that TAZ inhibitors would augment radiotherapy for esophageal cancer. So far, several inhibitors have been discovered or synthesized, such as an FDA‐approved drug verteporfin 26 and a peptide mimicking VGLL4. 27 , 28 However, all of the above inhibitors target the functions of both TAZ and YAP, and no TAZ‐specific inhibitor has yet been discovered.
Because the mechanisms of TAZ’s oncopromoting roles have been well documented, 23 we focused on the mechanism of TAZ‐mediated radiation resistance and identified upregulation of many NHEJ proteins by TAZ overexpression. The irradiation‐induced DSB is particularly genotoxic, and the primary tumor‐killing mechanism caused by radiotherapy. 29 The NHEJ pathway, instead of homologous recombination, is the predominant pathway for repair of DSBs and altering this pathway would influence the radiosensitivity of an affected tumor. 29 For example, mutations in the tyrosine kinase domain of epidermal growth factor receptor could contribute to cellular radiosensitivity by delaying NHEJ in non‐small‐cell lung cancer. 30 Similarly, cervical carcinoma with radioresistance showed overexpression of many NHEJ proteins, including DNA‐PKcs, Ku70, and Ku86, with undefined reasons. 31 Both TAZ and its downstream NHEJ molecules could be used as predictive markers to identify which patients might benefit from radiotherapy in radical, perioperative, or palliative treatment. Future investigations should confirm this in clinical cohorts from preirradiation tumor biopsies. Of note, BRCA1, a central regulator of homologous recombination competing with NHEJ, was upregulated by TAZ knockdown. This implies that TAZ might also be involved in the regulation of homologous recombination, probably by inhibiting this pathway, but this supposition needs further validation.
Transcriptional coactivator with PDZ binding domain is regulated at multiple levels. 23 First, subcellular localization or activity are regulated by phosphorylation (by the Hippo pathway, GSK3, c‐Abl, and Cdk1). 8 , 14 , 32 , 33 At the mRNA level, TAZ expression efficiency is regulated by multiple microRNAs (miRNAs), including miR‐125a‐5p, miR‐9‐3p, and miR‐141. 34 , 35 , 36 In addition, TAZ proteins can be negatively regulated by ubiquitination‐mediated degradation. 32 Dysregulation of TAZ at these levels could occur in different types of cancer. In addition, we found there were always two bands in western blot analyses of TAZ, and both of them were affected by TAZ plasmid or siRNA transfection, indicating this is probably due to posttranslation modification, but not alternative splicing.
In this study, we discovered two new layers of TAZ regulation. First, TAZ gene amplification was found in 2.5%‐3.2% of esophageal cancer and was significantly associated with elevated levels of TAZ mRNA. Second, TDG repressed methylation levels at the 5’‐UTR of the TAZ gene and TAZ expression in tumors. Ectopic expression of TAZ counteracted the effects of TDG KO in tumor suppression. Moreover, we found TDG overexpression in esophageal cancer as well as its remarkable association with patient prognosis. A recent study revealed that TDG is also required for melanoma proliferation and survival, potentially by epigenetic modification and by disrupting DNA repair. 19 The TDG inhibitors, including closantel, juglone, and cefixime, were also identified by high‐throughput screening. 19 Furthermore, p53 regulated TDG transcription in response to DNA damage, 37 so radiotherapy‐induced DNA damage could further activate the TDG/TAZ/NHEJ axis and induce radioresistance in post‐irradiated tumors. The dual roles of TDG in oncopromotion and radioresistance indicate that TDG might represent another target for esophageal therapy. In addition, it will also be interesting to explore the effects of combinations of targeting TDG and TAZ or radiotherapy in esophageal cancer.
In summary, we identified that the TDG/TAZ/NHEJ axis is a critical player in esophageal cancer progression and radioresistance, and is a potential target for therapy. Further experiments will address the regulation of TDG expression in more detail, the participation of the NHEJ molecules in radioresistance, verification of this regulation axis in clinical samples, and the efficacy of TDG/TAZ targeting in vivo.
ETHICAL STATEMENT
The protocol for the research project was approved by the Medical Ethical Committee of Shandong University Qilu Hospital and it conforms to the provisions of the Declaration of Helsinki. The animal study was approved by the Animal Ethical Committee of Qilu Hospital of Shandong University.
CONFLICT OF INTEREST
The authors have no conflict of interest.
ACKNOWLEDGMENTS
This study was funded by the National Natural Science Foundation of China (81601999 to Lin Zhang and 81773228 to Yufeng Cheng), Postdoctoral Science Foundation of China (2018M640637 to Lin Zhang), and Special Fund for Taishan Scholar Project (ts20190973 to Yufeng Cheng). Alexandra Marshall (Marshall Medical Communications, Canada) and Dr Jixin Dong (Nebraska Medical Center, USA) provided editorial assistance during preparation of this manuscript. Dr Peng Su (Qilu Hospital of Shandong University) provided assistance in diagnosis and analysis of immunohistochemical specimens.
Zhou W, Zhang L, Chen P, Li S, Cheng Y. Thymine DNA glycosylase‐regulated TAZ promotes radioresistance by targeting nonhomologous end joining and tumor progression in esophageal cancer. Cancer Sci. 2020;111:3613–3625. 10.1111/cas.14622
Zhou and Zhang contributed equally to this work.
Funding information
National Natural Science Foundation of China (Grant/Award Numbers: 81601999 and 81773228); Postdoctoral Science Foundation of China (Grant/Award Number: 2018M640637); Special Fund for Taishan Scholar Project (Grant/Award Number: ts20190973).
REFERENCES
- 1. Bray F, Ferlay J, Soerjomataram I, Siegel RL, Torre LA, Jemal A. Global cancer statistics 2018: GLOBOCAN estimates of incidence and mortality worldwide for 36 cancers in 185 countries. CA Cancer J Clin. 2018;68(6):394‐424. [DOI] [PubMed] [Google Scholar]
- 2. Pennathur A, Gibson MK, Jobe BA, Luketich JD. Oesophageal carcinoma. Lancet. 2013;381(9864):400‐412. [DOI] [PubMed] [Google Scholar]
- 3. Murphy G, McCormack V, Abedi‐Ardekani B, et al. International cancer seminars: a focus on esophageal squamous cell carcinoma. Ann Oncol. 2017;28(9):2086‐2093. [DOI] [PMC free article] [PubMed] [Google Scholar]
- 4. Johnson R, Halder G. The two faces of Hippo: targeting the Hippo pathway for regenerative medicine and cancer treatment. Nat Rev Drug Discovery. 2014;13(1):63‐79. [DOI] [PMC free article] [PubMed] [Google Scholar]
- 5. Pan D. The hippo signaling pathway in development and cancer. Dev Cell. 2010;19(4):491‐505. [DOI] [PMC free article] [PubMed] [Google Scholar]
- 6. Murakami M, Nakagawa M, Olson EN, Nakagawa O. A WW domain protein TAZ is a critical coactivator for TBX5, a transcription factor implicated in Holt‐Oram syndrome. Proc Natl Acad Sci USA. 2005;102(50):18034‐18039. [DOI] [PMC free article] [PubMed] [Google Scholar]
- 7. Murakami M, Tominaga J, Makita R, et al. Transcriptional activity of Pax3 is co‐activated by TAZ. Biochem Biophys Res Comm. 2006;339(2):533‐539. [DOI] [PubMed] [Google Scholar]
- 8. Matsumoto Y, La Rose J, Kent OA, et al. Reciprocal stabilization of ABL and TAZ regulates osteoblastogenesis through transcription factor RUNX2. J Clin Investig. 2016;126(12):4482‐4496. [DOI] [PMC free article] [PubMed] [Google Scholar]
- 9. Jung H, Lee MS, Jang EJ, et al. Augmentation of PPARgamma‐TAZ interaction contributes to the anti‐adipogenic activity of KR62980. Biochem Pharmacol. 2009;78(10):1323‐1329. [DOI] [PubMed] [Google Scholar]
- 10. Kaan HYK, Chan SW, Tan SKJ, et al. Crystal structure of TAZ‐TEAD complex reveals a distinct interaction mode from that of YAP‐TEAD complex. Sci Rep. 2017;7(1):2035. [DOI] [PMC free article] [PubMed] [Google Scholar]
- 11. Lei QY, Zhang H, Zhao B, et al. TAZ promotes cell proliferation and epithelial‐mesenchymal transition and is inhibited by the hippo pathway. Mol Cell Biol. 2008;28(7):2426‐2436. [DOI] [PMC free article] [PubMed] [Google Scholar]
- 12. Zhao B, Li L, Wang L, Wang CY, Yu J, Guan KL. Cell detachment activates the Hippo pathway via cytoskeleton reorganization to induce anoikis. Genes Dev. 2012;26(1):54‐68. [DOI] [PMC free article] [PubMed] [Google Scholar]
- 13. Mo JS, Park HW, Guan KL. The Hippo signaling pathway in stem cell biology and cancer. EMBO Rep. 2014;15(6):642‐656. [DOI] [PMC free article] [PubMed] [Google Scholar]
- 14. Zhang L, Chen X, Stauffer S, Yang S, Chen Y, Dong J. CDK1 phosphorylation of TAZ in mitosis inhibits its oncogenic activity. Oncotarget. 2015;6(31):31399‐31412. [DOI] [PMC free article] [PubMed] [Google Scholar]
- 15. Kim MH, Kim J. Role of YAP/TAZ transcriptional regulators in resistance to anti‐cancer therapies. Cell Mol Life Sci. 2017;74(8):1457‐1474. [DOI] [PMC free article] [PubMed] [Google Scholar]
- 16. Cortazar D, Kunz C, Selfridge J, et al. Embryonic lethal phenotype reveals a function of TDG in maintaining epigenetic stability. Nature. 2011;470(7334):419‐423. [DOI] [PubMed] [Google Scholar]
- 17. Dalton SR, Bellacosa A. DNA demethylation by TDG. Epigenomics. 2012;4(4):459‐467. [DOI] [PMC free article] [PubMed] [Google Scholar]
- 18. Cortellino S, Xu J, Sannai M, et al. Thymine DNA glycosylase is essential for active DNA demethylation by linked deamination‐base excision repair. Cell. 2011;146(1):67‐79. [DOI] [PMC free article] [PubMed] [Google Scholar]
- 19. Mancuso P, Tricarico R, Bhattacharjee V, et al. Thymine DNA glycosylase as a novel target for melanoma. Oncogene. 2019;38(19):3710‐3728. [DOI] [PMC free article] [PubMed] [Google Scholar]
- 20. Zhang L, Yang S, Chen X, et al. The hippo pathway effector YAP regulates motility, invasion, and castration‐resistant growth of prostate cancer cells. Mol Cell Biol. 2015;35(8):1350‐1362. [DOI] [PMC free article] [PubMed] [Google Scholar]
- 21. Zhao Y, Chen S. Targeting DNA Double‐Strand Break (DSB) Repair to counteract tumor radio‐resistance. Curr Drug Targets. 2019;20(9):891‐902. [DOI] [PubMed] [Google Scholar]
- 22. Harvey KF, Zhang X, Thomas DM. The Hippo pathway and human cancer. Nat Rev Cancer. 2013;13(4):246‐257. [DOI] [PubMed] [Google Scholar]
- 23. Zhou X, Lei QY. Regulation of TAZ in cancer. Protein Cell. 2016;7(8):548‐561. [DOI] [PMC free article] [PubMed] [Google Scholar]
- 24. Zanconato F, Cordenonsi M, Piccolo S. YAP/TAZ at the roots of cancer. Cancer Cell. 2016;29(6):783‐803. [DOI] [PMC free article] [PubMed] [Google Scholar]
- 25. Hayashi H, Higashi T, Yokoyama N, et al. An imbalance in TAZ and YAP expression in hepatocellular carcinoma confers cancer stem cell‐like behaviors contributing to disease progression. Can Res. 2015;75(22):4985‐4997. [DOI] [PubMed] [Google Scholar]
- 26. Liu‐Chittenden Y, Huang B, Shim JS, et al. Genetic and pharmacological disruption of the TEAD‐YAP complex suppresses the oncogenic activity of YAP. Genes Dev. 2012;26(12):1300‐1305. [DOI] [PMC free article] [PubMed] [Google Scholar]
- 27. Jiao S, Wang H, Shi Z, et al. A peptide mimicking VGLL4 function acts as a YAP antagonist therapy against gastric cancer. Cancer Cell. 2014;25(2):166‐180. [DOI] [PubMed] [Google Scholar]
- 28. Zhang W, Gao Y, Li P, et al. VGLL4 functions as a new tumor suppressor in lung cancer by negatively regulating the YAP‐TEAD transcriptional complex. Cell Res. 2014;24(3):331‐343. [DOI] [PMC free article] [PubMed] [Google Scholar]
- 29. Willers H, Azzoli CG, Santivasi WL, Xia F. Basic mechanisms of therapeutic resistance to radiation and chemotherapy in lung cancer. Cancer J. 2013;19(3):200‐207. [DOI] [PMC free article] [PubMed] [Google Scholar]
- 30. Das AK, Sato M, Story MD, et al. Non‐small‐cell lung cancers with kinase domain mutations in the epidermal growth factor receptor are sensitive to ionizing radiation. Can Res. 2006;66(19):9601‐9608. [DOI] [PubMed] [Google Scholar]
- 31. Beskow C, Skikuniene J, Holgersson A, et al. Radioresistant cervical cancer shows upregulation of the NHEJ proteins DNA‐PKcs, Ku70 and Ku86. Br J Cancer. 2009;101(5):816‐821. [DOI] [PMC free article] [PubMed] [Google Scholar]
- 32. Liu CY, Zha ZY, Zhou X, et al. The hippo tumor pathway promotes TAZ degradation by phosphorylating a phosphodegron and recruiting the SCF{beta}‐TrCP E3 ligase. J Biol Chem. 2010;285(48):37159‐37169. [DOI] [PMC free article] [PubMed] [Google Scholar]
- 33. Feng J, Sun Q, Liu L, Xing D. Photoactivation of TAZ via Akt/GSK3beta signaling pathway promotes osteogenic differentiation. Int J Biochem Cell Biol. 2015;66:59‐68. [DOI] [PubMed] [Google Scholar]
- 34. Yuan J, Xiao G, Peng G, et al. MiRNA‐125a‐5p inhibits glioblastoma cell proliferation and promotes cell differentiation by targeting TAZ. Biochem Biophys Res Comm. 2015;457(2):171‐176. [DOI] [PubMed] [Google Scholar]
- 35. Higashi T, Hayashi H, Ishimoto T, et al. miR‐9‐3p plays a tumour‐suppressor role by targeting TAZ (WWTR1) in hepatocellular carcinoma cells. Br J Cancer. 2015;113(2):252‐258. [DOI] [PMC free article] [PubMed] [Google Scholar]
- 36. Zuo QF, Zhang R, Li BS, et al. MicroRNA‐141 inhibits tumor growth and metastasis in gastric cancer by directly targeting transcriptional co‐activator with PDZ‐binding motif, TAZ. Cell Death Dis. 2015;6:e1623. [DOI] [PMC free article] [PubMed] [Google Scholar]
- 37. da Costa NM, Hautefeuille A, Cros MP, et al. Transcriptional regulation of thymine DNA glycosylase (TDG) by the tumor suppressor protein p53. Cell Cycle. 2012;11(24):4570‐4578. [DOI] [PMC free article] [PubMed] [Google Scholar]


