

Abstract
ABT‐263 (Navitoclax) is a BH3‐mimetic drugs targeting anti‐apoptotic B‐cell lymphoma‐2 (BCL‐2) family proteins, including BCL‐2, BCL‐xL, and BCL‐w, thereby inducing apoptosis. In small‐cell lung cancer (SCLC) cells, the response to ABT‐263 is associated with the expression of myeloid cell leukemia‐1 (MCL‐1) protein, however the efficacy of ABT‐263 in non‐small‐cell lung cancer (NSCLC) has not been thoroughly evaluated. There are currently no established biomarkers for predicting the efficacy of ABT‐263 treatment in NSCLC. We screened a panel of different NSCLC cell lines and found that ABT‐263 inhibited cell proliferation and induced apoptosis in Calu‐1, Calu‐3, and BID007 cells. Inconsistent with previous reports on SCLC, low levels of MCL‐1 did not predict the response to ABT‐263 in NSCLC cells, however we found that intracellular levels of reactive oxygen species (ROS) in cancer cells were associated with sensitivity to ABT‐263 in NSCLC cells. We also showed that increasing the level of intracellular ROS could enhance the sensitivity to ABT‐263 in NSCLC cells. In summary, we propose that the intracellular levels of ROS could be used as a potential novel biomarker for predicting a response to ABT‐263 in NSCLC. Furthermore, we show some evidence supporting the further assessment of ABT‐263 as a new therapeutic strategy in patients with NSCLC combined with agents regulating ROS levels. We believe that our findings and follow‐up studies on this matter would lead to novel diagnostic and treatment strategies in patients with NSCLC.
Keywords: ABT‐263, BCL‐2 inhibitor, navitoclax, non‐small‐cell lung cancer, reactive oxygen species
This article clarified the potential relationship between intracellular ROS and sensitivity to BH3‐mimetic drug, ABT‐263 in non‐small‐cell lung cancer.
Abbreviations
- CDDP
cisplatin
- NAC
N‐acetyl‐l‐cysteine
- NSCLC
non‐small‐cell lung cancer
- ROS
reactive oxygen species
- SCLC
small‐cell lung cancer
1. INTRODUCTION
Despite recent improvements in diagnosis and treatment, lung cancer remains one of the leading causes of cancer‐related deaths worldwide. 1 Non‐small‐cell lung cancer (NSCLC) accounts for approximately 85% of total lung malignancies. Approximately 40% of NSCLCs are in an advanced stage at the time of diagnosis. The overall survival rate in patients with NSCLC is only 15% at 5 y after diagnosis, and the recurrence rates remain high. 2
Evading programmed cell death (also known as apoptosis) is one of the major hallmarks of cancer. 3 BCL‐2 family members can be broadly divided into 2 subfamilies with opposing functions: pro‐survival BCL‐2 family proteins and pro‐apoptotic BCL‐2 proteins. Pro‐survival BCL‐2 proteins include BCL‐2, BCL‐xL, BCL‐w, and MCL‐1, while the main pro‐apoptotic BCL‐2 proteins are BAX, BAK, BIM, BID, PUMA, BAD, and NOXA. 4 , 5 In general, the balance between pro‐survival and pro‐apoptotic proteins determines whether a cell survives or undergoes apoptosis. 6 , 7 , 8
Recent advances in dissecting the molecular mechanisms underlying cancer progression have led to the identification of apoptosis dysregulation as an essential step in carcinogenesis. 9 , 10 Cancer cells often overexpress pro‐survival BCL‐2 family proteins such as BCL‐2, BCL‐xL, and MCL‐1, hence resisting apoptosis. 3 BCL‐2 and its closest relatives, BCL‐xL, BCL‐w, and MCL‐1, inhibit apoptosis by binding to and suppressing 2 pro‐apoptosis‐triggering proteins, BAX and BAK.
BAX and BAK share protein‐protein interaction domains, termed BH3 motifs, and BH3 domain mimetics can affect the interaction with other BCL‐2 family proteins. To target these dysregulated anti‐apoptotic mechanisms, multiple apoptosis‐inducing agents including BH3 mimetics have been developed. 11 , 12 BH3 mimetics induce apoptosis by interfering with the function of pro‐survival BCL‐2 family proteins. 13 , 14 ABT‐263 is an orally available BAD‐like BH3 mimetic, with inhibitor constant (Ki) values of less than 1 nmol/L for BCL‐2, BCL‐xL, and BCL‐w. 15 ABT‐263 has been shown to exert promising anti‐tumor effects as a single agent in small‐cell lung cancer (SCLC) xenograft mouse models and is currently under clinical investigation for multiple cancers. 16 Moreover, it has been shown to augment the anti‐tumor effects of other chemotherapeutic agents in preclinical studies of B‐cell lymphoma, multiple myeloma, and certain solid tumors. 17 , 18 Although dose‐dependent transient thrombocytopenia (possibly due to BCL‐xL inhibition) has been observed in some studies, ABT‐263 is currently under clinical investigation in adults with chronic myelogenous leukemia and SCLC. 19 , 20 In SCLC, the basal low expression levels of the anti‐apoptotic BCL‐2 family member MCL‐1 was associated with the response to ABT‐737, a compound closely related to ABT‐263. 21 Faber et al suggested that the BIM/MCL‐1 ratio predicts sensitivity to ABT‐263 in SCLC. 22 Because ABT‐263 targets BCL‐2, BCL‐xL, and BCL‐w but not MCL‐1, MCL‐1 can serve as an “Achilles’ heel” for resisting apoptosis induced by ABT‐263. Nevertheless, it is unclear whether ABT‐263 is effective in NSCLC and whether either MCL‐1 expression levels or BIM/MCL‐1 ratio has predictive values for ABT‐263 response in NSCLC.
In the present study, we examined the sensitivity to ABT‐263 of 9 different NSCLC cell lines. We found that 3 of the cell lines, namely Calu‐1, Calu‐3, and BID007, were sensitive to ABT‐263. We confirmed that ABT‐263 induced apoptosis in these ABT‐263‐sensitive cell lines. By comparing the expression levels of BCL‐2 family members, we found that neither MCL‐1 expression levels nor BIM/MCL‐1 ratio was associated with response to ABT‐263 in NSCLC. We also found that the role of MCL‐1 in apoptosis resistance varied between the different NSCLC cell lines. In addition, we identified an association between cellular reactive oxygen species (ROS) levels and sensitivity to ABT‐263 and that several molecules involved in the ROS pathway can regulate response to ABT‐263. In this paper, we propose an important role of ROS in regulating response to ABT‐263 in NSCLC.
2. MATERIALS AND METHODS
2.1. Cell lines
Ten human cell lines were used in this study: H146 [SCLC], Calu‐1 [KRASG12C], Calu‐3 [HER2 amplification], BID007 [EGFR exon 20 insertion (A763_Y764insFQEA)], H3122 [EML4‐ALK E13; A20 fusion], A549 [KRASG12S], PC‐9 [EGFR exon 19 deletion, EGFRdelE746‐A750], H358 [NSCLC], H441 [NSCLC], and H460 [NSCLC].
PC‐9 cells were a kind gift from Dr. Pasi Janne (Dana‐Farber Cancer Institute). The H3122 and BID007 cells were a kind gift from S. Kobayashi (Beth Israel Deaconess Medical Center). No authentication for these cell lines was performed by the authors. BID007 cells were obtained as previously described. 23 The remaining cell lines were purchased from the American Type Culture Collection (ATCC).
A549 and Calu‐3 were cultured in Dulbecco’s modified Eagle’s medium (DMEM) supplemented with 10% fetal bovine serum (FBS) and antibiotics (10 U/mL penicillin and 50 µg/mL streptomycin), while the remaining cell lines were maintained in RPMI‐1640 growth medium, supplemented with 10% FBS and antibiotics (10 U/mL penicillin and 50 µg/mL streptomycin). All cell lines were maintained at 37°C in a humidified 5% CO2 in air incubator.
2.2. Reagents
ABT‐263 and erlotinib were purchased from Selleck Chemicals. Anti‐MCL‐1 antibody (#5453) and anti‐PARP antibody (#9532) were purchased from Cell Signaling Technology. Anti‐actin antibody (#A2228) was purchased from Sigma‐Aldrich. N‐acetyl‐l‐cysteine (NAC) and cisplatin were purchased from Sigma‐Aldrich.
2.3. MTS proliferation assay
A MTS proliferation assay was conducted using CellTiter 96 AQueous One Solution Assay kit (#G3582; Promega), according to the manufacturer's protocol. Briefly, 3000 cells/well were seeded into 96‐well plates and incubated for 24 h to allow for cell adhesion. Cells were treated with various concentrations of ABT‐263. Control cells were treated with the same concentration of the vehicle, dimethyl sulfoxide (DMSO). At 72 h after treatment, absorbance at 490 nm was measured. All experiments were carried out at least 2 times, and the representative data are shown. IC50 values were obtained using non‐linear regression model analysis. Reducing potential of cancer cells was determined using MTS proliferation assay by measuring the absorbance 8 h after seeding the cells (3000 cells/well) in 96‐well plates.
2.4. Apoptosis assay
Cells (30 000/well) were seeded onto 6‐well plates. Cells were treated with ABT‐263 at 1 μmol/L for 36 h. Control cells were treated with the same concentration of the vehicle, DMSO. Cell apoptosis was analyzed using the TACS Annexin V‐FITC Apoptosis Detection Kit (#4830‐01‐K, R&D Systems), according to the manufacturer's protocol. The proportion of apoptotic cells was evaluated by flow cytometry analysis using the BD FACSCalibur system (Becton Dickinson).
2.5. Quantitative RT‐PCR (qRT‐PCR)
Total RNA was isolated from cells using a RNeasy Mini Kit (Qiagen). The RNA was subjected to reverse transcription using the High‐Capacity RNA‐to‐cDNA Kit (Thermo Scientific), according to the manufacturer's protocol. For qRT‐PCR analysis, TaqMan gene expression assays were used for MCL‐1 (#Hs01050896_m1), BCL‐2 (#Hs00608023_m1), BCL‐xL (#Hs00236329_m1), BCL‐w (#Hs00187848_m1), BIM (#Hs00708019_s1), BAK1 (#Hs00832876_g1), BAX (#Hs00180269_m1), and human glyceraldehyde‐3‐phosphate dehydrogenase (GAPDH; #4310884E). Primers were purchased from Thermo Scientific. Quantitative analysis was performed using the Applied Biosystems 7500 Fast‐Real Time PCR system (Thermo Scientific). All assays were performed in triplicate.
2.6. Sanger sequencing of MCL1 cDNA
The cDNA sequence of MCL‐1 in cancer cell lines was determined by Sanger sequencing using the following primers: forward primer #1: 5′‐CCCAGTTTTCTCAGCCAGG‐3′, forward primer #2: 5′‐TAATAACACCAGTACGGA‐3′, reverse primer #1: 5′‐GTCAACTATTGCACTTACAGTAAGG‐3′ or reverse primer #2: 5′‐AGAGATAATCTCCAGCGAC‐3′.
2.7. Immunoblotting
Cells were treated with ABT‐263 for 24 h at concentrations from 0.1 to 1 μmol/L. As a control, cells were treated with DMSO alone. Cells were lysed in Cell Lysis Buffer (#9803, Cell Signaling Technology). Protein concentration was determined by BCA protein assay (#23228 and #1859078; Thermo Scientific), and equal amounts of protein per lane were loaded on 12.5% SDS‐polyacrylamide gels. Proteins were then transferred onto polyvinylidene fluoride membranes. The membranes were blocked with 5% skim milk, incubated overnight with primary antibodies at 4ºC, and then incubated with secondary antibodies for 1 h. For protein detection, the membranes were incubated with LumiGLO reagent and peroxide (#7003; Cell Signaling Technology), and then exposed to an X‐ray film.
2.8. siRNA‐mediated gene silencing
Cells were transfected with siRNAs targeting MCL1 (#1 s8583 and #2 s8585; Thermo Scientific) or with non‐targeting control siRNA. The Ambion Silencer Select Negative Control mix (#AM4611, Thermo Scientific) was used according to the manufacturer's protocol. The siLentFect transfection reagent (Bio‐Rad) was used according to the manufacturer's protocol. MCL1 knockdown was confirmed by qRT‐PCR and western blot analysis.
2.9. Detection of intracellular ROS levels
ROS generation was assessed using the oxidation‐sensitive fluorescent probe 2,7′‐dichlorodihydrofluorescein diacetate (CM‐H2DCFDA) (Thermo Scientific).
For flow cytometry analysis, the cells were detached with trypsin and incubated with 100 μmol/L CM‐H2DCFDA for 15 min at 37°C. The amount of ROS was evaluated using a Gallios Flow Cytometer (Beckman Coulter, Inc, Brea, CA, USA). Flow cytometry data were analyzed using FlowJo software (FlowJo LLC.).
To measure ROS levels using the Cellular Reactive Oxygen Species Detection Assay Kit (Abcam, Cambridge, UK), cells (10 000/well) were seeded onto a 96‐well black‐walled plate (Corning, NY, USA) and allowed to adhere overnight prior to the experiment. After 24 h of treatment with ABT‐263, ROS levels were measured according to the manufacturer’s protocol. Briefly, cells were washed with HBSS buffer, stained with 20 μmol/L of H2DCFDA, and the plate was incubated for 40 min at 37°C. The cells were then washed with HBSS, and the plate was refilled with HBSS. Fluorescence intensity was measured using the microplate reader (Cytation 5) at 485 nm (excitation) and 535 nm (emission).
2.10. Statistical analysis
Statistical analysis was performed using GraphPad Prism version 8.0 (GraphPad Software). Student t test was used for comparison. For correlation studies, Pearson correlation test was performed. All P‐values were two‐sided; a P‐value < .05 was considered to indicate statistical significance.
3. RESULTS
3.1. Diverse sensitivity of NSCLC cell lines to ABT‐263
Previous studies revealed that ABT‐263 was effective in inhibiting SCLC cell proliferation in vitro and in vivo. 16 , 21 Several ongoing clinical trials are currently investigating the safety and efficacy of ABT‐263 in patients with SCLC. However, the potential use of ABT‐263 in patients with NSCLC has been understudied. As a first step, we examined whether NSCLC cells were sensitive to ABT‐263. The anti‐proliferative effects of ABT‐263 in nine NSCLC cell lines and 1 SCLC cell line were assessed using MTS cell proliferation assays. Consistent with previous reports, 16 , 21 the SCLC cell line H146 was highly sensitive to ABT‐263, in which the calculated IC50 value was 0.0331 μmol/L. Therefore, H146 was used as a positive control as a cell line that was highly responsive to ABT‐263. Interestingly, out of all NSCLC cell lines tested, only Calu‐1, Calu‐3, and BID007 were sensitive to the anti‐proliferative effects of ABT‐263, although their sensitivity was lower than that of H146 cells (Figure 1A). The calculated IC50 values for Calu‐1, Calu‐3, and BID007 cells were 0.83 μmol/L, 1.71 μmol/L, and 1.89 μmol/L, respectively (Table 1). We also found that A549 and H3122 cells were highly resistant to the anti‐proliferative effects of ABT‐263. The other 4 cell lines showed a moderate response to ABT‐263. These data indicated that the sensitivity of NSCLC cells to ABT‐263 was highly diverse.
FIGURE 1.
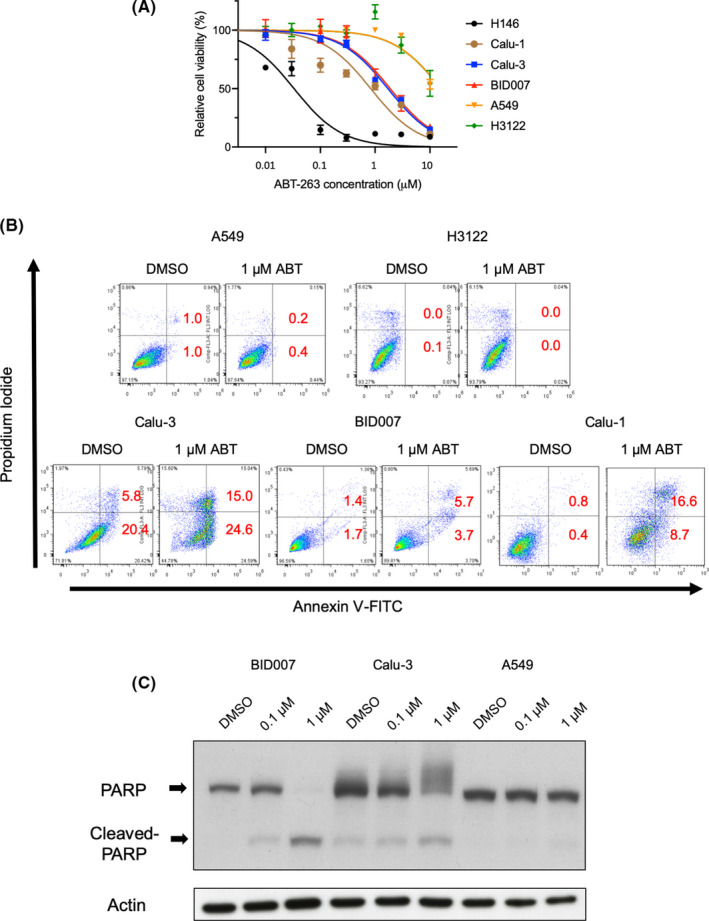
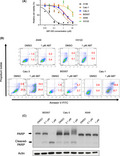
Sensitivity to ABT‐263 in different lung cancer cell lines. A, Results of MTS assay in the lung cancer cell lines H146, Calu‐1, Calu‐3, BID007, H3122, and A549. Cells were treated with indicated concentrations of ABT‐263 for 72 h. Error bars indicate standard deviations (SD). B, Flow cytometry data are shown for A549, H3122, Calu‐1, Calu‐3 and BID007 cells treated with dimethyl sulfoxide (DMSO) or ABT‐263 for 36 h. The numbers (%) indicate the proportion of annexin V‐FITC‐ and/or propidium iodide‐stained cells. C, Cleaved levels of PARP are shown for BID007, Calu‐3, and A549 cells after treatment with ABT‐263 for 24 h. Actin was used as a loading control
TABLE 1.
IC50 values of ABT‐263 in lung cancer cell lines
| Cell line | IC50 values (μM) |
|---|---|
| H146 (SCLC) | 0.0331 |
| Calu‐1 | 0.831 |
| Calu‐3 | 1.71 |
| BID007 | 1.89 |
| PC9 | 3.30 |
| H358 | 3.55 |
| H441 | 4.28 |
| H460 | 7.48 |
| A549 | >10 |
| H3122 | >10 |
Abbreviation: SCLC, small‐cell lung cancer.
3.2. ABT‐263 induces apoptosis in Calu‐1, Calu‐3, and BID007 cells
Because ABT‐263 is a BH3‐mimetic and induces apoptosis in ABT‐263‐sensitive cells, we examined whether ABT‐263 could induce apoptosis in Calu‐3 and BID007 cells. To this end, we stained A549, H3122, Calu‐1, Calu‐3, and BID007 cells with annexin V‐FITC and propidium iodide (PI) after ABT‐263 treatment. Even though ABT‐263 did not induce apoptosis in A549 and H3122 cells, ABT‐263 treatment promoted apoptosis in Calu‐1, Calu‐3, and BID007 cells, which was indicated by the significantly higher percentage of Annexin V and/or PI‐positive ABT‐263‐treated Calu‐1, Calu‐3, and BID007 cells compared with control cells (Figure 1B). In addition, to obtain further evidence that ABT‐263 induces apoptosis in Calu‐3 and BID007 cells, we performed western blot analysis to examine whether cleavage of PARP is observed after ABT‐263 treatment. As expected, cleaved PARP was observed in ABT‐263‐treated Calu‐3 and BID007 cells but not in A549 cells (Figure 1C). These data indicated that ABT‐263 induced apoptosis in Cal‐1, Calu‐3, and BID007 cells.
3.3. MCL‐1 expression levels cannot predict response to ABT‐263 in NSCLC cells
In SCLC, low expression levels of MCL‐1 or low BIM/MCL‐1 ratio have been associated with the efficacy of ABT‐263 treatment. 21 , 22 To assess the relationship between MCL‐1 expression levels and response to ABT‐263 in NSCLC cells, we assessed the expression of MCL‐1 or the BIM/MCL‐1 ratio using quantitative RT‐PCR analysis and immunoblotting. Unexpectedly, the expression levels of MCL‐1 in BID007, Calu‐1, and Calu‐3 were comparable with those in ABT‐263‐resistant cells (Figure 2A,B), indicating that low MCL‐1 expression was not a useful biomarker for ABT‐263 response in NSCLC cells. Furthermore, to examine whether the expression levels of other pro‐ or anti‐apoptotic genes or the BIM/MCL‐1 ratio can predict the response to ABT‐263, we compared their respective mRNA levels between ABT‐263‐sensitive and ‐resistant cell lines using quantitative RT‐PCR analysis. However, no significant differences were observed (Figure S1A–C).
FIGURE 2.
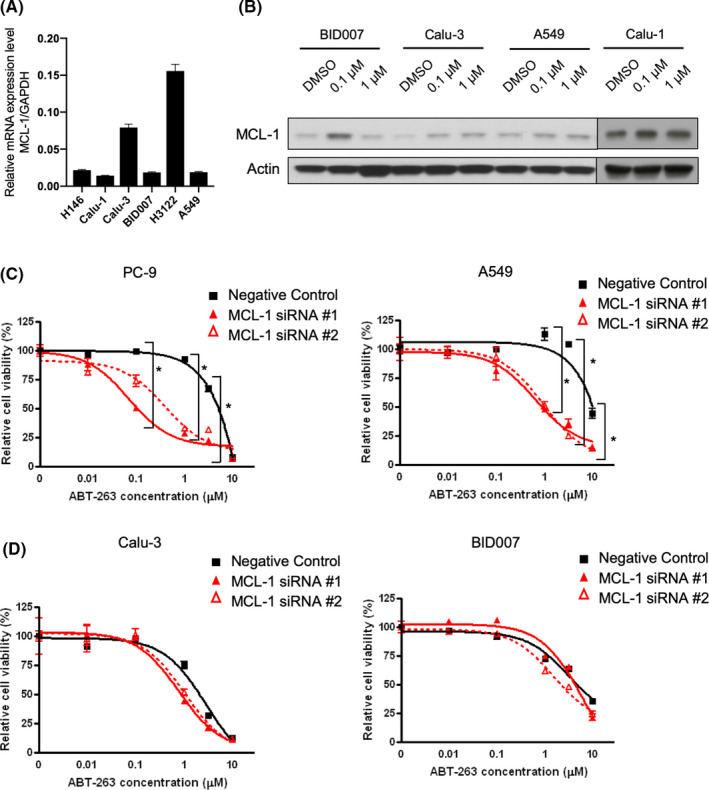
Relationship between MCL‐1 expression levels and sensitivity to ABT‐263. A, Relative mRNA expression of MCL1 is shown in lung cancer cell lines relative to the expression of GAPDH. Error bars indicate standard deviation (SD). B, Western blot analysis of MCL‐1 expression in Calu‐1, Calu‐3, BID007, and A549 cells. Actin was used as a loading control. C, D, Results of the MTS cell proliferation assay in ABT‐263‐resistant NSCLC cell lines (A549, PC‐9) and ABT‐263‐sensitive NSCLC cell lines (Calu‐3, BID007). Cells were transfected with control siRNA or MCL1‐targeting siRNAs (#1, #2), followed by treatment with indicated concentrations of ABT‐263. *P < .05. Error bars represent SD
The pro‐survival BCL‐2 family member MCL‐1 was not affected by ABT‐263 treatment. Even though MCL‐1 expression levels were not associated with response to ABT‐263, MCL‐1 might still play a role in ABT‐263‐induced apoptosis resistance in NSCLC cells. To examine the functional roles of MCL‐1 in NSCLC cells, we performed siRNA‐mediated knockdown of its expression. We confirmed that siRNAs used in this study could efficiently knock down the expression of MCL‐1 (Figure S2). As expected, MCL‐1 knockdown sensitized PC‐9 and A549 cells to ABT‐263, indicating a role for MCL‐1 in promoting resistance to ABT‐263‐induced apoptosis in these cell lines (Figure 2C). In contrast, MCL‐1 gene silencing did not sensitize Calu‐3 and BID007 cells to ABT‐263, suggesting that MCL‐1 does not exert pro‐survival roles in these cells (Figure 2D). To examine whether inactivating mutations were the reason for impaired pro‐survival effects of MCL‐1 in Calu‐3 and BID007 cells, we performed cDNA sequencing of MCL1; however, no such mutations were identified (Figure S3). Taken together, we found that functional differences in MCL‐1 could regulate the sensitivity to ABT‐263 in NSCLC cells.
3.4. Redox potential and reactive oxygen stress levels are associated with sensitivity to ABT‐263
We observed that ABT‐263‐sensitive cell lines had low baseline MTS values. We, therefore, examined the correlation between baseline MTS values and IC50 values for ABT‐263. Interestingly, we found a significant positive correlation between baseline MTS values and IC50 values (Figure S4). MTS values represent the redox potential of cancer cells, as the substrate that is used to quantify the reducing ability of metabolically active cells serves as an indicator of NADH or NADPH accumulation. 24 , 25 Furthermore, redox potential is tightly connected to intracellular reactive oxygen species (ROS) levels in cancer cells 26 and has been associated with mitochondrial potential and apoptosis induced by ROS. 27 Hence, we investigated the relationship between ROS levels and the sensitivity to ABT‐263 in NSCLC cells. Utilizing FACS analysis, we found that ABT‐263 treatment reduced the intracellular ROS levels only in ABT‐263‐sensitive cell lines, Calu‐1 and Calu‐3 (Figure 3A). This observation that reduction in ROS level was correlated with the sensitivity to ABT‐263 was also confirmed in an wider panel of different cell lines using a ROS detection kit, although this correlation could not reach statistical significance (Figure S5A). Considering a possibility that a general cytotoxicity effect was caused by the reduction in ROS levels, we assessed ROS levels in PC9 cells treated with erlotinib, because PC9 cells have EGFR exon 19 deletion and are highly sensitive to this drug. Interestingly, erlotinib treatment did not reduce ROS level in PC9 cells (Figure S5B), suggesting that the reduction in ROS levels was specific for ABT‐263‐sensitive cell lines. Additionally, we found that intracellular ROS levels were higher in Calu‐1, Calu‐3 than in H3122 or A549 using IHC, indicating that high ROS levels at baseline and the reduction in ROS after ABT‐263 treatment might confer sensitivity to ABT‐263 in NSCLC cells (Figure 3B). These data suggest the potential use of ROS levels as a biomarker for sensitivity to ABT‐263 in NSCLC cells.
FIGURE 3.
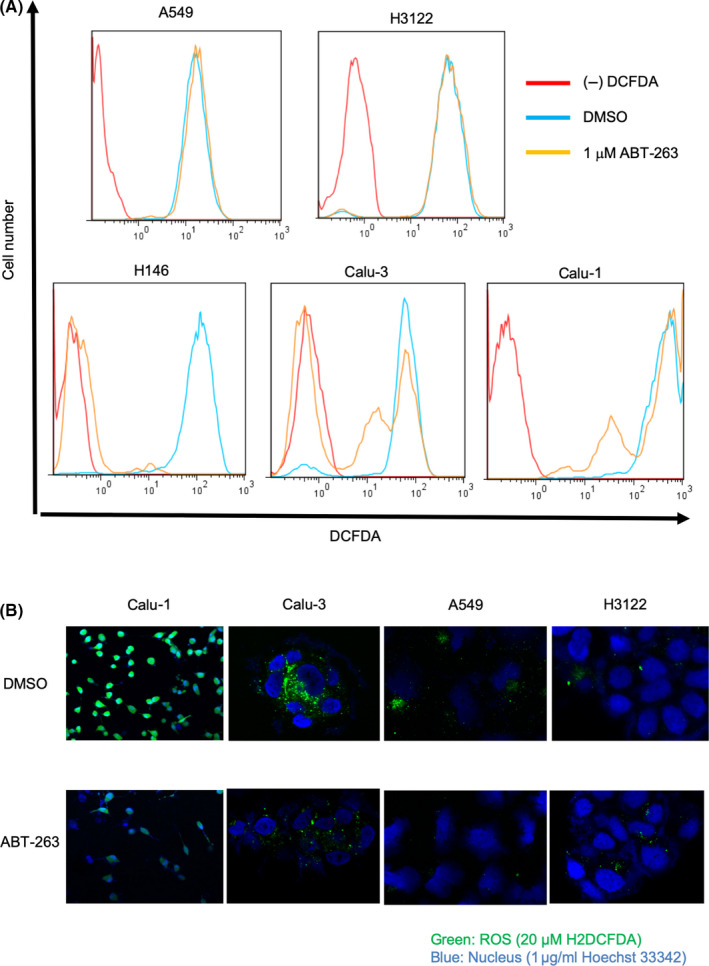
ROS levels can predict the response to ABT‐263 in NSCLC cells. A, Flow cytometry analysis evaluating the levels of cellular ROS in A549, H3122, Calu‐3, Calu‐1, and H146 cells. Cells were treated with dimethyl sulfoxide (DMSO) or ABT‐263 for 36 h. B, Immunohistochemistry staining assessing ROS levels in Calu‐1, Calu‐3, A549, and H3122 cells. Cells were treated with DMSO or ABT‐263 for 36 h. ROS, reactive oxygen species
3.5. Regulators of ROS could affect the response to ABT‐263 in NSCLC cells
Given that higher ROS levels correlated with ABT‐263‐sensitivity in NSCLC cells, we examined whether molecules involved in ROS regulation could affect the response to ABT‐263 in NSCLC cells. We found that the ROS scavenger NAC impaired the sensitivity of Calu‐3 and BID007 to ABT‐263, in a dose‐dependent manner (Figure 4A). In contrast, the addition of ROS by H2O2 treatment made Calu‐3 cells slightly sensitized to ABT‐263, although the synergistic effect was modest (Figure S6). Moreover, we assessed the intracellular levels of ROS in A549 cells and found that ROS levels were decreased in ABT‐263‐treated cells when the MCL1 gene was silenced (Figure 4B). Furthermore, we assessed the synergistic effect of a combined treatment with CDDP and ABT‐263, as CDDP was previously reported to increase intracellular ROS levels. 28 As expected, CDDP rendered A549 cells more sensitive to ABT‐263 (Figure 4C). Finally, we found that a combination treatment with NAC attenuated the effect of sensitization to ABT‐263 by CDDP in A549 cells, confirming that intracellular ROS levels affected the sensitivity to ABT‐263 (Figure 4D).
FIGURE 4.
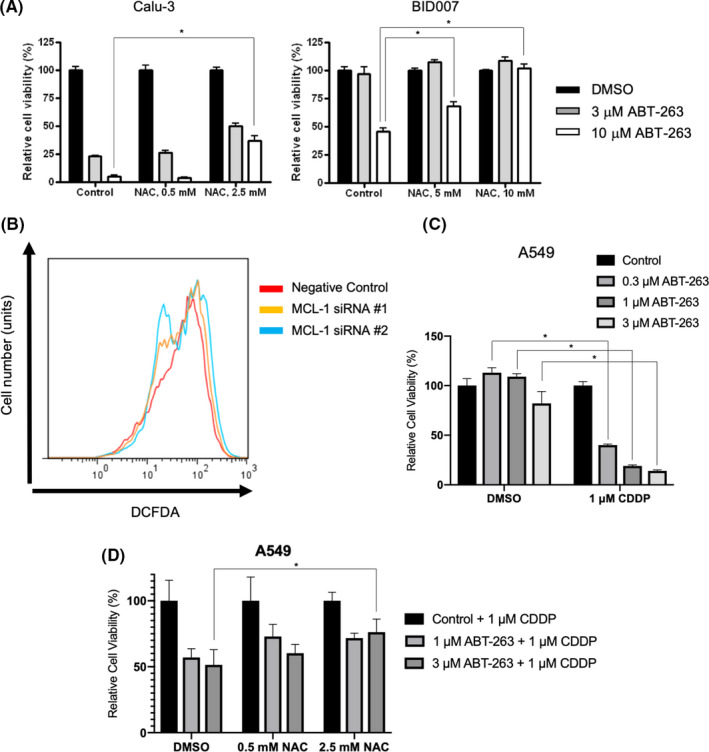
Regulation of ROS levels in NSCLC cells affects their sensitivity to ABT‐263. A, Results of MTS assay in cells treated with ABT‐263 to evaluate NAC concentration. B, Flow cytometry analysis evaluating the intracellular ROS levels in A549 cells. Cells were transfected with either control or siRNAs targeting MCL1, followed with ABT‐263 treatment for 24 h. C, Results of MTS assay in cells treated with ABT‐263 upon treatment with the indicated concentrations of CDDP. D, A549 cells were treated with 1 μM CDDP and indicated concentration of ABT‐263 combined with NAC for 72 h. Values were normalized as the NAC single treatment value becomes 100%. *P < .05. Each bar indicates the average of triplicate, and error bar indicates SD. CDDP, cisplatin; NAC, N‐acetyl‐l‐cysteine
4. DISCUSSION
In this study, we assessed the sensitivity of various NSCLC cell lines to ABT‐263. Overall, we found the outcomes to be diverse. Interestingly, we identified 3 ABT‐263‐sensitive cell lines, namely Calu‐1, Calu‐3, and BID007, although their response was less profound compared with that of the H146 SCLC cells, which we used as a response control for ABT‐263 sensitivity in this study. In SCLC cells, the low baseline expression levels of MCL‐1 or the BIM/MCL‐1 ratio have been associated with the response to ABT‐263. 22 However, our data suggest that the expression levels of MCL‐1 could not serve as a biomarker of response in NSCLC. A recent study has also shown no correlation between ABT‐263 sensitivity and MCL‐1 expression levels in NSCLC cells. 29 However, we found a strong association between ABT‐263 sensitivity and intracellular ROS levels.
In 1 phase II clinical study on 39 patients with SCLC who received ABT‐263, partial response was observed in 1 patient (2.6%), while 9 patients (23%) had stable disease. Median progression‐free survival (PFS) was 1.5 mo, while the median overall survival (OS) was 3.2 mo. The most common side effect associated with ABT‐263 was thrombocytopenia (possibly due to BCL‐xL inhibition), which reached grades III–IV in 41% of the patients. 30 Based on these results, the use of ABT‐263 in patients with SCLC was not very promising. Biomarkers of response need to be identified, and the development of combinational approaches should be considered.
We found that some of the NSCLC cell lines were moderately sensitive to ABT‐263, but NSCLC cells were still relatively insensitive to this drug compared with SCLC cells. Thus, higher amounts of ABT‐263 need to be used as a monotherapy to achieve clinical response. However, considering the findings from the clinical trial mentioned above, 30 higher amounts of ABT‐263 would not be feasible because of its high toxicity. Several previous studies have shown the correlation between ROS, BCL‐2 proteins, and response to ABT‐263, however this relationship was context dependent and hard to interpret. For example, Lagadinou et al showed that leukemia stem cells with low levels of ROS and high levels of BCL‐2 were less prone to apoptosis. 31 Another study has shown that higher levels of BCL‐2 could induce autophagy to reduce the level of ROS in HCC cells, 32 yet other groups reported that ROS‐inducing therapies, including chemotherapy and radiation, showed synergistic effects with ABT‐263 in NSCLC cells. 29 , 33 , 34 , 35 In the present study, we found that intracellular ROS levels can be used as a biomarker to predict response to ABT‐263. Intriguingly, in our model, apoptosis induced by ABT‐263 in sensitive cell lines was accompanied by a reduction in ROS levels. Generally, ROS can induce apoptosis, but cancer cells sometimes depend on ROS, and ROS reduction leads to apoptosis. 36 , 37 Furthermore, we showed that regulating ROS levels in NSCLC cells could control the sensitivity to ABT‐263. Even though ABT‐263 might not be useful in patients with NSCLC as a monotherapy, it could be a promising therapeutic approach when combined with ROS‐inducing therapies, including CDDP and radiation. In this way, a relatively smaller dose of ABT‐263 might be both well tolerated and effective.
In summary, we reported a highly diverse sensitivity among different NSCLC cell lines to ABT‐263, and we demonstrated the association between ROS levels and sensitivity to ABT‐263. Even though our findings provided a step forward in the development of novel therapeutic approaches involving ABT‐263 as a combination therapy for effective induction of apoptosis in NSCLC cells, further preclinical and clinical studies need to be conducted.
CONFLICT OF INTEREST
The authors declare no conflict of interest.
AUTHOR CONTRIBUTIONS
KO, HT, HY, SN, JH, and KS conceived this study. KO, HT, HY, SN, JH, TT, AK, DA, KI, KM, SI, IK, and KS acquired data. KO, HT, HY, SN, JH, TT, AK, JH, DA, KI, KN, SI, IK, and KS analyzed and interpreted the data. KO, HT, HY, KF, and KS provided administrative and funding support. KO, HT, HY, and KS wrote the manuscript. All authors approved the final version. We thank Ms. Chinatsu Yonekawa and Ms. Mikiko Shibuya for excellent technical assistance.
Supporting information
Fig S1
Fig S2
Fig S3
Fig S4
Fig S5
Fig S6
ACKNOWLEDGMENTS
Financial information: This work was supported in part by the Japan Society for the Promotion of Science to K. Ohgino (Grant #15K19429), K. Soejima (Grant #15K09229 and #19H03671), H. Terai (Grant #18K08184), and H. Yasuda (Grant #25860656, #15H05666, and #15K14398). This work was also supported in part by Takeda Science Foundation to H. Yasuda and H. Terai.
Ohgino K, Terai H, Yasuda H, et al. Intracellular levels of reactive oxygen species correlate with ABT‐263 sensitivity in non‐small‐cell lung cancer cells. Cancer Sci. 2020;111:3793–3801. 10.1111/cas.14569
REFERENCES
- 1. Siegel RL, Miller KD, Jemal A. Cancer statistics, 2015. CA Cancer J Clin. 2015;65:5‐29. [DOI] [PubMed] [Google Scholar]
- 2. Hubbard MO, Fu P, Margevicius S, Dowlati A, Linden PA. Five‐year survival does not equal cure in non‐small cell lung cancer: a Surveillance, Epidemiology, and End Results‐based analysis of variables affecting 10‐ to 18‐year survival. J Thorac Cardiovasc Surg. 2012;143:1307‐1313. [DOI] [PubMed] [Google Scholar]
- 3. Hanahan D, Weinberg RA. Hallmarks of cancer: the next generation. Cell. 2011;144:646‐674. [DOI] [PubMed] [Google Scholar]
- 4. Coultas L, Strasser A. The role of the Bcl‐2 protein family in cancer. Semin Cancer Biol. 2003;13:115‐123. [DOI] [PubMed] [Google Scholar]
- 5. Danial NN, Korsmeyer SJ. Cell death: critical control points. Cell. 2004;116:205‐219. [DOI] [PubMed] [Google Scholar]
- 6. Adams JM, Cory S. The Bcl‐2 apoptotic switch in cancer development and therapy. Oncogene. 2007;26:1324‐1337. [DOI] [PMC free article] [PubMed] [Google Scholar]
- 7. Evan G, Littlewood T. A matter of life and cell death. Science. 1998;281:1317‐1322. [DOI] [PubMed] [Google Scholar]
- 8. Czabotar PE, Lessene G, Strasser A, Adams JM. Control of apoptosis by the BCL‐2 protein family: implications for physiology and therapy. Nat Rev Mol Cell Biol. 2014;15:49‐63. [DOI] [PubMed] [Google Scholar]
- 9. Lowe SW, Cepero E, Evan G. Intrinsic tumour suppression. Nature. 2004;432:307‐315. [DOI] [PubMed] [Google Scholar]
- 10. Fesik SW. Promoting apoptosis as a strategy for cancer drug discovery. Nat Rev Cancer. 2005;5:876‐885. [DOI] [PubMed] [Google Scholar]
- 11. Han B, Park D, Li R, et al. Small‐molecule Bcl2 BH4 antagonist for lung cancer therapy. Cancer Cell. 2015;27:852‐863. [DOI] [PMC free article] [PubMed] [Google Scholar]
- 12. Wang X, Zhang C, Yan X, et al. A novel bioavailable BH3 mimetic efficiently inhibits colon cancer via cascade effects of mitochondria. Clin Cancer Res. 2016;22:1445‐1458. [DOI] [PubMed] [Google Scholar]
- 13. Delbridge AR, Strasser A. The BCL‐2 protein family, BH3‐mimetics and cancer therapy. Cell Death Differ. 2015;22:1071‐1080. [DOI] [PMC free article] [PubMed] [Google Scholar]
- 14. Billard C. BH3 mimetics: status of the field and new developments. Mol Cancer Ther. 2013;12:1691‐1700. [DOI] [PubMed] [Google Scholar]
- 15. Tse C, Shoemaker AR, Adickes J, et al. ABT‐263: a potent and orally bioavailable Bcl‐2 family inhibitor. Cancer Res. 2008;68:3421‐3428. [DOI] [PubMed] [Google Scholar]
- 16. Shoemaker AR, Mitten MJ, Adickes J, et al. Activity of the Bcl‐2 family inhibitor ABT‐263 in a panel of small cell lung cancer xenograft models. Clin Cancer Res. 2008;14:3268‐3277. [DOI] [PubMed] [Google Scholar]
- 17. Ackler S, Xiao Y, Mitten MJ, et al. ABT‐263 and rapamycin act cooperatively to kill lymphoma cells in vitro and in vivo. Mol Cancer Ther. 2008;7:3265‐3274. [DOI] [PubMed] [Google Scholar]
- 18. Chen J, Jin S, Abraham V, et al. The Bcl‐2/Bcl‐X(L)/Bcl‐w inhibitor, navitoclax, enhances the activity of chemotherapeutic agents in vitro and in vivo. Mol Cancer Ther. 2011;10:2340‐2349. [DOI] [PubMed] [Google Scholar]
- 19. Roberts AW, Seymour JF, Brown JR, et al. Substantial susceptibility of chronic lymphocytic leukemia to BCL2 inhibition: results of a phase I study of navitoclax in patients with relapsed or refractory disease. J Clin Oncol. 2012;30:488‐496. [DOI] [PMC free article] [PubMed] [Google Scholar]
- 20. Wilson WH, O'Connor OA, Czuczman MS, et al. Navitoclax, a targeted high‐affinity inhibitor of BCL‐2, in lymphoid malignancies: a phase 1 dose‐escalation study of safety, pharmacokinetics, pharmacodynamics, and antitumour activity. Lancet Oncol. 2010;11:1149‐1159. [DOI] [PMC free article] [PubMed] [Google Scholar]
- 21. Tahir SK, Yang X, Anderson MG, et al. Influence of Bcl‐2 family members on the cellular response of small‐cell lung cancer cell lines to ABT‐737. Cancer Res. 2007;67:1176‐1183. [DOI] [PubMed] [Google Scholar]
- 22. Faber AC, Farago AF, Costa C, et al. Assessment of ABT‐263 activity across a cancer cell line collection leads to a potent combination therapy for small‐cell lung cancer. Proc Natl Acad Sci USA. 2015;112:E1288‐1296. [DOI] [PMC free article] [PubMed] [Google Scholar]
- 23. Yasuda H, Park E, Yun C‐H, et al. Structural, biochemical, and clinical characterization of epidermal growth factor receptor (EGFR) exon 20 insertion mutations in lung cancer. Sci Transl Med. 2013;5:216ra177. [DOI] [PMC free article] [PubMed] [Google Scholar]
- 24. Berridge MV, Tan AS. Characterization of the cellular reduction of 3‐(4,5‐dimethylthiazol‐2‐yl)‐2,5‐diphenyltetrazolium bromide (MTT): subcellular localization, substrate dependence, and involvement of mitochondrial electron transport in MTT reduction. Arch Biochem Biophys. 1993;303:474‐482. [DOI] [PubMed] [Google Scholar]
- 25. Dunigan DD, Waters SB, Owen TC. Aqueous soluble tetrazolium/formazan MTS as an indicator of NADH‐ and NADPH‐dependent dehydrogenase activity. Biotechniques. 1995;19:640‐649. [PubMed] [Google Scholar]
- 26. Kumari S, Badana AK, G MM, G S, Malla R Reactive oxygen species: a key constituent in cancer survival. Biomark Insights. 2018;13:1177271918755391. [DOI] [PMC free article] [PubMed] [Google Scholar]
- 27. Pohl SO, Agostino M, Dharmarajan A, Pervaiz S. Cross talk between cellular redox state and the antiapoptotic protein Bcl‐2. Antioxid Redox Signal. 2018;29:1215‐1236. [DOI] [PubMed] [Google Scholar]
- 28. Yang H, Villani RM, Wang H, et al. The role of cellular reactive oxygen species in cancer chemotherapy. J Exp Clin Cancer Res. 2018;37:266. [DOI] [PMC free article] [PubMed] [Google Scholar]
- 29. Shen QI, Li J, Mai J, et al. Sensitizing non‐small cell lung cancer to BCL‐xL‐targeted apoptosis. Cell Death Dis. 2018;9:986. [DOI] [PMC free article] [PubMed] [Google Scholar]
- 30. Rudin CM, Hann CL, Garon EB, et al. Phase II study of single‐agent navitoclax (ABT‐263) and biomarker correlates in patients with relapsed small cell lung cancer. Clin Cancer Res. 2012;18:3163‐3169. [DOI] [PMC free article] [PubMed] [Google Scholar]
- 31. Lagadinou E, Sach A, Callahan K, et al. BCL‐2 inhibition targets oxidative phosphorylation and selectively eradicates quiescent human leukemia stem cells. Cell Stem Cell. 2013;12:329‐341. [DOI] [PMC free article] [PubMed] [Google Scholar]
- 32. Ni Z, Wang B, Dai X, et al. HCC cells with high levels of Bcl‐2 are resistant to ABT‐737 via activation of the ROS‐JNK‐autophagy pathway. Free Radic Biol Med. 2014;70:194‐203. [DOI] [PubMed] [Google Scholar]
- 33. Matsumoto M, Nakajima W, Seike M, Gemma A, Tanaka N. Cisplatin‐induced apoptosis in non‐small‐cell lung cancer cells is dependent on Bax‐ and Bak‐induction pathway and synergistically activated by BH3‐mimetic ABT‐263 in p53 wild‐type and mutant cells. Biochem Biophys Res Commun. 2016;473:490‐496. [DOI] [PubMed] [Google Scholar]
- 34. Kwon OS, Hong SK, Kwon SJ, Go YH, Oh E, Cha HJ. BCL2 induced by LAMTOR3/MAPK is a druggable target of chemoradioresistance in mesenchymal lung cancer. Cancer Lett. 2017;403:48‐58. [DOI] [PubMed] [Google Scholar]
- 35. Tan N, Malek M, Zha J, et al. Navitoclax enhances the efficacy of taxanes in non‐small cell lung cancer models. Clin Cancer Res. 2011;17:1394‐1404. [DOI] [PubMed] [Google Scholar]
- 36. Liu B, Tan X, Liang J, et al. A reduction in reactive oxygen species contributes to dihydromyricetin‐induced apoptosis in human hepatocellular carcinoma cells. Sci Rep. 2014;4:7041. [DOI] [PMC free article] [PubMed] [Google Scholar]
- 37. Jeong CH, Joo SH. Downregulation of reactive oxygen species in apoptosis. J Cancer Prev. 2016;21:13‐20. [DOI] [PMC free article] [PubMed] [Google Scholar]
Associated Data
This section collects any data citations, data availability statements, or supplementary materials included in this article.
Supplementary Materials
Fig S1
Fig S2
Fig S3
Fig S4
Fig S5
Fig S6