

Abstract
Background & Aims:
Vibration-controlled transient elastography (VCTE) is a non-invasive tool for detecting hepatic steatosis and fibrosis in patients who have not received liver transplants. We aimed to evaluate the diagnostic performance of VCTE in detection of hepatic steatosis and fibrosis in patients who have undergone liver transplantation.
Methods:
We performed a prospective study of 99 liver transplant recipients assessed by VCTE using a standard protocol. Controlled attenuation parameter cutoff values for pairwise steatosis grade and liver stiffness measurements (LSM) and cutoff values for pairwise fibrosis stage were determined using cross-validated area under the receiver operating characteristics (AUROC) curve analyses. We calculated sensitivity (fixed at 90%) and specificity (fixed at 90%) values.
Results:
A controlled attenuation parameter cutoff value of 270 dB/m detected any hepatic steatosis with an AUROC of 0.88 (95% CI, 0.78–0.93). VCTE detected steatosis grades 2–3 vs 0–1 with an AUROC of 0.94 (95% CI, 0.89–0.99) and steatosis grade 3 vs 0–2 was similar and AUROC of 0.89 (95% CI, 0.83–0.96). When we used an LSM cutoff value of 10.5 kPa, VCTE identified patients with advanced fibrosis (fibrosis stages≥3) with an AUROC of 0.94 (95% CI, 0.88–0.99). At fixed sensitivity, the cutoff LSM value of 10.5k Pa excluded advanced fibrosis with a negative predictive value of 0.99. At fixed specificity, the cutoff LSM value of 16.9 kPa detected advanced fibrosis with a sensitivity of 0.86, a positive predictive value (PPV) of 0.40, and a negative predictive value of 0.99.
Conclusions:
VCTE accurately detects hepatic steatosis and fibrosis in recipients of liver transplants. This non-invasive method might be used to identify patients in need of confirmatory liver biopsy analysis.
Keywords: Nonalcoholic steatohepatitis, Nonalcoholic fatty liver disease, Hepatic steatosis and fibrosis, Liver biopsy
INTRODUCTION:
Liver transplantation (LT) is the only curative therapy for patients with end stage liver disease (ESLD)1. Recurrent liver disease following LT is common, especially among those transplanted for chronic hepatitis C (HCV) or nonalcoholic steatohepatitis (NASH)2,3. More importantly, nearly 1 out of 3 patients transplanted for non-NASH indications will develop hepatic steatosis after transplant, which may predispose patients to fibrosis progression even when their original liver disease is controlled6. Therefore, serial monitoring of development of hepatic steatosis and fibrosis in LT recipients is important, since presence and severity of fibrosis after LT predicts graft cirrhosis and need for re-transplantation4.
Liver biopsy remains the gold standard for assessing for hepatic steatosis and fibrosis after LT. In the absence of reliable non-invasive biomarkers of disease severity, many transplant programs have adopted protocolled liver biopsy to risk-stratify patients5. However, liver biopsy is invasive, costly, associated with patient discomfort, and exposes patients to the risk of complications, especially those with none to minimal disease. Non-invasive biomarkers and models have been evaluated in liver transplant population, but have marginal accuracy compared to non-transplant populations6,7.
Vibration-controlled transient elastography (VCTE), has become more common as a point-of-care tool to aid in management of patients with chronic liver disease8–10. VCTE measures the speed of mechanically-generated shear waves across the liver to derive a liver stiffness measurement (LSM), a marker of hepatic fibrosis. VCTE can also simultaneously measure attenuation of the ultrasound signal through the liver to derive the Controlled Attenuation Parameter (CAP), which is a marker of hepatic steatosis10,11. The initial performance of VCTE using the standard M probe was limited by high failure rates in obese patients12, but a larger XL probe has improved performance in such patients13. In order to further reduce failure rates in obese patients and standardize methodology, Fibroscan 502 Touch®, an automatic probe selection software tool that determines the choice of probe based on patient body habitus, has also been developed14.
VCTE has been evaluated extensively in chronic liver disease utilizing liver biopsy as the reference standard, however, these studies are largely limited to non-LT population10,11,15,16. Due to significant anatomical alterations and higher prevalence of metabolic syndrome and its components, the findings from non-LT population are not readily translatable to LT population3,17. While studies evaluating VCTE in LT patients have been performed, they are limited by relatively smaller sample size18–20, short follow up after LT18,21,22, histological correlation21 and lack of information regarding failed or inaccurate exams18,19,22,23. Furthermore, diagnostic performance of CAP to assess hepatic steatosis has not yet been assessed and the studies evaluating VCTE in LT patients were performed with the M probe without the Fibroscan 502 Touch® software. Thus, a recently published meta-analysis evaluating the performance characteristics of VCTE in LT recipients was limited by the factors noted in trial designs of the studies listed above24 and underscore the importance of systematically evaluating the diagnostic performance of CAP and LSM in LT recipients. In order to bridge these significant limitations, we conducted the current study to evaluate the performance characteristics of VCTE in assessing steatosis and fibrosis in LT recipients using liver biopsy as the reference standard.
METHODS:
Study Design:
All subjects with current age ≥18 years were prospectively enrolled into a natural history study of LT recipients at Virginia Commonwealth University. All LT recipients with a liver biopsy quantifying hepatic fibrosis and who underwent VCTE with CAP score were eligible for inclusion. The analysis was restricted to patients who had a liver biopsy and VCTE within 3 months except for patients with documented cirrhosis on liver biopsy, who only underwent VCTE. The study was reviewed and approved by the Institutional Review Board (IRB). The manuscript was reviewed and approved by all authors prior to submission.
Patient Population:
Patients with active use of more than mild alcohol consumption as defined by National Institute on Alcohol Abuse and Alcoholism (NIAA) were excluded. Additionally, patients on active therapy for HCV, acute cellular rejection, chronic rejection, cholestatic hepatitis, concurrent heart failure, implantable cardiac devises, living donor liver transplantation, pregnancy, on dialysis and ascites were excluded.
Liver Biopsy:
The decision to do a liver biopsy was at the discretion of the transplant hepatologist for indications including metabolic syndrome, unexplained elevation of liver chemistries, abnormal liver morphology on abdominal imaging, or other specific indications. All liver biopsies were scored by a histopathologist blinded to the VCTE and clinical data. Hepatic steatosis was graded on an ordinal scale from 0–3 according to the NASH-CRN histological schema25. Hepatic fibrosis was quantified from stages 0–4 and for the purpose of this analysis advance fibrosis was defined as fibrosis stage ≥ 3 with graft cirrhosis as stage 4.
Vibration Controlled Transient Elastography (VCTE):
VCTE was performed using Fibroscan® 502 Touch software (Echosens, Paris, France). Experienced operators performed all VCTE examination in all patients after an overnight fast. Subjects were placed in supine position with the right arm in maximal abduction and measurements were taken over the right hepatic lobe through the intercostal space14. All studies were started using M probe and XL probe was used only if prompted by the 502 Touch software. LSM and CAP values were obtained simultaneously. A LSM exam was considered unreliable if the IQR/Median >30%, while technical failure was defined as inability to obtain 10 valid measurements.
Statistical Analysis:
Summary statistics including means, standard deviations and percentages are presented. Diagnostic statistics including sensitivity, specificity, positive predictive value (PPV), negative predictive value (NPV), and cross-validated (using jack-knife procedure) using area under the receiver operating curve (AUROC) and 95% confidence intervals. Diagnostic statistics and CAP cutoffs for increasing pairwise steatosis grade [0 vs. 1–3; 0–1 vs. 2–3; and 0–2 vs. 3] and LSM cut-offs for increasing pairwise fibrosis stages [0 vs. 1–4; 0–1 vs. 2–4; 0–2 vs. 3–4; and 0–3 vs. 4] were determined at optimal cut-offs using Youden Index, as well as both sensitivity fixed at 90% and specificity fixed at 90%. To evaluate the relationship between histological parameters and VCTE parameters (CAP and LSM), linear regression models were constructed with the VCTE parameter as the outcome variable. Similarly, regression models using clinical and VCTE parameters was also constructed. Multivariate models to assess the association between histological parameters and clinical measurements and VCTE outcomes were constructed. Finally, to evaluate factors associated with use of XL-probe over M-probe, regression models using gender, body mass index (BMI), age, obesity, diabetes, hypertension, and time from transplant were constructed. Variables noted to be significant in univariate analysis, as defined by a p-value <0.25, were used to construct multivariate regression using stepwise model selection. A nominal p-value of < 0.05 was considered statistically significant.
RESULTS:
Study Population
Patients undergoing a liver biopsy were screened (N=113), however, 10 were excluded (Supplementary figure). Of the remaining 108 patients VCTE exam was successful in 99 patients who were included in the final analysis (Table 1). The major indication for LT (n, %) was HCV (38, 38.4%), NASH (17, 17.2%), and alcohol (13, 13.1%). The median time [interquartile range (IQR)] from LT to liver biopsy was 61 (21, 128) months. The median time [interquartile range (IQR)] from LT to VCTE was 76 (25,130) months. The absolute median time [Interquartile range (IQR)] from liver biopsy to VCTE was 41 (19, 84) days, with 38 (38%) subjects having a liver biopsy within 30 days of VCTE. The majority of the cohort consisted of non-Hispanic Caucasians (N=67 or 67%), males (N=60 or 59%), and had mean age of 53 (interquartile range [IQR] 42, 58) years. The median BMI of the cohort was 28 (24.2, 32.5) kg/m2 and 37% were obese with the BMI >30kg/m2. The distribution of steatosis grade 0, 1, 2, and 3 was 62%, 27%, 5%, and 6%. Hepatic steatosis was present in largely patients transplanted for NASH cirrhosis (n=15) and those transplanted for non-NASH cirrhosis who developed cardiometabolic conditions post-LT (n=23). No association between choice of immunosuppression, graft steatosis at LT and presence of hepatic steatosis on liver biopsy was noted. The distribution of fibrosis stage 0, stage 1, stage 2, stage 3, and stage 4 was 50%, 29%, 5%, 10% and 7%. The use of XL-probe was recommended by the device software in 31 patients.
Table 1:
Baseline characteristics of the study cohort.
| N/% Median/Interquartile Range |
|
|---|---|
| DEMOGRAPHICS | |
| Age (years) | 53 (42, 58) |
| Gender (%male) | 59 (60%) |
| Ethnicity | |
| Caucasian | 66 (67%) |
| African American | 28 (28%) |
| ETIOLOGY OF LIVER DISEASE | |
| Hepatitis C | 38 (38%) |
| Nonalcoholic Steatohepatitis | 17 (17%) |
| Alcoholic Cirrhosis | 13 (13%) |
| MEDICAL CO-MORBIDITIES | |
| Diabetes | 38 (38%) |
| Hyperlipidemia | 54(54%) |
| Obesity | 37 (37%) |
| LABORATORY | |
| ALT (IU/L) | 38 (24, 95) |
| AST (IU/L) | 41 (24, 95) |
| Alkaline Phosphatase (IU/L) | 117(84, 189) |
| Bilirubin(mg/dL) | 0.7 (0.5, 1.3) |
|
HISTOLOGY FIBROSIS |
|
| Stage 0 | 49.5% |
| Stage 1 | 29.3% |
| Stage 2 | 4.0% |
| Stage 3 | 10.1% |
| Stage 4 | 7.1% |
| STEATOSIS | |
| Grade 0 | 61.6% |
| Grade 1 | 27.3% |
| Grade 2 | 5.1% |
| Grade 3 | 6.1% |
| VCTE Probe (XL probe) | 31 (31.3%) |
The VCTE examination was considered unreliable in 7, while the failure to obtain any measurements occurred in 2 patients. The median age of the cohort with failed examination was 58 years (IQR 47, 65) and consisted predominantly of males (56%). One patient received partial living donor LT while the rest were deceased donor LT.
Performance Diagnostics of Controlled Attenuation Parameter
The median [quartiles] CAP values (dB/m) for steatosis grade 0, grade 1, grade 2 and grade 3 are 210 [167, 250], 272 [245, 309], 348 [323, 379] and 335 [312, 354] (Figure 1). The cross-validated AUROC for differentiating steatosis grade 0 vs. 1–3, steatosis grades 0–1 vs. 2–3, and grades 0–2 vs. 3 were 0.86 (0.79, 0.93), 0.94 (0.89, 0.99) and 0.89 (0.83, 0.96), respectively (Table 2). The cut-off values calculated using Youden Index for differentiating steatosis grade 0 from grades 1–3, grades 0–1 from grades 2–3 and grades 0–2 from grade 3 was 270dB/m, 295dB/m, and 295dB/m, respectively. At fixed sensitivity of 0.90, a cut-off value of 217 provided a PPV of 0.56 and NPV 0.92 for detecting presence of any steatosis. With specificity fixed at 0.90, a cut-off value of 285 dB/m yielded a PPV and of 0.77 and 0.75, respectively. The diagnostic accuracy of CAP was similar whether the VCTE was done within 30 days of the liver biopsy or not (Table 3)
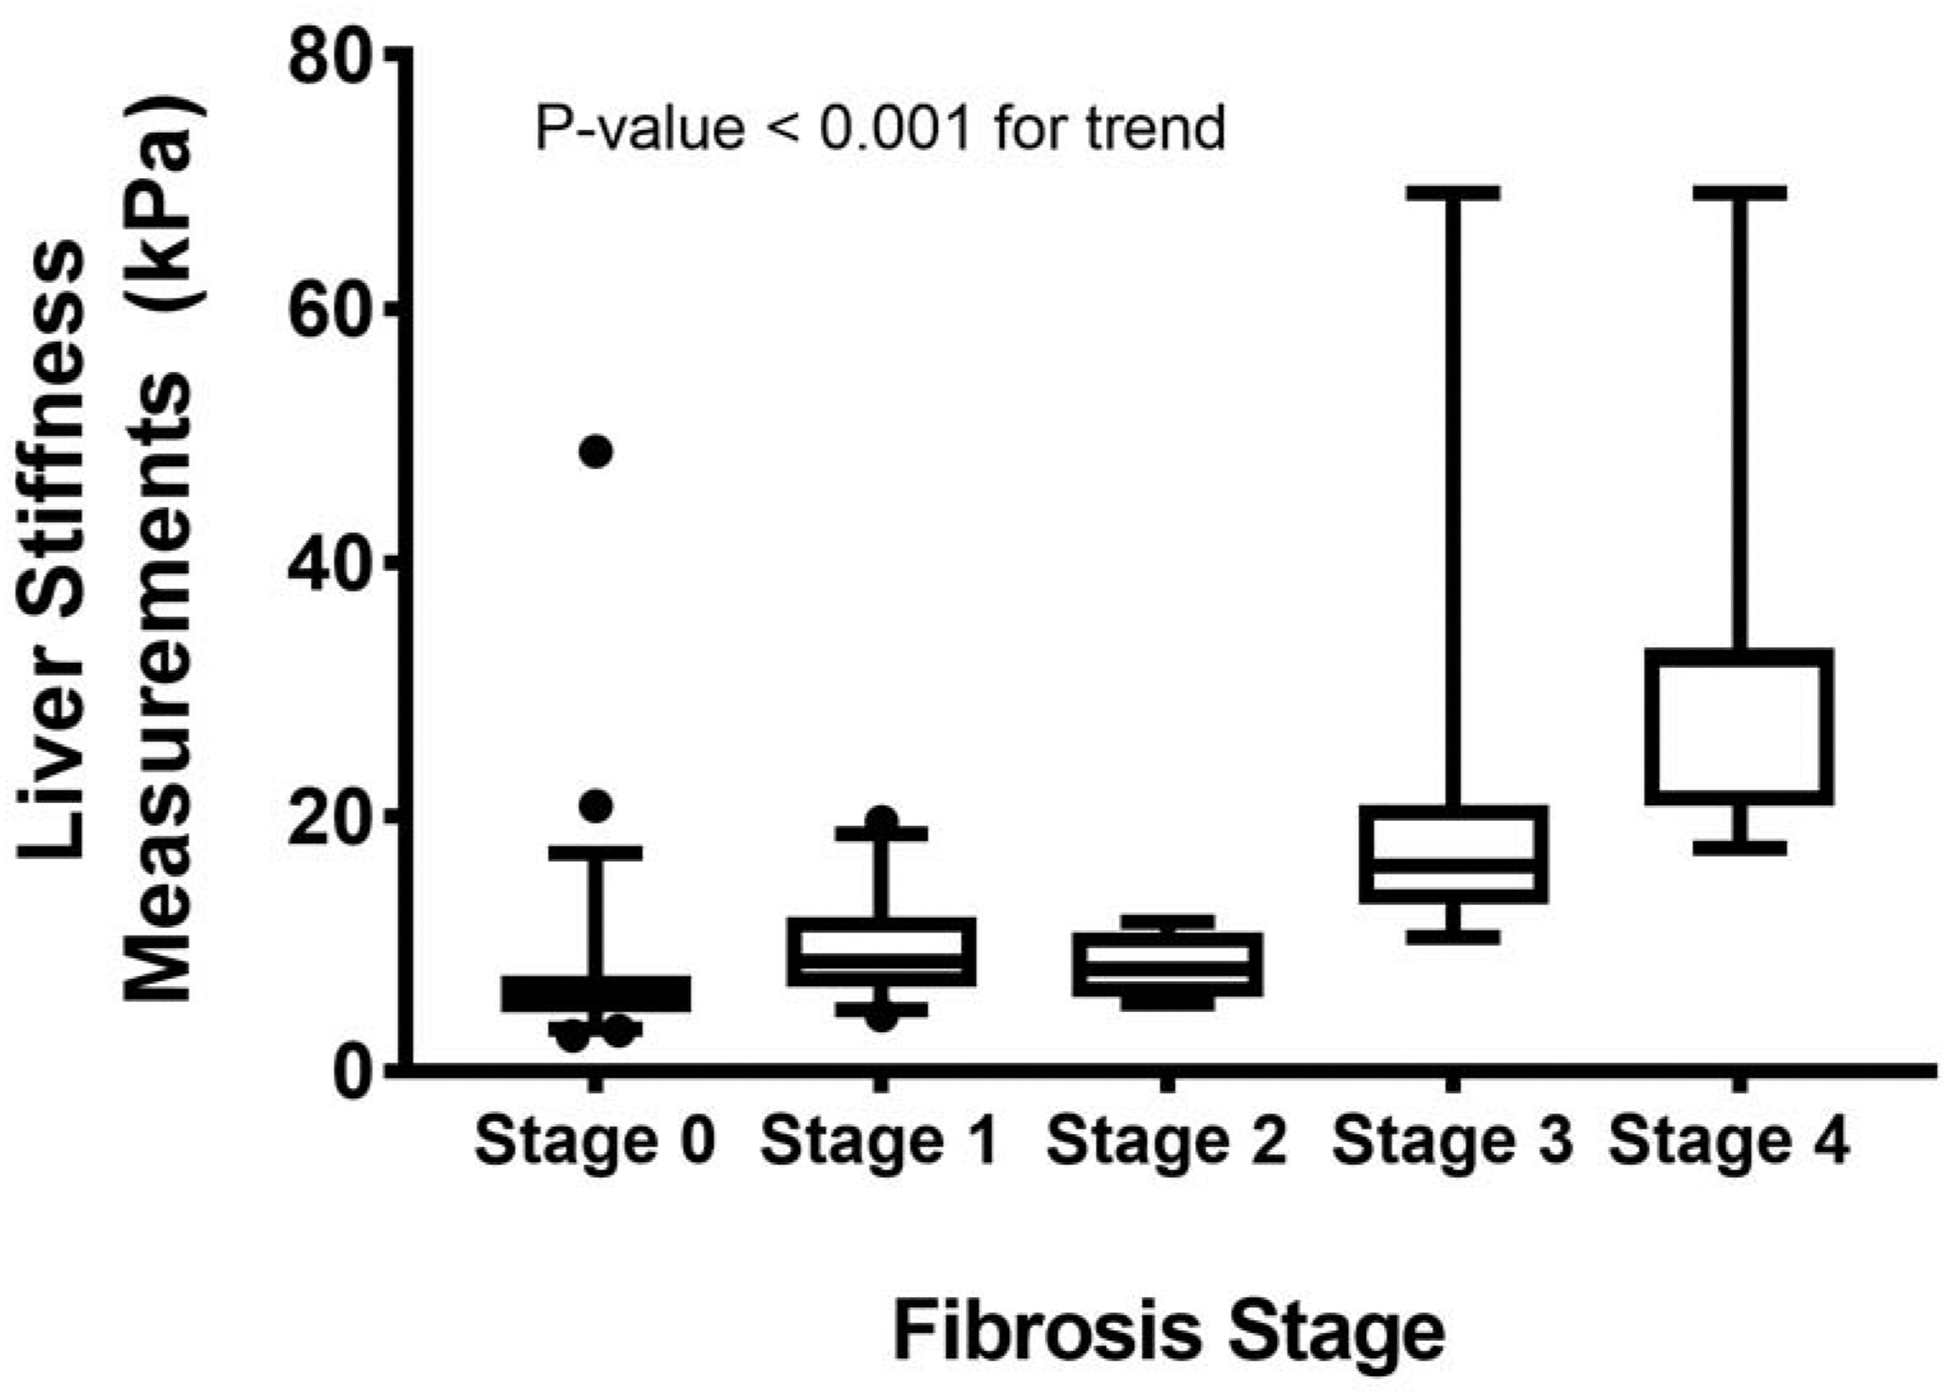
Figure 1:
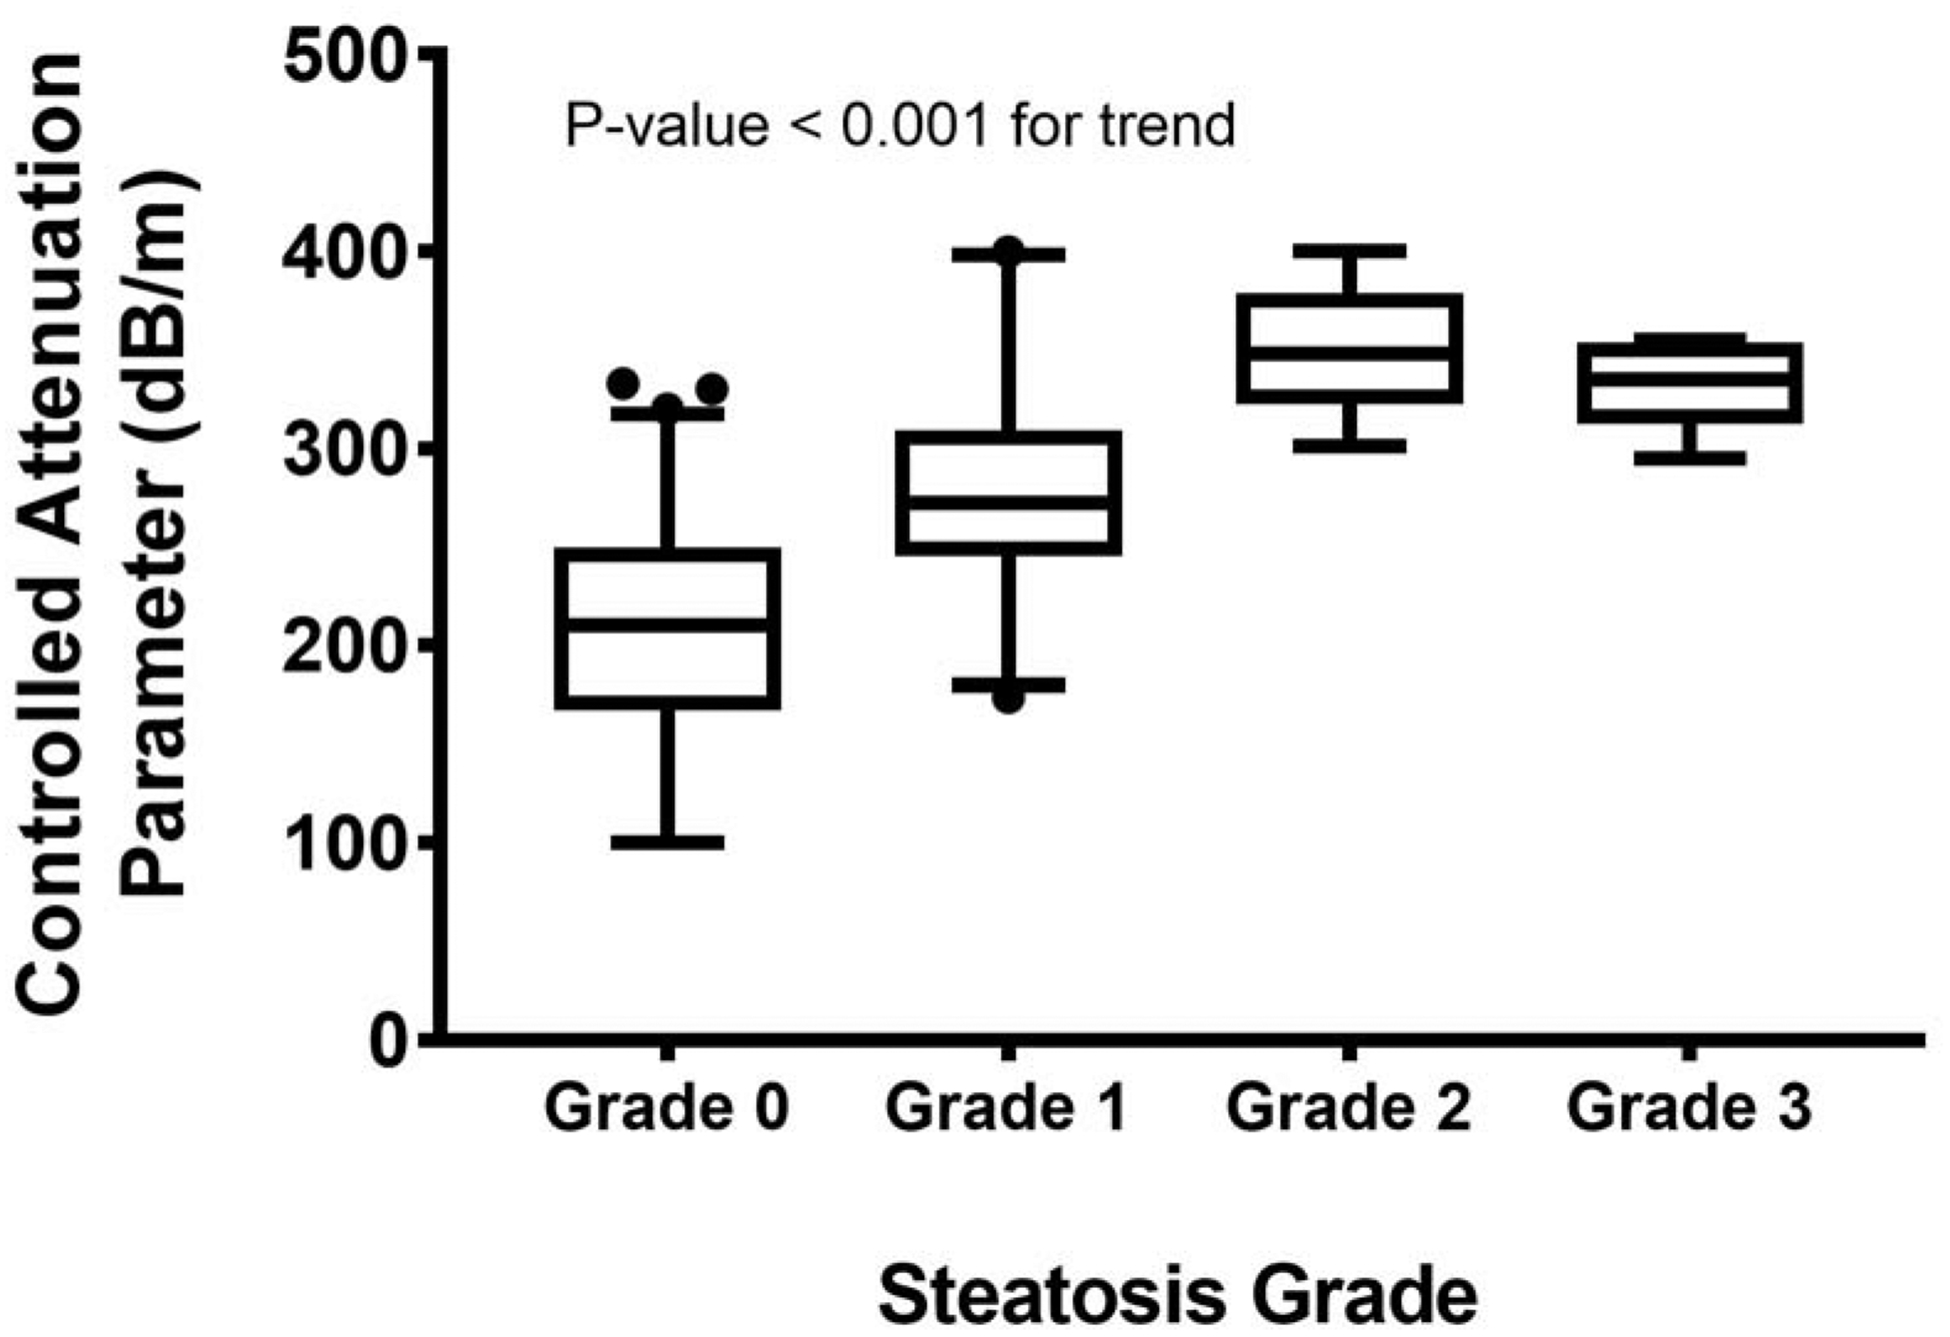
Liver stiffness measurements by VCTE according to fibrosis stage by liver biopsy.
Table 2:
Performance diagnostics of CAP assessing steatosis grade
| Steatosis Grade | AUROC (95% CI) | Cut-off (dB/m) | Sens | Spec | PPV | NPV |
|---|---|---|---|---|---|---|
| 0 vs. 1–3 | 0.876(0.78, 0.93) | 270 | 0.74 | 0.87 | 0.78 | 0.84 |
| 0–1 vs. 2–3 | 0.94 (0.89, 0.99) | 295 | 1.0 | 0.89 | 0.52 | 1.0 |
| 0–2 vs. 3 | 0.89 (0.83, 0.96) | 295 | 1.0 | 0.84 | 0.29 | 1.0 |
| SENSITIVITY FIXED AT 0.90 | ||||||
| 0 vs. 1–3 | 217 | 0.90 | 0.54 | 0.56 | 0.92 | |
| 0–1 vs. 2–3 | 301 | 0.90 | 0.89 | 0.50 | 0.99 | |
| 0–2 vs. 3 | 295 | 0.90 | 0.84 | 0.29 | 1.0 | |
| SPECIFICITY FIXED AT 0.90 | ||||||
| 0 vs. 1–3 | 285 | 0.53 | 0.90 | 0.77 | 0.75 | |
| 0–1 vs. 2–3 | 328 | 0.72 | 0.90 | 0.50 | 0.96 | |
| 0–2 vs. 3 | 337 | 0.50 | 0.90 | 0.25 | 0.97 | |
Table 3:
Impact of time difference between liver biopsy and VCTE on performance of VCTE.
| Predictor | Outcome | AUROC | P-value from test of independence of AUROC | |
|---|---|---|---|---|
| VCTE and biopsy within 30 days (N=38) | VCTE and biopsy more than 30 days (N=61) | |||
| STEATOSIS GRADE | ||||
| CAP | 0 vs. 1–3 | 0.89 (0.78, 1.0) | 0.85 (0.74, 0.95) | 0.5697 |
| 0–1 vs. 2–3 | 0.92 (0.82, 1.0) | 0.96 (0.91, 1.0) | 0.4667 | |
| 0–2 vs. 3 | 0.77 (0.63, 0.91) | 0.95 (0.90, 1.0) | 0.0174 | |
| FIBROSIS STAGE | ||||
| LSM | 0 vs. 1–4 | 0.77 (0.61, 0.92) | 0.86 (0.76, 0.95) | 0.3447 |
| 0–1 vs. 2–4 | 0.82 (0.59, 1.0) | 0.92 (0.84, 1.0) | 0.3882 | |
| 0–2 vs. 3–4 | 0.96 (0.90, 1.0) | 0.97 (0.92, 1.0) | 0.8326 | |
| 0–3 vs. 4 | 0.99 (0.97, 1.0) | 0.96 (0.91, 1.0) | 0.2270 | |
Performance Diagnostics of Liver Stiffness Measurements
The median [quartile] LSM scores (kPa) for fibrosis stage 0, 1, 2, 3, and 4 was 6.1 [4.7, 7.6], 8.6 [6.7, 12.1], 8.1 [5.8, 11.0], 16.2 [13.2, 21.0], and 32.4 [20.9, 33.3] kPa, respectively (Figure 2). The diagnostic accuracy of LSM for classifying presence of varying stages of hepatic fibrosis is presented in Table 3. The cross-validated AUROC for differentiating fibrosis stage 0 from stages 1–4 was 0.82 (95% CI 0.74, 0.90); fibrosis stage 0–1 from fibrosis stage 2–4 was 0.87 (0.78, 0.96); fibrosis stage 0–2 from fibrosis stage 3–4 was 0.94 (0.88, 0.99); and fibrosis stage 0–3 from fibrosis stage 4 was 0.92 (0.79, 1.0). The cutoff values obtained using Youden Index for maximizing specificity and sensitivity are presented in Table 3. The optimal cut-offs was 7.4 kPa for differentiating fibrosis stage 0 from fibrosis stages 1–4, 10.5kPa for fibrosis stages 0–1 from fibrosis stages 2–4, 10.5 kPa for fibrosis stages 0–2 from fibrosis stages 3–4 and 20.9 kPa for fibrosis stages 0–3 from fibrosis stage 4. The LSM cut-off values with sensitivity fixed at 0.90 for differentiating dichotomous fibrosis stages were 6.3 kPa for fibrosis stage 0 vs. stages 1–4; 7.4 kPa for fibrosis stages 0–1 vs. stages 2–4, 10.5 kPa for fibrosis stages 0–2 vs. stages 3–4; and 7.5 kPa for fibrosis stages 0–3 vs. stage 4. The PPV and NPV for detecting any fibrosis (fibrosis stage 0 vs. fibrosis stages 1–4) was 0.66 and 0.84, respectively, at fixed sensitivity. With higher fibrosis stages, the PPV was lower but NPV gradually increased from 0.96 for excluding moderate fibrosis (fibrosis stages 0–1 vs. fibrosis stages 2–4), 0.99 for advanced fibrosis (fibrosis stages 0–2 vs. fibrosis stages 3–4) and 1.0 for cirrhosis (Table 3). In contrast, at specificity fixed at 0.90 the cut-off values for differentiating dichotomous fibrosis stages were 10.2 kPa for fibrosis stage 0 vs. stages 1–4; 13.5 kPa for fibrosis stages 0–1 vs. stages 2–4; 13.3 kPa for fibrosis stages 0–2 vs. fibrosis stages 3–4 and 16.9 kPa for fibrosis stages 0–3 vs. fibrosis stage 4. The PPV was 0.76, 0.57, 0.53 and 0.55 for detecting any fibrosis, more than mild, more than moderate, advanced fibrosis and cirrhosis and the corresponding NPV were 0.76, 0.94, 0.99 and 0.99, respectively. The diagnostic accuracy of LSM was not affected by time duration between liver biopsy and VCTE (Table 3).
Figure 2:
Controlled attenuation parameter (CAP) according to steatosis grade by liver biopsy.
Regression Models
Linear regression models were constructed to assess the association between VCTE and histological parameters. A single grade change in hepatic steatosis corresponded to a 53 dB/m (95% CI; 30, 66) change in CAP (P<0.001). Similarly, a single stage changes in fibrosis corresponded to a 5.1 kPa (3.7, 6.6) increase in LSM (P<0.001). None of the other histological factors were associated with either CAP or LSM values. The only clinical parameter that was significantly associated with LSM was age at the time of VCTE (P<0.001). No univariate associations between any of the other clinical parameters (ALT, AST, bilirubin, BMI, obesity, gender, medical co-morbid conditions) and LSM values was noted. In patients with simultaneously available biopsy and VCTE, the multivariate model using all of the histological and clinical parameters resulted in only age and fibrosis being significant predictors of LSM. Holding fibrosis constant, a 5-year increase in age corresponded to a 1.13kPA increase in LSM. Holding age constant, a one stage increase in fibrosis stage yielded a 2.83kPa increase in LSM.
In univariate analysis, factors associated with use of the XL- vs. the M-probe were AST, ALT and diabetes. The log10 of AST and ALT were used to build these models due to the highly skewed nature of the original variables. Holding other predictors constant, patients with diabetes had OR of 3.52 (95% CI; 1.35, 9.17; p<0.01) for M-probe failure than patients without it. Furthermore, a one unit decrease in the log10 of AST was associated with a 2.67 (95% CI: 1.35, 3.52; p<0.01)–fold increase in the odds of M-probe failure.
DISCUSSION:
Development of hepatic steatosis following LT is common regardless of the original etiology of liver disease leading to ESLD3,26 and is associated with worse outcomes. VCTE allows for detection and quantification of hepatic steatosis in patients with chronic liver disease but its diagnostic performance in LT recipients has not been previously reported. The current study demonstrates that CAP is a reliable marker of detecting presence of hepatic steatosis and has high NPV or PPV depending on whether sensitivity or specificity is fixed, respectively. Similar to the non-transplant population, however, CAP is less accurate in differentiating grades of steatosis and has overlapping cut-off values10,11. In clinical practice, CAP has the potential to identify LT recipients developing post-LT steatosis in whom implementation of measures such as lifestyle intervention and aggressive management of cardiometabolic diseases may improve outcomes. Such an approach would offer LT recipients with the best chance of long-term survival where cardiovascular disease is a major contributor to long term mortality3,27
Recurrent or de novo liver disease (e.g. hepatitis C or nonalcoholic fatty liver disease) following LT is associated with increased risk of hepatic fibrosis and progression of graft fibrosis is linked to increased morbidity and mortality2,3. Although not all individuals are at risk for disease progression, it is important to identify LT recipients at risk of developing significant fibrosis to optimize treatment of underlying conditions and anticipate adverse outcomes4,28. In the current study, the diagnostic accuracy of LSM for detecting fibrosis improved with increasing fibrosis stage and mirrors data from similar studies in non-transplant patients with chronic liver disease10,11,29. Additionally, the current study also provides operational parameters for use of VCTE. Although liver biopsy remains the gold standard for diagnosing and staging liver disease after LT, the primary goal of non-invasive assays is to identify at risk patients in whom additional confirmatory work up maybe warranted. Furthermore, non-invasive modalities may also identify patients at low risk for disease progression in whom an invasive, risky, and costly procedures maybe avoided. By fixing the sensitivity of the VCTE, we were able to use VCTE as an effective screening tool even considering compromised specificity. For example, an LSM cutoff of 10.5 kPa with fixed sensitivity has PPV 0.53 and NPV of 0.99 for identifying advanced fibrosis. Similarly, if specificity is fixed for detecting advanced fibrosis, the LSM cutoff of 13.3 kPa yields a higher PPV of 0.64 with comparable NPV of 0.96. These data will help to operationalize the incorporation of VCTE in the LT setting where there is little data to help guide clinical decision-making. The present study provides clinically relevant cutoff values that can be used to detect presence of hepatic steatosis, however, it should be noted that while the NPV value can be improved, the PPV of VCTE is less robust. Thus, VCTE can be used as a rule out test, rather than a rule in test. VCTE can therefore, be incorporated in clinical practice to potentially identify patients at risk for metabolic complications which are at higher risk in LTR with NAFLD3. In this study median time to VCTE from liver transplantation was 76 months which shows VCTE can be used for early identification of liver damage in the patient without chronic liver disease.
A major limitation to VCTE in the past has been high failure rate and unreliable examination in obese patients, which prompted development of the XL-probe and automatic probe selection software. Using these technological advancements, the failure rate was only 8% and mirrors the recently reported failure rate among a multi-center cohort of non-transplant patients14. The data regarding failure rate and unreliable examination in LT population is lacking, particularly with the newer XL-probe and automatic selection software18,19,21,22. In our cohort, the device software recommended the use of XL probe in nearly a third of our LT recipients.
The current study has some limitations, including using patients with diverse etiologies of underlying chronic liver disease rather than focusing on a single etiology. However, inclusion of all underlying liver diseases reflects real-world practice where LT recipients are heterogenous. Due to limited number of patients with each individual disease at individual transplant centers, multi-center collaborations are necessary to develop disease specific VCTE cut-offs. However, in the interim, we provide data using robust biomarker developmental methodology that can be used in clinical practice to help risk-stratify patients while such data is generated. Liver biopsy is an imperfect tool with significant variation noted on tandem liver biopsies30. Additionally, both fibrosis and steatosis are reported ordinally based on visual inspection, which is likely to introduce error when comparing to continuous output as reported by LSM and CAP values31. Finally, due to the limited sample size of patients with post-LT hepatic steatosis, detailed analysis into factors associated with development of hepatic steatosis post-LT could not be performed. However, this was not the intent of the study and this issue has been evaluated previously in larger cohorts26,32,33.
In summary, VCTE is an accurate non-invasive point of care test that can be used to detect hepatic steatosis and fibrosis in liver transplant recipients. Although, the test is accurate at identifying extremes (no fibrosis vs. advance fibrosis or no steatosis vs. steatosis), it is less robust for differentiating individual fibrosis stages or steatosis grade and has overlapping cutoff values. Our data suggest that VCTE may be useful in risk-stratifying LT recipients, to identify those with significant steatosis and/or fibrosis, in whom more intensive surveillance is indicated.
Supplementary Material
Table 4:
Performance diagnostics of LSM assessing fibrosis stages
| Fibrosis Stage | AUROC (95% CI) | Cut-off (kPa) | Sens | Spec | PPV | NPV |
|---|---|---|---|---|---|---|
| 0 vs. 1–4 | 0.82 (0.74, 0.90) | 7.4 | 0.76 | 0.76 | 0.76 | 0.76 |
| 0–1 vs. 2–4 | 0.87 (0.78, 0.96) | 10.5 | 0.81 | 0.83 | 0.57 | 0.94 |
| 0–2 vs. 3–4 | 0.94 (0.88, 0.99) | 10.5 | 0.94 | 0.83 | 0.53 | 0.99 |
| 0–3 vs. 4 | 0.92 (0.79, 1.0) | 20.9 | 0.86 | 0.95 | 0.55 | 0.99 |
| SENSITIVITY FIXED AT 0.90 | ||||||
| 0 vs. 1–4 | 6.3 | 0.90 | 0.53 | 0.66 | 0.84 | |
| 0–1 vs. 2–4 | 7.4 | 0.90 | 0.60 | 0.38 | 0.96 | |
| 0–2 vs. 3–4 | 10.5 | 0.90 | 0.83 | 0.53 | 0.99 | |
| 0–3 vs. 4 | 7.5 | 0.90 | 0.54 | 0.14 | 1.0 | |
| SPECIFICITY FIXED AT 0.90 | ||||||
| 0 vs. 1–4 | 10.2 | 0.54 | 0.90 | 0.87 | 0.66 | |
| 0–1 vs. 2–4 | 13.5 | 0.67 | 0.90 | 0.67 | 0.91 | |
| 0–2 vs. 3–4 | 13.3 | 0.82 | 0.90 | 0.64 | 0.96 | |
| 0–3 vs. 4 | 16.9 v | 0.86 | 0.90 | 0.40 | 0.99 | |
Need to Know.
Background:
Vibration-controlled transient elastography (VCTE) is a non-invasive tool for detecting hepatic steatosis and fibrosis. We aimed to evaluate the diagnostic performance of VCTE in detection of hepatic steatosis and fibrosis in patients who have undergone liver transplantation.
Findings:
VCTE accurately detected hepatic steatosis and fibrosis in recipients of liver transplants.
Implications for Patient Care:
This non-invasive method might be used to identify patients in need of confirmatory liver biopsy analysis.
Financial Support:
The work is supported by the grant UL1TR002649 from the National Institutes of Health’s National Center for Advancing Translational Science.
Abbreviations:
- LT
liver transplantation
- VCTE
vibration controlled transient elastography
- LTR
liver transplant recipients
- LSM
liver stiffness measurement
- CAP
controlled attenuation parameter
- AUROC
area under the receiver operating characteristics
- PPV
positive predictive value
- NPV
negative predictive value
- NAFLD
nonalcoholic fatty liver disease
- BMI
body mass index
- ALT
alanine aminotransferase
- AST
aspartate aminotransferase
Footnotes
Publisher's Disclaimer: This is a PDF file of an unedited manuscript that has been accepted for publication. As a service to our customers we are providing this early version of the manuscript. The manuscript will undergo copyediting, typesetting, and review of the resulting proof before it is published in its final form. Please note that during the production process errors may be discovered which could affect the content, and all legal disclaimers that apply to the journal pertain.
Conflict of interest for all authors : None
REFERENCES
- 1.Martin P, DiMartini A, Feng S, Brown R Jr, Fallon M. Evaluation for liver transplantation in adults: 2013 practice guideline by the American Association for the Study of Liver Diseases and the American Society of Transplantation. Hepatology. 2014;59(3):1144–1165. [DOI] [PubMed] [Google Scholar]
- 2.Berenguer M, Ferrell L, Watson J, et al. HCV-related fibrosis progression following liver transplantation: increase in recent years. J Hepatol. 2000;32(4):673–684. doi:S0168–8278(00)80231–7 [pii] [DOI] [PubMed] [Google Scholar]
- 3.Bhati C, Idowu MO, Sanyal AJ, et al. Long Term Outcomes in Patients Undergoing Liver Transplantation for Nonalcoholic Steatohepatitis Related Cirrhosis. Transplantation. March 2017. [DOI] [PubMed] [Google Scholar]
- 4.Pruthi J, Medkiff KA, Esrason KT, et al. Analysis of causes of death in liver transplant recipients who survived more than 3 years. Liver Transpl. 2001;7(9):811–815. [DOI] [PubMed] [Google Scholar]
- 5.Firpi RJ, Abdelmalek MF, Soldevila-Pico C, et al. One-year protocol liver biopsy can stratify fibrosis progression in liver transplant recipients with recurrent hepatitis C infection. Liver Transpl. 2004;10(10):1240–1247. [DOI] [PubMed] [Google Scholar]
- 6.Alten TA, Negm AA, Voigtlander T, et al. Safety and performance of liver biopsies in liver transplant recipients. Clin Transplant. 2014;28(5):585–589. [DOI] [PubMed] [Google Scholar]
- 7.Rockey DC, Caldwell SH, Goodman ZD, Nelson RC, Smith AD, Diseases AA for the S of L. Liver biopsy. Hepatology. 2009;49(3):1017–1044. [DOI] [PubMed] [Google Scholar]
- 8.Cassinotto C, Charrie A, Mouries A, et al. Liver and spleen elastography using supersonic shear imaging for the non-invasive diagnosis of cirrhosis severity and oesophageal varices. Dig Liver Dis. 2015;47(8):695–701. [DOI] [PubMed] [Google Scholar]
- 9.Kwok R, Tse YK, Wong GL, et al. Systematic review with meta-analysis: non-invasive assessment of non-alcoholic fatty liver disease--the role of transient elastography and plasma cytokeratin-18 fragments. Aliment Pharmacol Ther. 2014;39(3):254–269. [DOI] [PubMed] [Google Scholar]
- 10.Eddowes PJ, Sasso M, Allison M, et al. Accuracy of FibroScan Controlled Attenuation Parameter and Liver Stiffness Measurement in Assessing Steatosis and Fibrosis in Patients With Nonalcoholic Fatty Liver Disease. Gastroenterology. 2019;156(6):1717–1730. [DOI] [PubMed] [Google Scholar]
- 11.Siddiqui MS, Vuppalanchi R, Van Natta ML, et al. Vibration-controlled Transient Elastography to Assess Fibrosis and Steatosis in Patients With Nonalcoholic Fatty Liver Disease. Clin Gastroenterol Hepatol. April 2018. [DOI] [PMC free article] [PubMed] [Google Scholar]
- 12.Castera L, Foucher J, Bernard PH, et al. Pitfalls of liver stiffness measurement: a 5-year prospective study of 13,369 examinations. Hepatology. 2010;51(3):828–835. [DOI] [PubMed] [Google Scholar]
- 13.Wong VW, Vergniol J, Wong GL, et al. Liver stiffness measurement using XL probe in patients with nonalcoholic fatty liver disease. Am J Gastroenterol. 2012;107(12):1862–1871. [DOI] [PubMed] [Google Scholar]
- 14.Vuppalanchi R, Siddiqui MS, Van Natta ML, et al. Performance Characteristics of Vibration-Controlled Transient Elastography for Evaluation of Non-Alcoholic Fatty Liver Disease. Hepatology. August 2017. [DOI] [PMC free article] [PubMed] [Google Scholar]
- 15.Chen J, Yin M, Talwalkar JA, et al. Diagnostic Performance of MR Elastography and Vibration-controlled Transient Elastography in the Detection of Hepatic Fibrosis in Patients with Severe to Morbid Obesity. Radiology. 2017;283(2):418–428. [DOI] [PMC free article] [PubMed] [Google Scholar]
- 16.Karlas T, Petroff D, Sasso M, et al. Individual patient data meta-analysis of controlled attenuation parameter (CAP) technology for assessing steatosis. J Hepatol. December 2016. [DOI] [PubMed] [Google Scholar]
- 17.Laryea M, Watt KD, Molinari M, et al. Metabolic syndrome in liver transplant reciepients; prevalence and association with major vascular events. Liver Transpl. 2007;13:1109–1114. [DOI] [PubMed] [Google Scholar]
- 18.Lutz HH, Schroeter B, Kroy DC, Neumann U, Trautwein C, Tischendorf JJ. Doppler Ultrasound and Transient Elastography in Liver Transplant Patients for Noninvasive Evaluation of Liver Fibrosis in Comparison with Histology: A Prospective Observational Study. Dig Dis Sci. 2015;60(9):2825–2831. [DOI] [PubMed] [Google Scholar]
- 19.Barrault C, Roudot-Thoraval F, Tran Van Nhieu J, et al. Non-invasive assessment of liver graft fibrosis by transient elastography after liver transplantation. Clin Res Hepatol Gastroenterol. 2013;37(4):347–352. [DOI] [PubMed] [Google Scholar]
- 20.Mikolajczyk-Korniak N, Tronina O, Slubowska K, et al. Dynamic Elastography in Diagnostics of Liver Fibrosis in Patients After Liver Transplantation Due to Cirrhosis in the Course of Hepatitis C. Transplant Proc. 2016;48(5):1725–1729. [DOI] [PubMed] [Google Scholar]
- 21.Crespo G, Lens S, Gambato M, et al. Liver stiffness 1 year after transplantation predicts clinical outcomes in patients with recurrent hepatitis C. Am J Transplant. 2014;14(2):375–383. [DOI] [PubMed] [Google Scholar]
- 22.Della-Guardia B, Evangelista AS, Felga GE, Marins LV, Salvalaggio PR, Almeida MD. Diagnostic Accuracy of Transient Elastography for Detecting Liver Fibrosis After Liver Trannsplantation: A Specific Cut-Off Value Is Really Needed? Dig Dis Sci. 2017;62(1):264–272. [DOI] [PubMed] [Google Scholar]
- 23.Crespo G, Gambato M, Millan O, et al. Early non-invasive selection of patients at high risk of severe hepatitis C recurrence after liver transplantation. Transpl Infect Dis. 2016;18(3):471–479. [DOI] [PubMed] [Google Scholar]
- 24.Bhat M, Tazari M, Sebastiani G. Performance of transient elastography and serum fibrosis biomarkers for non-invasive evaluation of recurrent fibrosis after liver transplantation: A meta-analysis. Strnad P, ed. PLoS One. 2017;12(9):e0185192. [DOI] [PMC free article] [PubMed] [Google Scholar]
- 25.Kleiner DE, Brunt EM, Van Natta M, et al. Design and validation of a histological scoring system for nonalcoholic fatty liver disease. Hepatology. 2005;41(6):1313–1321. [DOI] [PubMed] [Google Scholar]
- 26.Dumortier J, Giostra E, Belbouab S, et al. Non-alcoholic fatty liver disease in liver transplant recipients: another story of “seed and soil”. Am J Gastroenterol. 2010;105(3):613–620. [DOI] [PubMed] [Google Scholar]
- 27.Fussner LA, Heimbach JK, Fan C, et al. Cardiovascular disease after liver transplantation: When, What, and Who Is at Risk. Liver Transpl. 2015;21(7):889–896. [DOI] [PubMed] [Google Scholar]
- 28.Watt KD, Pedersen RA, Kremers WK, Heimbach JK, Charlton MR. Evolution of causes and risk factors for mortality post-liver transplant: results of the NIDDK long-term follow-up study. Am J Transplant. 2010;10(6):1420–1427. [DOI] [PMC free article] [PubMed] [Google Scholar]
- 29.Shi KQ, Tang JZ, Zhu XL, et al. Controlled attenuation parameter for the detection of steatosis severity in chronic liver disease: a meta-analysis of diagnostic accuracy. J Gastroenterol Hepatol. 2014;29(6):1149–1158. [DOI] [PubMed] [Google Scholar]
- 30.Poynard T, Mathurin P, Lai C-L, et al. A comparison of fibrosis progression in chronic liver diseases. J Hepatol. 2003;38(3):257–265. [DOI] [PubMed] [Google Scholar]
- 31.Boursier J, Vergniol J, Guillet A, et al. Diagnostic accuracy and prognostic significance of blood fibrosis tests and liver stiffness measurement by FibroScan in non-alcoholic fatty liver disease. J Hepatol. 2016;65(3):570–578. [DOI] [PubMed] [Google Scholar]
- 32.Vallin M, Guillaud O, Boillot O, Hervieu V, Scoazec JY, Dumortier J. Recurrent or de novo nonalcoholic fatty liver disease after liver transplantation: natural history based on liver biopsy analysis. Liver Transpl. 2014;20(9):1064–1071. [DOI] [PubMed] [Google Scholar]
- 33.Yalamanchili K, Saadeh S, Klintmalm GB, Jennings LW, Davis GL. Nonalcoholic fatty liver disease after liver transplantation for cryptogenic cirrhosis or nonalcoholic fatty liver disease. Liver Transpl. 2010;16(4):431–439. [DOI] [PubMed] [Google Scholar]
Associated Data
This section collects any data citations, data availability statements, or supplementary materials included in this article.