Abstract
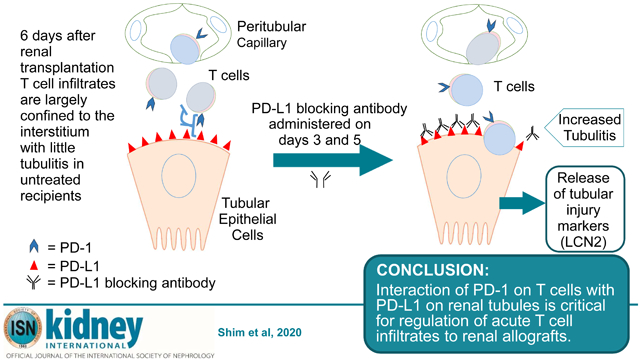
Allogeneic transplants elicit dynamic T cell responses that are modulated by positive and negative co-stimulatory receptors. Understanding mechanisms that intrinsically modulate the immune responses to transplants is vital to develop rational treatment for rejection. Here, we have investigated the impact of programed cell death-1 (PD-1) protein, a negative co-stimulatory receptor on the rejection of MHC incompatible kidney transplants in mice. T cells were found to rapidly infiltrate the kidneys of A/J mice transplanted to C57BL/6 mice which peaked at six days and decline by day 14. The T cells primarily encircled tubules with limited infiltration of the tubular epithelium. Lipocalin 2 (LCN2), a marker of tubular injury, also peaked in the urine at day six and then declined. Notably, flow cytometry demonstrated that most of the T cells expressed PD-1 (over 90% of CD8 and about 75% of CD4 cells) at day six. Administration of blocking antibody to PD-L1, the ligand for PD-1, before day six increased T cell infiltrates and urinary LCN2 causing terminal acute rejection. In contrast, blocking PD-1/PD-L1 interactions after day six caused only a transient increase in urinary LCN2. Depleting CD4 and CD8 T cells virtually eliminated LCN2 in the urine in support of T cells injuring tubules. Thus, our data indicate that PD-1/PD-L1 interactions are not just related to chronic antigenic stimulation of T cells but are critical for the regulation of acute T cell responses to renal transplants.
Keywords: acute kidney injury, acute rejection, inflammation, lymphocytes, renal pathology, transplantation
Graphical Abstract
Introduction
The balance between costimulatory and coinhibitory receptors regulates T cell responses. The co-inhibitory molecule programmed cell death-1(PD-1) was originally identified as the inhibitory receptor responsible for CD8 T cell exhaustion during chronic stimulation by viral infections and cancer 1. Engagement of PD-1 by its ligand programmed death-ligand 1 (PD-L1) transduces a signal that inhibits T-cell proliferation, cytokine production and cytolytic function. However, recent data from models of viral infection in mice demonstrate that PD-1 is rapidly expressed on CD8 T cells as the result of antigen specific TCR signaling 2. In this model, TCR signaling was found to regulate PD-1 expression. Subsequently, CD8 T cells continued to express high levels of PD-1 during expansion and production of granzyme B. These findings revealed that PD-1 modulates the earliest steps in T cell responses to viral antigens.
Both experimental and clinical evidence indicates PD-1 can modulate rejection of transplants. Clinically, PD-L1 is upregulated in renal transplants during episodes of rejection 3. PD-L1 can be induced on human tubular epithelial cells in vitro by interferon and these cells inhibit proliferation of CD4 T cells and cytokine production by CD8 T cells 3. A more recent study indicated that expression of PD-1 on CD4 and CD8 T cells in the first few weeks after transplantation was predictive of risk of rejection 4. Moreover, treatment of cancer in renal transplant recipients with antibodies to PD-1 has been linked to T cell-mediated rejection in multiple reports 5-8.
In mice, inhibition of PD-1/PD-L1 interactions accelerates rejection of heterotopic cardiac allografts as well as skin and islet allografts 9-14. Experiments using chimeric mice that expressed PDL1 on either hematopoietic or nonhematopoietic cells of transplanted hearts demonstrated that PDL1 expression on donor parenchymal cells is critical to prevent chronic rejection and to establish tolerance 13, 15. Because much of the data comes from PD-1 or PD-L1 deficient mice, this precludes probing the kinetics of PD-1 function during rejection.
Therefore, we investigated parameters of PD-1 expression as T cell responses develop to renal allografts in mice. Remarkably, PD-1 is expressed by the majority of CD4 and CD8 T cells that infiltrate the graft acutely. The number of PD-1+ T cells in the allografts peaks at 6 days and declines from 14 to 28 days as chronic rejection evolves. Selectively blocking PD-L1 before or after 6 days demonstrated that PD-1 was critical to modulating the initial expansion of T cells. The extent of PD-1 expression and function in early T cell infiltrates of renal transplants provides important new insights into the underlying control of nascent immune responses to allografts.
Results
Kinetics of CD4 and CD8 T cell infiltrates following renal transplantation
We have reported previously that MHC incompatible A/J (H-2a) renal allografts survive more than 4 weeks in C57BL/6 (H-2b) recipients and serum creatinine levels are normal until rejection 16, 17. Although circulating donor specific antibodies are detected within a week, antibody titers do not peak until 2 to 3 weeks 16. Likewise deposits of C4d are low to moderate at 6 days and intensify at 14 days with dilatation of peritubular capillaries, endothelial swelling and margination of monocytes by 28 days (Supplemental Fig. S1). However, immunohistology also revealed an intense T cell infiltrate already 6 days after transplantation. The infiltrates were associated with increased RNA message in the allografts for the T cell-related mediators CCR5, TNFα, granzyme B and perforin that were detected at 3 days, peaked at 6 days and decreased by 14 days after transplantation 16.
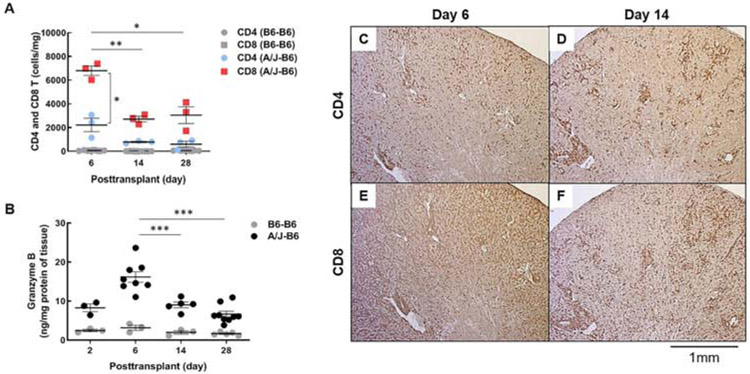
To better define T cell infiltrates in allografted kidneys, flow cytometry was performed to quantify CD4 and CD8 T cells isolated from the allografts at 6, 14 and 28 days after transplantation. The absolute number of CD8 T cells in the graft peaked at day 6 (6,805 ± 400 cells/mg) and declined by more than half at days 14 and 28 (2,725 ± 234 and 3,056 ± 704 cells/mg, respectively). CD4 T cells had similar kinetics but were about 3-fold fewer than CD8 T cells at each time: 2,224 ± 565 cells/mg on day 6 decreasing to 790 ± 54 and 606 ± 242 cells/mg on days 14 to 28, respectively (Fig. 1A). Isografts had low numbers of both CD4 and CD8 T cells at each time. Granzyme B measured by ELISA in graft homogenates paralleled the T cell infiltrates increasing from about 9 ng/mg of tissue at 2 days to 16 ± 1.4 ng/mg at 6 days and progressively decreasing 14 and 28 days after transplantation (9 ± 0.7 and 7 ± 0.8 ng/mg, respectively). In contrast, granzyme B remained below 5 ng/mg at all times in isografts (Fig. 1B).
Figure 1. Kinetics of T cell infiltration in kidney allografts.
(A) Graft-infiltrating T cells in recipients with isografts (B6-B6) and allografts (A/J-B6) were analyzed at posttransplant days 6, 14, and 28 by flow cytometry. Each point represents data from an individual sample. Bars represent mean ± SEM. *P < 0.05, **P < 0.01, ***P < 0.001 by 2-way ANOVA with Tukey’s multiple comparisons test. (B) Granzyme B in grafts was measured at days 2, 6, 14, and 28 by ELISA. Representative histology of diffuse CD4 and CD8 T cells at day 6 (C, E) and periarterial infiltrates at day 14 (D, F) (brown; DAB).
Immunohistology demonstrated a diffuse interstitial infiltrate of CD8 T cells throughout the cortex of allografts at 6 days. Interstitial infiltrates of CD4 T cells were more moderate. By 14 days, the interstitial infiltrates had diminished and both CD4 and CD8 T cells were concentrated around the arcuate arteries and to a lesser extent around glomeruli (Fig. 1C-F).
The acute kidney injury marker LCN2 reflects T cell infiltrates
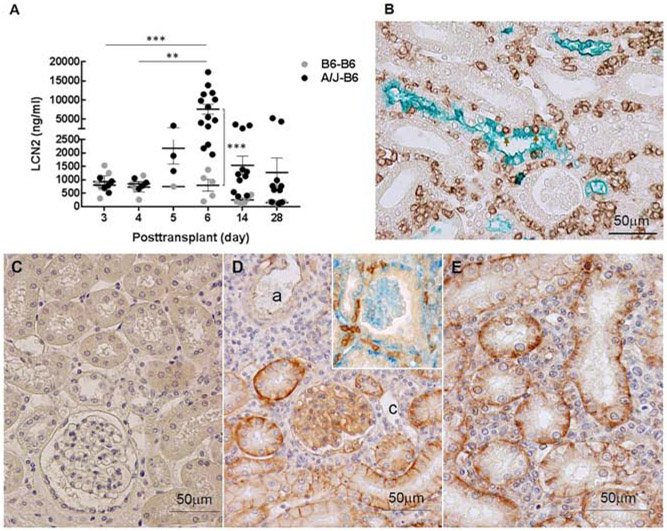
Measurement of LCN2 in urine provides a noninvasive test that can be performed on serial samples from individual recipients to monitor tubular injury. Urine from days 3 and 4 after transplantation contained less than 1,000 ng of LCN2 /ml from both isografts and allografts. At day 5, urinary LCN2 increased to 2,217 ng/ml from allografts, but was unchanged in urine from isografts (Fig. 2A). Urinary LCN2 levels peaked in allografted mice at day 6 (7,165 ± 1298 ng/ml vs 801 ± 216 ng/ml for isografted controls) and then decreased at days 14 and 28. Immunohistology demonstrated LCN2 was concentrated in blebs released from tubular epithelial cells into the lumen. Double stains demonstrated numerous CD8 T cells in the interstitium around tubules and some CD8 T cells penetrating the tubules (Fig. 2B).
Figure 2. LCN2 expression following kidney transplantation.
(A) LCN2 was measured in urine samples from recipients with isografts (B6-B6) and allografts (A/J-B6) by ELISA. Each point represents an individual sample. Bars represent mean ± SEM. **P < 0.01, ***P < 0.001 by 2-way ANOVA with Sidak’s multiple comparisons test. (B) Representative double stain for LCN2 (green; Vina green) and CD8 T cells (brown; DAB) in allografts at posttransplant day 6. Arrows indicate CD8 cells infiltrating tubular epithelium. PD-L1 expression in iso- and allografts at day 6. No staining for PD-L1 in isografts (C) compared to strong staining on the basal aspects of tubular epithelium and glomerular capillary endothelium in allografts (D, E). Arterial (a) and peritubular capillary (c) endothelium is weakly positive or negative (brown; DAB). T cells (brown: DAB) in contact with PD-L1(blue; Vector Blue) on tubular epithelium (inset of D).
Most graft-infiltrating T cells are PD-1 positive and tubules express PD-L1
The pathology was notable at 6 days (Fig. 2B) in that the interstitial infiltrates were extensive and encompassed the majority of tubules (Banff grade i3), but limited numbers of T cells invaded the tubules (tubulitis grade t1). Glomerulitis and peritubular capillaritis were also limited. Extensive interstitial infiltrates are an expected consequence of no immune suppression in this model, but the limited tubulitis was unexpected. In vitro studies have demonstrated that expression of PD-L1 on cytokine activated human tubular epithelial cells can inhibit proliferation of CD4 T cells and cytokine production by CD8 T cells expressing PD-1. Therefore, we examined the expression of PD-L1 and PD-1. Immunohistology detected little PD-L1 in isografts at 6 days (Fig. 2C). In contrast, the extensive interstitial infiltrates of T cells in the cortex of renal allografts at day 6 was accompanied by an upregulation of PD-L1 on the basal and lateral border of the proximal and distal tubular epithelial cells. PD-L1 was also expressed in glomerular capillaries. Endothelial cells of peritubular capillaries and arteries were negative or weakly positive for PD-L1 (Table 1). Many interstitial PD-1 positive T cells were in contact with PD-L1 expressing tubular epithelium at day 6 (Fig. 2D and E).
Table 1:
Summary of infiltrates of PD-1 expressing cells PD-L1 expression in renal allografts at day 6.
| Compartment | PD-1 cells | PD-L1 expression* |
|---|---|---|
| Arteries (Arcuate / Interlobular) | Prominent cuffs of PD-1+ cells surrounding arteries | Weak on endothelium; negative on smooth muscle |
| Glomerular Capillaries | Sporadic PD-1+ cells | Strong |
| Peritubular Capillaries | Diffuse interstitial infiltrate between capillaries and tubules | Negative |
| Proximal & Distal Tubules | Limited tubulitis that increases with PD-L1 blockade.** | Strong on basal and lateral border |
| Cortical Collecting system | Minor tubulitis that increases with PD-L1 blockade. | Weak |
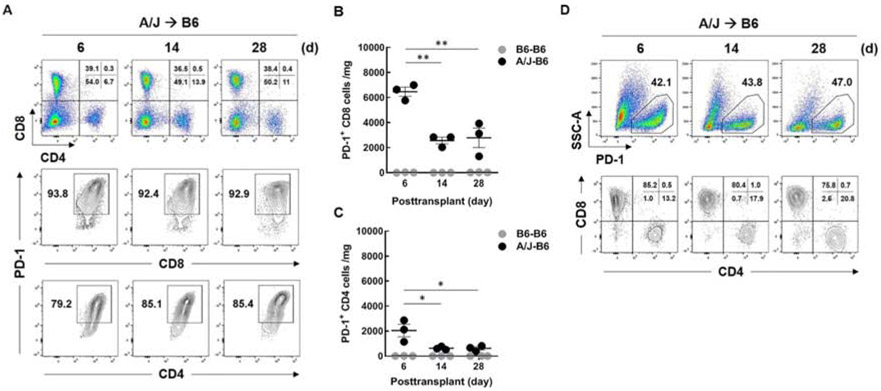
Flow cytometry demonstrated most of the CD8 and CD4 T cells expressed PD-1 (>90% of CD8 and about 75% of CD4 cells) 6 days after transplantation (Fig. 3A). The percentages of CD8 and CD4 T cells expressing PD-1 remained high at 14 and 28 days but the absolute number of T cells expressing PD-1 was highest at 6 days and decreased at 14 and 28 days (Fig. 3B and C). Moreover, over 95% of the cells that expressed PD-1 were T cells at 6, 14 and 28 days after transplantation (Fig. 3D).
Figure 3. PD-1 expression on graft-infiltrating T cells exhibit.
B6 recipients with A/J kidneys were euthanized at day 6, 14, and 28 after transplantation and intragraft T cell populations were analyzed by flow cytometry. Viable CD45+ cells (7AAD−) were gated and selected for either CD4+ or CD8+ T cells. (A) Frequency of total CD4+ and CD8+ T cells (upper), PD-1+ CD8 T cells (middle), and PD-1+ CD4 T cells (lower) for each time point. PD-1 expressing T cells in isografts (B6-B6) and allografts (A/J-B6) were analyzed. Comparison of the number of PD-1+ CD8 T cells (B) and PD-1+ CD4 T cells (C) in isografts and allografts. To define the cell populations expressing PD-1, viable CD45+ (7AAD-) cells were gated by PD-1 vs side scatter (SSC-A) (upper), then further gated with CD4 vs CD8 (lower) (D). Each point represents an individual sample. Bars represent mean ± SEM. **P < 0.01 by 1-way ANOVA with Tukey's multiple comparisons test.
Inhibition of PD-1/PD-L1 interactions increases tubular injury
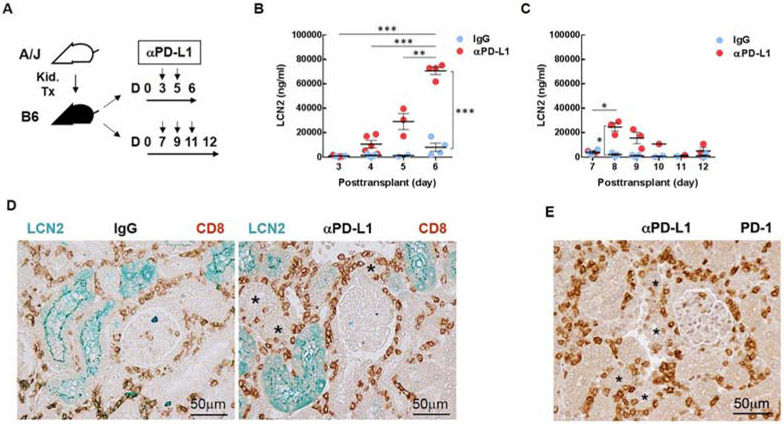
To test whether PD-1 modulated T cell responses to kidney grafts, mice were treated with a monoclonal antibody that blocked PD-L1 interaction with PD-1. Two treatment protocols were tested (Fig. 4A). In the early treatment protocol, PD-L1 blocking antibody or control IgG was administered on days 3 and 5 after transplantation. These times coincided with the increase in PD-1 expressing cells. In the delayed protocol, mice were treated on days 7, 9 and 11 coincident with the decline in T cell infiltrates.
Figure 4. PD-L1 blockade enhances tubular injury marker LCN2 following kidney transplantation.
(A) Mice were treated with antibody to PD-L1 (10F.9G2) or control IgG (LTF-2) on days 3 and 5 as an early treatment, on days 7, 9, 11 as a delayed treatment. (B) LCN2 was measured in the urine samples collected before (day 3) and after (days 4, 5, and 6) injection. (C) LCN2 was measured in the urine samples collected before (day 7) and after (days 8, 9, 10, 11, and 12) injection. (D) Representative histology of LCN2 (green) and CD8 T cells (brown) in the grafts (day 6) from recipients treated with antibody to PD-L1 (Right) and control IgG (Left) at days 3 and 5. (E) Representative histology of PD-1 cells (brown) in the grafts at day 6 from recipients treated with antibody to PD-L1. LCN2 visualized with Vina green and CD8 and PD-1 with DAB (brown). Asterisk (*) indicates the tubules with infiltrating cells. Each point represents an individual sample. Bars represent mean ± SEM. *P < 0.05, **P < 0.01, ***P < 0.001 by 2-way ANOVA with Sidak’s multiple comparisons test.
Early treatment caused an exponential increase in urinary LCN2 (Fig. 4B). Before the first dose of antibody on day 3, LCN2 was 926 and 935 ng/ml of urine in mice to be treated with control IgG and antibody to PD-L1, respectively. Urinary LCN2 was elevated significantly at day 4 (10,659 ng/ml in treated vs 1,430 ng/ml in control mice) and increased progressively from day 5 through day 6 (29,116 vs 1,607 and 70,629 vs 8,099 ng/ml). These recipients were euthanized at 6 days when all 4 treated mice showed signs of distress (decreased ambulation and hunched posture), but the 4 controls were vigorous. The increased urinary LCN2 levels correlated with increased CD8 T cells infiltrating tubular epithelium at 6 days in the early treatment group (Fig. 4D). Cells infiltrating the tubules at this time also expressed PD-1 by immunohistology (Fig. 4E and Supplementary Fig. S2). The accelerated rejection was confirmed by treating 3 additional mice and following them for 7 days at which time they became anuric and lethargic, whereas the 3 controls continued produce urine and displayed normal behavior. Immunohistology confirmed that these transplants were terminally rejected with diffuse CD4 and CD8 T cell infiltrates, and diffuse C4d deposition on dilated peritubular capillaries consistent with mixed cellular and antibody-mediated rejection 18.
Delaying PD-L1 blockade greatly diminished the impact on graft function. The first dose of antibody to PD-L1 in the delayed protocol also resulted in increased urinary LCN2 within 24 hours (24,636 vs 2,089 ng/ml in controls at day 8), but LCN2 gradually decreased in urine in spite of 2 subsequent doses of antibody to PD-L1 (Fig. 4C). By day 12, urinary LCN2 levels were close to controls (5,023 vs 1,099 ng/ml of urine). All 3 treated and control recipients continued to produce urine and were vigorous at 12 days.
T cell depletion inhibits upregulation of urinary LCN2 in urine and blood urea nitrogen.
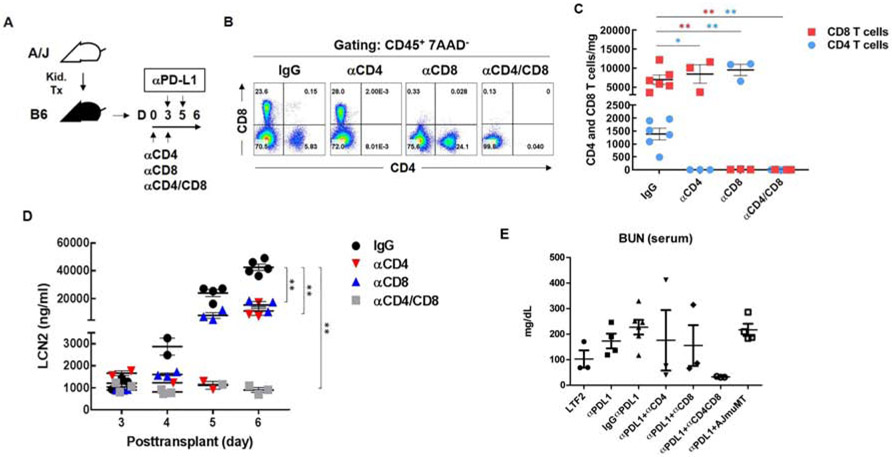
To confirm the link between T cells and increased urinary LCN2, monoclonal antibodies to CD4 (GK1.5, YTS91) and CD8 (53-6.7, YTS169.4) were administered on days 0 and 3 after transplantation to deplete T cells, which was confirmed by flow cytometry (Fig. 5A-C). It is noteworthy that combining blockade of PD-L1 with depletion of CD8 T cells resulted in a 5-fold increase in CD4 T cells (Fig. 5B and C) resulting in increased mitotically active CD4 cells in the interstitium and some cells breaching the tubular basement membrane (Supplementary Fig. S3). However, depletion of both CD4 and CD8 T cells almost completely eliminated T cells as assessed by immunohistology and flow cytometry (Fig. 5B and C). Depletion of either CD4 or CD8 T cells decreased urinary LCN2 levels by 50% at day 6. Depletion of both CD4 and CD8 T cells completely prevented increases of urinary LCN2 above the baseline at day 3 before PD-L1 blockade (Fig. 5D). The effects of PD-L1 blockade and T cell depletion was detectable to a lesser extent by increases in blood urea nitrogen (BUN). Blocking PD-L1 increased BUN at day 6. Depletion of CD4 or CD8 diminished the increase in BUN, whereas depletion of both CD4 and CD8 T cells completely prevented the increase in BUN caused by blocking PD-L1 (Fig. 5D). As expected, depletion of CD4 and CD8 also diminished C4d deposition because of decreased T cell help for B cells (Supplementary Fig. S4 and Table S1). Therefore, we transplanted A/J kidneys to muMT knockout mice that lack mature B cells and cannot generate antibody. Treatment of muMT mice with blocking antibody to PD-L1 on days 3 and 5 after transplantation resulted in oliguria by day 7. At this time, the transplants contained extensive CD8 and moderate CD4 infiltrates, but as expected no C4d deposition. LCN2 was increased in the urine (>60,000 ng/ml; n=4) and BUN was increased in the serum (Fig. 5D). These data indicate that antibody was not required for the acute rejection, increased urinary LCN2 and elevated serum BUN caused by early blocking of PD-L1.
Figure 5. T cell depletion prevents upregulation of LCN2 in urine.
(A) Mice were treated with antibodies to CD4 (GK1.5 and YTS191), CD8 (53-6.2 and 169.4) or a combination of both at days 0 and 3 after transplantation in the early treatment protocol for blocking PD-L1. (B) Depletion of T cells was confirmed by flow cytometry. Gated on CD45+ 7AAD− cells, circulating CD4 and CD8 T cells in the blood were analyzed at posttransplant day 6. (C) Absolute numbers of infiltrating CD4 and CD8 T cells were analyzed in the grafts at posttransplant day 6. (D) Urinary LCN2 was measured at days 3, 4, 5 and 6 by ELISA. (E) Blood urea nitrogen performed on serum at 6-7 days after transplantation. Each point represents an individual sample. Bars represent mean ± SEM. *P < 0.05, **P < 0.01 by 2-way ANOVA with Dunnett’s multiple comparisons test.
PD-L1 blockade increases PD-1+ T cell infiltration and effector function
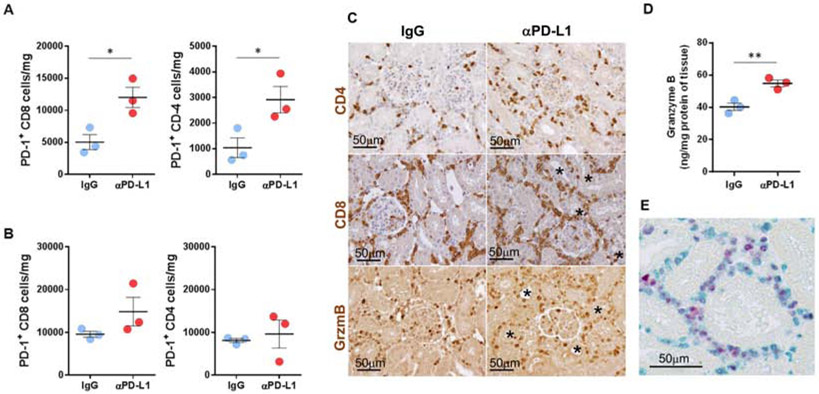
In transplants to mice treated with PD-L1 blocking antibody on days 3, 5 after transplantation, CD8 and CD4 T cells expressing PD-1 increased 2.4- (12,003 vs. 5,045 cells/mg) and 2.6-fold (2,913 vs. 1,107 cells/mg) in absolute cell numbers compared with control mice at day 6 (Fig. 6A). In the spleen, the number of PD-1+ CD8 T cells also increased but to a lesser extent (1.6-fold, 14,860 vs 9,577 cells/mg in control) whereas CD4 T cells were not significantly changed (Fig. 6B). Immunohistology demonstrated that early blockade of PD-L1 resulted in intense interstitial infiltrates of CD8 T cells and CD4 T cells that were enriched with PD1 expressing cells. Moreover, many of the infiltrating cells contained granzyme B (Fig. 6C). Higher concentrations of granzyme B were confirmed by ELISA in the grafts from the anti-PD-L1 treated recipients (Fig. 6D). The number of Ki-67+ cells in the grafts was increased by blocking PD-L1. Double staining demonstrated that many of the recently proliferated Ki-67+ cells in the grafts expressed PD-1 (Fig. 6E). Taken together, our data indicate that blocking PD-1/PD-L1 interactions during the early phase of T cell infiltration into renal allografts promotes T effector cell function. On the other hand, when PD-L1 blocking was delayed, PD-1+ CD8 T cells increased less than after early treatment (1.7-fold, 4,333 vs 2,579 cells/mg in control) with no difference in PD-1+ CD4 T cells. Granzyme B expression was enhanced in the grafts, to a much lesser extent, at day 12 (Supplementary Fig. S5).
Figure 6. PD-L1 blockade increases PD-1 expressing T cells and effector function.
The number of infiltrating PD-1+ CD8 and CD4 T cells at posttransplant day 6 in the kidney grafts (A) and the spleen (B) from the recipients treated with IgG and PD-L1 antibody. (C) Representative histology of graft-infiltrating CD4+, CD8+ and granzyme B+ cells (brown). (D) Granzyme B in the grafts was measured by ELISA. (E) Proliferating PD-1 cells (vena green) in the grafts were detected by Ki-67 (vulcan red) staining. Bars represent mean ± SEM. *P < 0.05, **p < 0.01 by unpaired t test. Gzm, granzyme B.
Discussion
The significance of checkpoint receptors in controlling T cell responses to transplants has been supported by previous experiments in mice. Many of these models used knockout mice and therefore could not determine temporal parameters of checkpoint control of rejection 13, 19-21. Other experiments combined PD-L1 blockade or PD-L1-Ig with additional interventions that alter the rejection process. 12, 22.
Our experiments demonstrate that PD-1 is extensively expressed on T cells during the initial response to renal transplants. Most of the CD8 (>90%) and CD4 (about 75%) T cells infiltrating renal allografts within the first week after transplantation express PD-1. Recent studies have found similarly high levels of PD-1 expression on antigen-specific CD8 T cells during the first days after lymphocytic choriomeningitis virus infection of mice2. This early expression of PD-1 is instrumental in modulating the expansion of T cells and production of cytokines to the viral infection. Similarly, blocking the interaction of PD-1 with PD-L1 during the first week after transplantation more than doubles the total numbers of T cells and PD-1 expressing CD8 and CD4 cells that infiltrate the graft. The increased numbers of T cells produced higher amounts of granzyme B in the graft as was reported for T cells during the viral infection2.
In vitro studies have demonstrated that expression of PD-L1 on cytokine activated human tubular epithelial cells can inhibit proliferation of CD4 T cells and cytokine production by CD8 T cells expressing PD-1 3. We found PD-L1 was expressed on the basal and lateral border of tubular epithelial cells in apparent contact with T cells in allografts at day 6 and that blocking PD-L1 in the first week after transplantation caused increased expression of the proliferation marker Ki-67 by infiltrating cells many of which expressed PD-1. These data suggest that expression of PD-L1 by tubular epithelial cells may inhibit T cell infiltration of tubular epithelium. In our experiments, the intense CD4 and CD8 infiltrates generated to transplants in the absence of immune suppression were restricted primarily to the interstitium (Banff grade i3) with limited incursion into the tubules. This checkpoint was breached by blocking PD-L1, which resulted in increased numbers of T cells infiltrating the tubular epithelium and exponential increases in urinary LCN2. Depletion experiments demonstrated that T cells caused the increase in urinary LCN2. Depleting either CD4 or CD8 T cells delayed, but did not completely prevent the increase in urinary LCN2. The transient effects of depleting either CD4 or CD8 T cells alone in combination with blocking PD-L1 during the early response to the allograft might be due to the increased expansion of the undeleted T cells. This skewed expansion of T cells was most pronounced for CD4 T cells that increased 5 fold when PD-L1 was blocked in CD8 depleted recipients. Depleting both CD4 and CD8 T cells virtually eliminated LCN2 in the urine. In contrast, absence of B cell and antibody responses did not prevent the T cell mediated tubular damage or increase in urinary LCN2 as demonstrated by blocking PD-L1 in muMT mice. These mice demonstrated intense CD8 and moderate CD4 T cell infiltrates.
Remarkably, all of these pathological effects were diminished by delaying the treatment with antibody to PD-L1 to the second week after transplantation when the number of PD-1 expressing CD8 and CD4 T cells was declining. Colvin and co-workers reported that T regulatory cells modulate rejection 3 weeks to 3 months after renal transplantation in another mouse model 23.
A key concept that emerged from our experiments is that unmodified T cell responses to renal transplants are regulated from the inception and do not evolve inexorably into graft rejection. The acute infiltration of T cells peaked 6 days after transplantation. Then the numbers of CD8 and CD4 T cells declined by more than half by day 14. We have reported previously that the T cell infiltrates were associated with increased RNA message in the allografts for the T cell-related mediators CCR5, TNFα, granzyme B and perforin that were detected at 3 days, peaked at 6 days and decreased by 14 days after transplantation16. The decrease in T cell numbers was accompanied by a regression of T cell infiltrates from a diffuse interstitial distribution in the renal cortex to more confined periarterial localization.
Clinical studies have also documented that pathological manifestations of cell-mediated rejection on protocol biopsies from stable renal transplant recipients often do not progress to overt rejection24. In this context, the effects of immunosuppressive drugs on the expression of PD-1 are pertinent. Cyclosporine has been reported to downregulate PD-1 expression 22, 25, and therefore may interfere with the intrinsic modulation of T cell responses by PD-1. In contrast, certain steroids can upregulate expression of PD-1 26 and therefore might favor intrinsic modulation of T cell responses. Understanding the mechanisms that intrinsically modulate the immune responses to transplants is vital to rational treatment of rejection.
Materials and methods
Mice
For transplantation experiments, 8-12 weeks old male C57BL/6J (B6, H-2b), B6.129S2-Ighmtm1Cgn/J (muMT, H-2b) and A/J (H-2a) mice (Jackson Laboratories, Bar Harbor, ME) were used as a kidney recipients and donors, respectively. All procedures were approved by the Institutional Animal Care and Use Committee at the Cleveland Clinic.
Kidney transplantation
Orthotopic murine kidney transplantation was performed as previously described 27.
Urine collection
Each mouse was placed in a cage with hydrophobic sand (LabSand, Braintree Scientific, MA) and urine was collected from the surface of the sand and stored frozen at −80°C until analysis. Typically, 20-100 microL of urine was collected per mouse. Urine samples were tested individually and represented by a single dot in plots. No urine was pooled for testing. When a recipient became oliguric because of rejection and insufficient urine was available no test was performed.
Blockade of PD-1/PD-L1 checkpoint
Monoclonal antibody 10F.9G2 to PD-L1 or LTF-2 isotype control IgG2b (both from BioXCell, West Lebanon, NH) were injected intraperitoneally at a dose of 200 μg on days 3 and 5 (for early treatment) and days 7, 9 and 11 (for delayed treatment).
T cell depletion
Recipient CD4 and CD8 T cells were depleted by injecting a mixture of monoclonal antibodies to mouse CD4 (clones GK1.5 and YTS191) and CD8 (clones 53-6.7 and YTS169.4) obtained from BioXCell (West Lebanon, NH), respectively or combined treatment. A total of 200 μg (100 μg of each antibody) was injected intraperitoneally on days 0 and 3 after transplantation.
Flow cytometry analysis
Excised grafts were minced and digested by collagenase (Type II, 200 U/ml) for 30 minutes at 37°C. A single-cell suspension was prepared by filtration (40-μm). Spleen were teased apart and passed through 70-μm filter after hypotonic erythrocyte lysis. The isolated cells were stained with the following antibodies: PE-anti-PD-1(J43), PE-Cy7-anti-CD4 (RM4-5) from eBioscience (San Diego, CA), Alex-Fluor 594-anti-CD8 (53-6.7), PE-Cy5-7AAD from BioLegend (San Diego, CA), FITC-anti-CD45 (30F-11) from BD Bioscience (San Jose, CA). All stained samples were acquired on LSRII (BD Bioscience) followed by analysis using FlowJo (Tree Star, Inc., Ashland, OR). Viable CD45+ cells were analyzed by CD4 vs CD8 or PD-1 vs SSC-A (Supplementary Fig. S6).
Histology
Full cross sections of allografts were immediately fixed in acid methanol (60% methanol and 10% acetic acid). Paraffin-embedded sections (5 mm) were subjected to high temperature antigen retrieval and paraffin removal in Trilogy (Cell Marque, Hot Springs, AR) in a pressure cooker. Endogenous peroxidase activity was blocked by incubation with 0.3% H2O2, and nonspecific protein interactions were blocked by incubation with a serum-free protein block (DAKO, Carpinteria, CA). The following primary antibodies were used to detect CD4 (ab183685), CD8 (ab217344), LCN2 (ab70287), PD-1 (ab214421) and Ki-67 (ab16667) from Abcam (Cambridge, MA), granzyme B (AF1865) and PD-L1 (rabbit MAB 90781; clone 2096C from R&D Systems, Minneapolis, MN). The primary antibody to mouse C4d was a previously described and validated polyclonal rabbit antibody 28. Primary antibodies were visualized using rat, rabbit, and goat on mouse HRP-Polymer Kits (Biocare Medical, Concord, CA) as secondary antibodies followed by diaminobenzidine (DAB). For double stains Vina green, Vulcan Fast Red (Biocare Medical, Concord, CA) or Vector Blue (Vector Laboratories, Burlingame, CA) chromogens were used. Sections were counterstained with hematoxylin or Periodic acid-Schiff (PAS) from Richard-Allan Scientific (Kalamazoo, MI).
ELISA
Granzyme B was measured in graft homogenates and LCN2 was measured in urine by manufacturer suggested methods (R&D Systems, Minneapolis, MN). Blood urea nitrogen was measured on serum by ELISA according to manufacturer instructions (Thermo Fisher Scientific, Waltham, MA).
Statistics
Data are represented as a mean with ± SEM. Statistical analyses were performed using Graph Pad Pad Prism 8.0 software (GraphPad Software Inc.). Significance was either determined by 2-tailed, unpaired t test or ANOVA with multiple comparisons test with P values of less than 0.05 (*P < 0.05, **P < 0.01, ***P < 0.001).
Supplementary Material
Supplementary Figure S1. Kinetics of C4d deposition following renal transplantation. No C4d in peritubular capillaries at day 2. Weak to moderate diffuse C4d staining in glomerular and peritubular capillaries at day 6. Strong diffuse C4d staining in glomerular and peritubular capillaries at day 14. Strong diffuse C4d staining in dilated peritubular capillaries at day 28 together with strong C4d staining in glomeruli and evident capillary injury.
Supplementary Figure S2. Expression of PD-L1 in relation to PD-1 positive cells infiltrating the tubules in allografts to mice treated with blocking antibody to PD-L1. Cell infiltrate at 6 days in allograft treated with blocking antibody to PD-L1. Uninflamed tubules (T) express PD-L1 (blue) on abluminal border. PD-1 (brown) expressing cells infiltrate tubule with decreased PD-L1 expression (arrow heads).
Supplementary Figure S3. PD-L1 blockade increases mitotically active CD4 T cells and tubular injury. CD4 cells (brown; DAB) in the interstitium with some undergoing mitosis (white arrows) and others breaching the PAS positive tubular basement membrane (black arrows).
Supplementary Figure S4. C4d deposition 6 days after renal allografts to mice treated with blocking antibody to PD-L1 with or without depletion of T cells. Depletion of both CD4 and CD8 greatly decreased C4d deposition.
Supplementary Figure S5. PD-L1 blockade increases PD-1 expressing T cells and effector function. The number of infiltrating PD-1+ CD8 and CD4 T cells at posttransplant day 12 in the kidney grafts (A) and the spleen (B) from the recipients treated with IgG and PD-L1 antibody. Absolute cell number was calculated based on flow cytometry analysis. Data represent mean ± SEM. *P < 0.05 by unpaired t test.
Supplementary Figure S6. Gating strategy for flow cytometry analysis. Representative images from flow cytometry analysis of cells isolated from kidney grafts 6 days after transplantation. Viable CD45+ cells were analyzed by CD4 vs CD8 or PD-1 vs SSC-A.
Supplementary Table S1: Effects of treatment with antibodies to PD-L1, CD4 and CD8 on C4d deposition kidneys 6 days after transplantation.
Translational Statement.
Pathological manifestations of T cell infiltrates on protocol biopsies from stable renal transplant recipients often do not progress to overt rejection. Our findings indicate that many of the T cells in early infiltrates of renal transplants in mice express the check point inhibitor PD-1. Blocking interactions between PD-1 and PD-L1 early after transplantation can initiate terminal rejection. Clinical evidence suggests that different immunosuppressives may modulate PD-1 expression. Understanding the mechanisms that intrinsically regulate T cell function through modulating positive and negative signals in transplants is vital to rational selection of immunuosuppressive drugs and judicious concepts of subclinical rejection.
Acknowledgements
This work is supported by grant NIH PO1 AI087586 from the NIAID to AV, RLF and WMB.
Footnotes
Disclosure
All the authors declared no competing interests.
Supplementary information is available on Kidney International's website
Publisher's Disclaimer: This is a PDF file of an unedited manuscript that has been accepted for publication. As a service to our customers we are providing this early version of the manuscript. The manuscript will undergo copyediting, typesetting, and review of the resulting proof before it is published in its final form. Please note that during the production process errors may be discovered which could affect the content, and all legal disclaimers that apply to the journal pertain.
References
- 1.Wherry EJ, Kurachi M. Molecular and cellular insights into T cell exhaustion. Nat Rev Immunol 2015; 15: 486–499. [DOI] [PMC free article] [PubMed] [Google Scholar]
- 2.Ahn E, Araki K, Hashimoto M, et al. Role of PD-1 during effector CD8 T cell differentiation. Proc Natl Acad Sci U S A 2018; 115: 4749–4754. [DOI] [PMC free article] [PubMed] [Google Scholar]
- 3.Starke A, Lindenmeyer MT, Segerer S, et al. Renal tubular PD-L1 (CD274) suppresses alloreactive human T-cell responses. Kidney Int 2010; 78: 38–47. [DOI] [PubMed] [Google Scholar]
- 4.Pike R, Thomas N, Workman S, et al. PD1-Expressing T Cell Subsets Modify the Rejection Risk in Renal Transplant Patients. Front Immunol 2016; 7: 126. [DOI] [PMC free article] [PubMed] [Google Scholar]
- 5.Winkler JK, Gutzmer R, Bender C, et al. Safe Administration of An Anti-PD-1 Antibody to Kidney-transplant Patients: 2 Clinical Cases and Review of the Literature. J Immunother 2017; 40: 341–344. [DOI] [PubMed] [Google Scholar]
- 6.Barnett R, Barta VS, Jhaveri KD. Preserved Renal-Allograft Function and the PD-1 Pathway Inhibitor Nivolumab. N Engl J Med 2017; 376: 191–192. [DOI] [PubMed] [Google Scholar]
- 7.Deltombe C, Garandeau C, Renaudin K, et al. Severe Allograft Rejection and Autoimmune Hemolytic Anemia After Anti-PD1 Therapy in a Kidney Transplanted Patient. Transplantation 2017; 101: e291. [DOI] [PubMed] [Google Scholar]
- 8.Alhamad T, Venkatachalam K, Linette GP, et al. Checkpoint Inhibitors in Kidney Transplant Recipients and the Potential Risk of Rejection. Am J Transplant 2016; 16: 1332–1333. [DOI] [PubMed] [Google Scholar]
- 9.Kaul AM, Goparaju S, Dvorina N, et al. Acute and chronic rejection: compartmentalization and kinetics of counterbalancing signals in cardiac transplants. Am J Transplant 2015; 15: 333–345. [DOI] [PMC free article] [PubMed] [Google Scholar]
- 10.Keir ME, Liang SC, Guleria I, et al. Tissue expression of PD-L1 mediates peripheral T cell tolerance. J Exp Med 2006; 203: 883–895. [DOI] [PMC free article] [PubMed] [Google Scholar]
- 11.Sandner SE, Clarkson MR, Salama AD, et al. Role of the programmed death-1 pathway in regulation of alloimmune responses in vivo. J Immunol 2005; 174: 3408–3415. [DOI] [PubMed] [Google Scholar]
- 12.Tanaka K, Albin MJ, Yuan X, et al. PDL1 is required for peripheral transplantation tolerance and protection from chronic allograft rejection. J Immunol 2007; 179: 5204–5210. [DOI] [PMC free article] [PubMed] [Google Scholar]
- 13.Yang J, Popoola J, Khandwala S, et al. Critical role of donor tissue expression of programmed death ligand-1 in regulating cardiac allograft rejection and vasculopathy. Circulation 2008; 117: 660–669. [DOI] [PubMed] [Google Scholar]
- 14.Ito T, Ueno T, Clarkson MR, et al. Analysis of the role of negative T cell costimulatory pathways in CD4 and CD8 T cell-mediated alloimmune responses in vivo. J Immunol 2005; 174: 6648–6656. [DOI] [PubMed] [Google Scholar]
- 15.Riella LV, Watanabe T, Sage PT, et al. Essential role of PDL1 expression on nonhematopoietic donor cells in acquired tolerance to vascularized cardiac allografts. Am J Transplant 2011; 11: 832–840. [DOI] [PubMed] [Google Scholar]
- 16.Kohei N, Tanaka T, Tanabe K, et al. Natural killer cells play a critical role in mediating inflammation and graft failure during antibody-mediated rejection of kidney allografts. Kidney Int 2016; 89: 1293–1306. [DOI] [PMC free article] [PubMed] [Google Scholar]
- 17.Bickerstaff A, Nozaki T, Wang JJ, et al. Acute humoral rejection of renal allografts in CCR5(−/−) recipients. Am J Transplant 2008; 8: 557–566. [DOI] [PubMed] [Google Scholar]
- 18.Sis B, Mengel M, Haas M, et al. Banff '09 meeting report: antibody mediated graft deterioration and implementation of Banff working groups. Am J Transplant 2010; 10: 464–471. [DOI] [PubMed] [Google Scholar]
- 19.Wang L, Han R, Hancock WW. Programmed cell death 1 (PD-1) and its ligand PD-L1 are required for allograft tolerance. Eur J Immunol 2007; 37: 2983–2990. [DOI] [PubMed] [Google Scholar]
- 20.Ma D, Duan W, Li Y, et al. PD-L1 Deficiency within Islets Reduces Allograft Survival in Mice. PLoS One 2016; 11: e0152087. [DOI] [PMC free article] [PubMed] [Google Scholar]
- 21.Shen L, Jin Y, Freeman GJ, et al. The function of donor versus recipient programmed death-ligand 1 in corneal allograft survival. J Immunol 2007; 179: 3672–3679. [DOI] [PubMed] [Google Scholar]
- 22.Ozkaynak E, Wang L, Goodearl A, et al. Programmed death-1 targeting can promote allograft survival. J Immunol 2002; 169: 6546–6553. [DOI] [PubMed] [Google Scholar]
- 23.Miyajima M, Chase CM, Alessandrini A, et al. Early acceptance of renal allografts in mice is dependent on foxp3(+) cells. Am J Pathol 2011; 178: 1635–1645. [DOI] [PMC free article] [PubMed] [Google Scholar]
- 24.Loupy A, Vernerey D, Tinel C, et al. Subclinical Rejection Phenotypes at 1 Year Post-Transplant and Outcome of Kidney Allografts. J Am Soc Nephrol 2015; 26: 1721–1731. [DOI] [PMC free article] [PubMed] [Google Scholar]
- 25.Oestreich KJ, Yoon H, Ahmed R, et al. NFATc1 regulates PD-1 expression upon T cell activation. J Immunol 2008; 181: 4832–4839. [DOI] [PMC free article] [PubMed] [Google Scholar]
- 26.Arbour KC, Mezquita L, Long N, et al. Impact of Baseline Steroids on Efficacy of Programmed Cell Death-1 and Programmed Death-Ligand 1 Blockade in Patients With Non-Small-Cell Lung Cancer. J Clin Oncol 2018; 36: 2872–2878. [DOI] [PubMed] [Google Scholar]
- 27.Gorbacheva V, Fan R, Fairchild RL, et al. Memory CD4 T Cells Induce Antibody-Mediated Rejection of Renal Allografts. J Am Soc Nephrol 2016; 27: 3299–3307. [DOI] [PMC free article] [PubMed] [Google Scholar]
- 28.Murata K, Fox-Talbot K, Qian Z, et al. Synergistic deposition of C4d by complement-activating and non-activating antibodies in cardiac transplants. Am J Transplant 2007; 7: 2605–2614. [DOI] [PubMed] [Google Scholar]
Associated Data
This section collects any data citations, data availability statements, or supplementary materials included in this article.
Supplementary Materials
Supplementary Figure S1. Kinetics of C4d deposition following renal transplantation. No C4d in peritubular capillaries at day 2. Weak to moderate diffuse C4d staining in glomerular and peritubular capillaries at day 6. Strong diffuse C4d staining in glomerular and peritubular capillaries at day 14. Strong diffuse C4d staining in dilated peritubular capillaries at day 28 together with strong C4d staining in glomeruli and evident capillary injury.
Supplementary Figure S2. Expression of PD-L1 in relation to PD-1 positive cells infiltrating the tubules in allografts to mice treated with blocking antibody to PD-L1. Cell infiltrate at 6 days in allograft treated with blocking antibody to PD-L1. Uninflamed tubules (T) express PD-L1 (blue) on abluminal border. PD-1 (brown) expressing cells infiltrate tubule with decreased PD-L1 expression (arrow heads).
Supplementary Figure S3. PD-L1 blockade increases mitotically active CD4 T cells and tubular injury. CD4 cells (brown; DAB) in the interstitium with some undergoing mitosis (white arrows) and others breaching the PAS positive tubular basement membrane (black arrows).
Supplementary Figure S4. C4d deposition 6 days after renal allografts to mice treated with blocking antibody to PD-L1 with or without depletion of T cells. Depletion of both CD4 and CD8 greatly decreased C4d deposition.
Supplementary Figure S5. PD-L1 blockade increases PD-1 expressing T cells and effector function. The number of infiltrating PD-1+ CD8 and CD4 T cells at posttransplant day 12 in the kidney grafts (A) and the spleen (B) from the recipients treated with IgG and PD-L1 antibody. Absolute cell number was calculated based on flow cytometry analysis. Data represent mean ± SEM. *P < 0.05 by unpaired t test.
Supplementary Figure S6. Gating strategy for flow cytometry analysis. Representative images from flow cytometry analysis of cells isolated from kidney grafts 6 days after transplantation. Viable CD45+ cells were analyzed by CD4 vs CD8 or PD-1 vs SSC-A.
Supplementary Table S1: Effects of treatment with antibodies to PD-L1, CD4 and CD8 on C4d deposition kidneys 6 days after transplantation.


