

Abstract
Background:
Current recommendations using Hounsfield units (HU)≤10 to identify adrenal adenomas on unenhanced computed tomography (CT) miss 10-40% of benign adenomas. We sought to determine if changing HU threshold and adding absolute percent contrast washout (APW) criteria would better identify adrenal adenomas than current recommendations.
Methods:
Imaging characteristics were compared between patients with adenomas (n=128) and those with non-adenomas (n=54) after unilateral adrenalectomy. Sensitivity, specificity, positive and negative predictive values (PPV, NPV) were calculated.
Results:
Using HU≤10 to identify adenomas had a sensitivity of 47.6%, specificity of 93.3% (AUC=0.71, p<0.001), PPV of 95.3%, and NPV of 58.1% for identifying adrenal adenomas. Applying HU≤16 improved sensitivity (65.4%) without reducing specificity (93.3%) (AUC=0.79, p<0.001), PPV increased to 96.3%, and NPV decreased to 47.6%. Applying HU≤16 as the initial criterion followed by APW>60% for lesions exceeding 16HU, sensitivity increased to 93.4%, specificity was 93.3% and PPV 96.6%, and NPV improved to 85.7% (AUC=0.96, p<0.001).
Conclusions:
Criteria of initial threshold of HU≤16 followed by APW>60% for lesions exceeding 16HU yielded improved sensitivity and specificity in identification of adrenal adenomas.
Keywords: adrenal imaging, adrenal tumor, adrenal adenoma, adrenal incidentaloma, adrenal nodule
Short Summary:
Imaging characteristics on CT imaging can identify benign adrenal masses that do not need further imaging follow up. However, using the current cut-off of HU ≤ 10 only identifies half of benign adenomas. Applying HU ≤ 16 and examining absolute percent contrast washout for lesions exceeding this threshold improves sensitivity to 93.4% and specificity to 93.3% for identification of adrenal adenomas.
Introduction
Incidental adrenal lesions are detected on approximately 5% of abdominal CT scans in patients with no known endocrine abnormalities or malignancy and have been reported in up to 8.7% of autopsies.1,2 The most important consideration in the evaluation of adrenal incidentalomas is differentiating benign lesions from malignancy. Correct identification of adrenal masses as adenomas and non-adenomas assists in appropriate surgical resection of malignancies while preventing unnecessary resection of benign lesions.
The majority of adenomas have low attenuation and low Hounsfield units (HU) on unenhanced computed tomography (CT).3,4 The American Association of Clinical Endocrinologists (AACE) and the American Association of Endocrine Surgeons (AAES) guidelines suggest using HU≤10 to identify adrenal adenomas.5 However, between 10-40% of adenomas are lipid-poor, and will thus attenuate to HU > 10.6 Furthermore, lipid-containing adrenocortical carcinomas may be missed. Indeed, using HU ≤ 10 to identify adrenal adenomas has a sensitivity of 71% and a specificity of 98%.7–9 Previous studies have demonstrated that decreasing HU threshold improved specificity but reduced sensitivity whereas increasing HU threshold improved sensitivity but reduced specificity.9
Venous phase post-contrast enhanced CT can identify lipid-poor adenomas because adenomas have absolute percent contrast washout (APW) greater than 60% or the difference between the contrast-enhanced attenuation and the delayed-enhanced attenuation normalized to the unenhanced attenuation.10–12 To our knowledge, applying HU threshold in conjunction with APW to identify adrenal adenomas has not been performed in a surgical cohort where pathology can be confirmed. In this study, we sought to determine if application of imaging characteristics such as HU ≤ 16 and APW on preoperative CT improved identification of adrenal adenomas.
Materials and Methods
Cohort Selection
We performed a retrospective review of a prospectively collected, single-center database on patients who underwent unilateral adrenalectomy between 2001 and 2015. Patients with pheochromocytomas and paragangliomas were excluded because these lesions are readily identified via biochemical screening, and they have highly variable appearance on CT, which could have confounded our analysis. Myelolipomas were also excluded because they are easily identified on CT due to their extremely low attenuation with HU less than −20.13 Patients without either an abdominal or pelvic CT image in our radiology PACS system or a radiologist’s report were also excluded. Cases were classified into adenoma and non-adenoma groups based on final surgical pathology. All masses that were determined to be non-adenomatous (adrenal cortical carcinomas, ganglioneuromas, metastases, lymphangiomas, etc.) were included in the non-adenoma group. The University of Wisconsin Institutional Review Board approved this study.
Image Analysis
CT findings were abstracted from the radiology reports and confirmed by an independent review of all of the CT images by one of the authors who was trained in reviewing adrenal CTs. If there were any discrepancies between the report and the visual review, then images were reviewed by a second person, who was also trained in reviewing adrenal CTs, to achieve consensus. The largest diameter of each adrenal mass was measured directly on the CT images. Attenuation was measured and reported in HU by using an elliptical region of interest (ROI) that spanned at least half of the tumor diameter, while avoiding sections of necrosis, calcification, hemorrhage, or the lesion edge. If size permitted, the attenuation was measured 3 times and averaged. APW was also assessed in patients who had unenhanced, enhanced, and delayed enhanced (10-15 minutes) CT scans available.25 APW was calculated as follows: (enhanced HU − delayed enhanced HU)/(enhanced HU-unenhanced HU) x 100.14 Each adrenal lesion was assessed on CT for regularity of borders, homogeneity, and presence of calcifications.
Statistical Analysis
We compared the age, gender, laterality, tumor size, and tumor CT characteristics between the adenoma and non-adenoma groups using IBM SPSS software (Version 23 for Windows. Chicago, SPSS Inc.) The two-tailed, unpaired Student’s t test was used to compare age, size, and unenhanced attenuation values, and Chi-square tests were employed to compare the remaining categorical variables. The sensitivity, specificity, positive predictive value (PPV), and negative predictive value (NPV) for detection of adenomas were calculated using size greater than 4 cm, over a range of unenhanced attenuation values from 0-28 HU, and using APW values in order to determine the optimal cutoff values. For combination criteria, the intial criterion of HU ≤ 16 followed by APW > 60% for lesions exceeding 16 HU were assessed. In this study, sensitivity is defined as the probability that an adenoma is correctly identified using a given criterion, whereas the specificity is the probability of a mass being categorized as a non-adenoma, given that it is truly a non-adenoma. The performance of the predictors of adenomas were evaluated using the Area Under the Curve (AUC) of the Receiver Operating Curve (ROC). AUC is defined as the area under the plot of sensitivity against one minus the specificity.15 The interpretation of the AUC is that it quantifies the ROC, thereby demonstrating a test’s ability to differentiate between adenoma and non-adenoma across different parameters for the test.16 PPV is the probability that a positive test result is a true positive, with NPV being the probability that a negative test result is a true negative. We performed a univariate analysis using a direct logistic regression model to assess how predictive the following imaging features were for predicting adenomas: age, sex, HU ≤ 16, tumor diameter > 4 cm, smooth borders, homogeneous composition, and absence of calcifications, as well as a multivariate analysis using these features. These imaging characteristics were selected because they are considered to be predictors of malignancy.17 p<0.05 was considered to be statistically significant.
Results
Patient Demographics
259 patients underwent an adrenalectomy for a unilateral mass between 2001 and 2015. Of these 17 had pheochromocytomas or myelolipomas and were excluded. Sixty did not have CT imaging in our radiology PACS system or a radiologist’s report and were also excluded. The final cohort for univariate analysis included 182 patients of which 128 had adenomas and 54 had non-adenomas (Figure 1). Of these, 111 patients had either HU data, APW data, or both.
Figure 1.
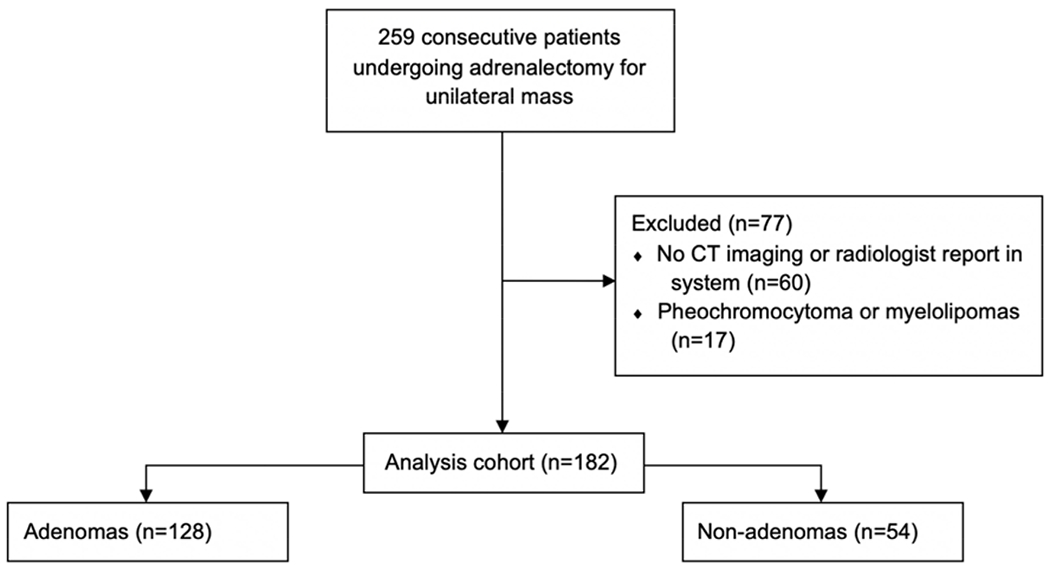
Flowchart of patient selection, with exclusion criteria.
Table 1 contains the mean age (± standard deviation, SD) and gender ratio of the adenoma and non-adenoma groups. Mean age was similar in the two groups. The adenoma group was predominantly female, while the non-adenoma group was predominantly male (p<0.001). Functionality was present in 54.7% of adenomas as compared to 7.4% of non-adenomas (p<0.001).
Table 1.
Demographic and clinical features
| Adenomas | Non-adenomas | p-value | |
|---|---|---|---|
| N= 128 | N=54 | ||
| Age (years) | 54.7 ± 13.3 | 53.5 ± 15.8 | 0.600 |
| Female Gender (%) | 69.5 | 42.6 | <0.001 |
| Left-sided lesions (%) | 62.5 | 54.7 | 0.047 |
| Laparoscopic Procedure (%) | 93.0 | 96.3 | 0.511 |
| Functional (%) | 54.7 | 7.4 | <0.001 |
| Incidental (%) | 49.2 | 36.5 | 0.139 |
| Tumor size (cm) | 3.4 ± 2.2 | 5.2 ± 3.6 | <0.001 |
| Unenhanced attenuation (HU) | 12.0 ± 13.7 | 28.7 ± 9.6 | 0.007 |
Values are described as mean ± standard deviation.
Tumor Characteristics
Basic tumor characteristics are listed in Table 1. Adenomas tended to be smaller than non-adenomas. The mean adenoma size was 3.4 cm, whereas the mean non-adenoma size was 5.24 cm (p<0.001). Attenuation in HU was available for 110 cases, with 80 (72.7%) and 30 (27.3%) being adenomas and non-adenomas, respectively. The mean (±SD) unenhanced attenuation was significantly lower in adenomas as compared to non-adenomas (12.0±13.7 HU vs. 28.7±9.6 HU, p=0.007).
Table 2 includes the numbers and proportions of pathology-confirmed adenomas and non-adenomas with various suspicious imaging characteristics. Unenhanced HU values ≤10 were significantly more common in adrenal adenomas compared to non-adenomas (48.8% vs. 6.7%, p<0.001), but this criterion was met in less than half of the adenomas resected. There were 2 non-adenomas (1 lymphangioma and 1 metastasis) that measured <3 HU. Non-adenomas were significantly larger and more likely to have irregular borders. However, these suspicious imaging features were also present in benign adenomas (Table 2). Final pathology of each lesion and summary imaging characteristics are described in Table 3. HU were available for 110 lesions (60.4%). APW was available for 30 lesions (16.5%). Both HU and APW were available for 30 lesions (16.5%), however the majority of these (n=23) were adenomas.
Table 2.
Computed Tomography Imaging Characteristics based on Pathology Confirmed Lesion Type
| Adenomas (%) | Non-adenomas (%) | p value | |
|---|---|---|---|
| Attenuation ≤ 10 HU | 39 (48.8) | 28 (6.7) | <0.001 |
| Attenuation ≤ 16 HU | 53 (65.4) | 28 (6.7) | <0.001 |
| Size > 4 cm | 28 (23.7) | 29 (55.8) | <0.001 |
| Irregular borders | 29 (18.2) | 18 (69.0) | <0.001 |
| Non-homogeneous | 38 (38.8) | 23 (53.5) | 0.140 |
| Calcifications present | 13 (13.3) | 8 (18.6) | 0.446 |
| >60% APW | 12 (52.7) | 0 (0.0) | 0.012 |
Table 3.
Final Pathology Diagnoses and Computed Tomography Characteristics – (mean (SD)) or percentage
| Diagnosis | N | Attenuation (HU) Mean (SD) | Maximum dimension (cm) Mean (SD) | Irregular Borders | Non-Homogeneous | Calcifications Present |
|---|---|---|---|---|---|---|
| Adenoma | 80 | 12.0 (13.7) | 3.4 (2.3) | 18.2% | 38.8% | 13.3% |
| Metastatic Disease | 29 | 27.9 (10.9) | 3.5 (2.1) | 66.7% | 42.9% | 4.8% |
| Adrenocortical carcinoma | 4 | 31.9 (2.1) | 9.3 (4.6) | 75.0% | 100% | 25% |
| Ganglioneuroma | 8 | 29.5 (2.8) | 7.8 (4.5) | 85.7% | 57.1% | 42.9% |
| Sarcoma | 2 | 35.6 (1.3) | 5.8 (1.1) | 100% | 0% | 0% |
| Neuroendocrine/Carcinoid Tumor | 1 | – | 5 | 100% | 100% | 100% |
| Solitary Fibrous Tumor | 1 | 22 | 2.4 | 0% | 100% | 0% |
| Lymphangioma | 3 | 12.8 (16.3) | 4.0 (0.5) | 33.3% | 33.3% | 33.3% |
| Leiomyosarcoma | 1 | – | 4.5 | – | – | – |
| Angiosarcoma | 1 | 41.3 | 13.3 | 100% | 100% | 100% |
| Ganglioneuroblas toma | 1 | – | 13 | 100% | 100% | 0% |
| Hematolymphoid Neoplasm | 1 | – | 5 | – | – | – |
| Schwannoma | 1 | – | 8.5 | 100% | 100% | 0% |
| Adrenocortical Oncocytic Neoplasm | 1 | 36.1 | 5.4 | 0% | 0% | 0% |
Sensitivity, Specificity, Positive Predictive Value, and Negative Predictive Value
The use of size < 4 cm as a means of identifying adenomas yielded a sensitivity and specificity of 64.8% and 59.4%, and a positive predictive value (PPV) and negative predictive value (NPV) of 75% and 47.8%, respectively (AUC=0.62, p=0.001). Threshold analysis of various HU cutoff values (Table 4) demonstrated that the HU ≤ 10 cutoff had a sensitivity of 47.6%, specificity of 93.3% (AUC=0.71, p<0.001), PPV of 95.3%, and NPV of 58.1%. The sensitivity was improved without detriment to specificity by raising the HU cutoff value from 10 to 16. At a threshold of HU ≤ 16, the sensitivity was raised to 65.4%, the specificity was similar at 93.9%, PPV increased to 96.3% and NPV decreased to 47.6% (AUC=0.79, p<0.001).
Table 4.
Sensitivity and specificity using incremental Hounsfield unit cutoff values on unenhanced CT.
| HU | Sensitivity (%) | Specificity (%) | p value |
|---|---|---|---|
| ≤0 | 20.0 | 100 | 0.008 |
| ≤2 | 23.8 | 96.7 | 0.013 |
| ≤4 | 31.3 | 93.3 | 0.008 |
| ≤6 | 36.3 | 93.3 | 0.002 |
| ≤8 | 42.5 | 93.3 | <0.001 |
| ≤10 | 47.6 | 93.3 | <0.001 |
| ≤12 | 51.2 | 93.3 | <0.001 |
| ≤14 | 58.8 | 93.3 | <0.001 |
| ≤16 | 65.4 | 93.3 | <0.001 |
| ≤18 | 68.8 | 90.0 | <0.001 |
In the 30 patients for which APW values were available, a cutoff of APW > 60% had a sensitivity of 56.5%, specificity of 100%, PPV of 100%, and NPV of 44.4% (AUC=0.61, p=0.011). The use of APW > 60% alone was able to identify 56.5% of lipid-poor adenomas (defined as having unenhanced attenuation HU > 16). The application of a combination criteria of an initial criterion of HU ≤ 16, followed by APW > 60% for lesions exceeding 16 HU had a sensitivity of 93.4%, specificity of 93.3%, PPV of 96.6%, and NPV of 85.7% (AUC=0.96, p<0.001). Application of these criteria would prevent 81% of patients (18 of 22) from undergoing surgical resection for benign adenomas without any change in nonoperative intervention for non-adenomas. Of note, 2 non-adenomas were present in our cohort with attenuation HU < 3, which failed to meet either HU ≤ 10 or HU ≤ 16 threshold.
Univariate Analysis
Univariate analysis using a logistic regression model revealed that female sex (OR 3.08, 95% CI (1.59, 5.94), p < 0.001), smooth borders (OR 10.04, 95% CI (4.38, 23.02), p < 0.001), and HU ≤ 16 (OR 26.5, 95% CI (5.88, 119.5), p < 0.001) were independent predictors of adenomas. Size > 4 cm (OR 0.43, 95% CI (0.23, 0.82), p = 0.011) was an independent predictor of non-adenomas. Age, homogenous appearance, and absence of calcifications were not found to be statistically significant predictors.
Multivariate Analysis
On multivariate analysis, size ≤ 4 cm (OR 3.92, 95% CI (1.01, 15.3), p = 0.049), HU ≤ 16 (OR 13.2, 95% CI (2.45, 71.4), p = 0.002) and smooth borders (OR 7.04, 95% CI (2.12, 23.4), p < 0.001) were independent predictors of adenomas. Age, sex, homogenous appearance, and absence of calcifications were not found to be statistically significant predictors.
Discussion
In this retrospective case series, we show that an initial criterion of HU ≤ 16, followed by APW > 60% for lesions exceeding 16 HU imparts the optimal sensitivity and specificity for identification of adrenal adenomas. Similar to previous work, we found that HU ≤ 10 alone shows high specificity at 93.3%, but low sensitivity at 47.6%.8,18 In contrast to the work of Korobkin et al,19 our specificity was less than 100% because of 2 non-adenomatous lesions measuring HU ≤ 10 (one metastasis and one lymphangioma). In order to achieve 100% specificity, a cutoff of 2 HU would have been required. At this cutoff, only 23.8% of adenomas would be correctly identified.
When we used APW > 60% alone to identify adenomas, sensitivity was 56.5% and specificity was 100% identifying adenomas. This sensitivity is lower than reported by Korobkin et al, but this difference may be due to lack of confirmation by surgical pathology as well as fewer lipid-poor adenomas in their study cohort.12
While greater size is associated with a higher risk of malignancy,20 we found that size alone was a poor predictor of non-adenomas. A threshold of less than 4 cm yielded a sensitivity of 64.8% and a specificity of 59.4% for identification of adenomas. In addition to tumor size, several other imaging features have been described as being suspicious for malignancy. While our study confirms that male sex, irregular borders, and HU > 16, and size > 4 cm were independent predictors for non-adenomas on univariate analysis, these characteristics were also present in up to 34% of adenomas. In addition, in the multivariate model, male sex was no longer a statistically significant predictor of non-adenoma, while size > 4 cm was. The presence of such features may increase the risk of malignancy but were not discriminatory between adenomas and non-adenomas. Our results are similar to Song et al, in that we found border irregularity, but not non-homogeneity or calcifications, to be associated with but not highly specific for non-adenomas.21 In the context of these findings, we argue for the use of a combination criteria of an initial criterion of HU ≤ 16, followed by APW > 60% for lesions exceeding 16 HU to classify non-functional adrenal incedentalomas as benign.
Our findings should be considered in the context of several limitations of our study design. We performed a retrospective review using a surgical database, so the adenoma cohort likely contained a disproportionate number of functional lesions or lesions with indeterminate imaging features which were referred for surgical evaluation. Therefore, the percentage of adenomas with indeterminate imaging characteristics is likely higher than that of the general population. In addition, because CT scans were performed at multiple centers, calibration or a standardized protocol was not used. Additionally, our sample size for evaluation of APW was small (n=30) and the two non-adenomas with unenhanced attenuation HU < 3 did not have APW values available to analyze. Therefore, our analysis would be significantly strengthened with a larger cohort of patients with HU and APW data. Finally, as we derived our classification criteria based on the same sample data that we evaluated it upon, there is the potential for bias and variability. This holds for both the 16 HU threshold, as well as our logistic regression. Therefore, future work should confirm our findings using a separate validation group. Until our findings can be validated in a larger cohort, we recommend consideration of surveillance adrenal protocol CT in 2-3 months for lesions that fall between 10 to 16 HU and lesions >16 HU that do not have APW available.
In conclusion, use of combination criteria of an initial threshold of HU ≤ 16, followed by APW > 60% for lesions exceeding 16HU will likely improve identification of adrenal adenomas. Functional adenomas necessitate surgical excision. However, once functional lesions are ruled out, utilization of these values has the potential to prevent unnecessary surgery and minimize both financial and emotional stress for patients. Such patient-centered outcomes are important to consider in the diagnosis and treatment algorithm of non-functional adrenal incidentalomas.
Research Highlights:
A HU ≤ 10 cutoff on a CT has a sensitivity of 47.6% and specificity of 93.3%
Raising the cutoff to HU ≤ 16 improved sensitivity without detriment to specificity
A combination of initial criterion of HU ≤ 16 followed by absolute percent contrast washout > 60% for lesions exceeding 16 HU was the optimal strategy
Acknowledgements:
Support for this research included the University of Wisconsin School of Medicine and Public Health Shapiro Summer Research Program
Funding: This work was supported by the National Institutes of Health [T-35 Grant 2T35DK062709-11, 2016] and MICHR [TL1 Grant: TL1TR002242].
Footnotes
Publisher's Disclaimer: This is a PDF file of an unedited manuscript that has been accepted for publication. As a service to our customers we are providing this early version of the manuscript. The manuscript will undergo copyediting, typesetting, and review of the resulting proof before it is published in its final form. Please note that during the production process errors may be discovered which could affect the content, and all legal disclaimers that apply to the journal pertain.
Presented At: The 12th Annual Meeting of the American Surgical Congress in Las Vegas, Nevada on February 9th, 2017
Disclosures: We have nothing to disclose.
References:
- 1.Kloos R, Gross M, Francis I, Korobkin M, Shapiro B. Incidentally discovered adrenal masses. Endocr Rev. 1995;16(4):460–484. doi: 10.1210/edrv-16-4-460 [DOI] [PubMed] [Google Scholar]
- 2.Hedeland H, Ostberg G, Hokfelt B. ON THE PREVALENCE OF ADRENOCORTICAL ADENOMAS IN AN AUTOPSY MATERIAL IN RELATION TO HYPERTENSION AND DIABETES. Acta Med Scand. 1968;184(1–6):211–214. doi: 10.1111/j.0954-6820.1968.tb02445.x [DOI] [PubMed] [Google Scholar]
- 3.Yip L, Tublin ME, Falcone JA, et al. The adrenal mass: Correlation of histopathology with imaging. Ann Surg Oncol. 2010;17(3):846–852. doi: 10.1245/s10434-009-0829-2 [DOI] [PubMed] [Google Scholar]
- 4.Park BK, Kim B, Ko K, Jeong SY, Kwon GY. Adrenal masses falsely diagnosed as adenomas on unenhanced and delayed contrast-enhanced computed tomography: Pathological correlation. Eur Radiol. 2006;16(3):642–647. doi: 10.1007/s00330-005-0017-0 [DOI] [PubMed] [Google Scholar]
- 5.Zeiger M, Thompson G, Duh Q-Y, et al. American Association of Clinical Endocrinologists and American Association of Endocrine Surgeons Medical Guidelines for the Management of Adrenal Incidentalomas. Endocr Pract. 2013;15(Supplement 1):1–20. doi: 10.4158/ep.15.s1.1 [DOI] [PubMed] [Google Scholar]
- 6.Caoili EM, Korobkin M, Francis IR, Cohan RH, Dunnick NR. Delayed enhanced CT of lipid-poor adrenal adenomas. Am J Roentgenol. 2000;175(5):1411–1415. doi: 10.2214/ajr.175.5.1751411 [DOI] [PubMed] [Google Scholar]
- 7.Boland G, Lee M, Gazelle G, Halpern E, McNicholas M, Mueller P. Characterization of adrenal masses using unenhanced CT: an analysis of the CT literature. Am J Roentgenol. 1998;171(1):201–204. [DOI] [PubMed] [Google Scholar]
- 8.Hamrahian AH, Ioachimescu AG, Remer EM, et al. Clinical utility of noncontrast computed tomography attenuation value (hounsfield units) to differentiate adrenal adenomas/hyperplasias from nonadenomas: Cleveland clinic experience. J Clin Endocrinol Metab. 2005;90(2):871–877. doi: 10.1210/jc.2004-1627 [DOI] [PubMed] [Google Scholar]
- 9.Lattin GE, Sturgill ED, Tujo CA, et al. From the Radiologic Pathology Archives: Adrenal Tumors and Tumor-like Conditions in the Adult: Radiologic-Pathologic Correlation. RadioGraphics. 2014;34(3):805–829. doi: 10.1148/rg.343130127 [DOI] [PubMed] [Google Scholar]
- 10.Peña CS, Boland GWL, Hahn PF, Lee MJ, Mueller PR. Characterization of Indeterminate (Lipid-poor) Adrenal Masses: Use of Washout Characteristics at Contrast-enhanced CT. Radiology. 2013;217(3):798–802. doi: 10.1148/radiology.217.3.r00dc29798 [DOI] [PubMed] [Google Scholar]
- 11.Kebapci M, Kaya T, Gurbuz E, Adapinar B, Kebapci N, Demirustu C. Differentiation of adrenal adenomas (lipid rich and lipid poor) from nonadenomas by use of washout characteristics on delayed enhanced CT. Abdom Imaging. 2003;28(5):709–715. doi: 10.1007/s00261-003-0015-0 [DOI] [PubMed] [Google Scholar]
- 12.Korobkin M, Brodeur FJ, Francis IR, Quint LE, Dunnick NR, Londy F. CT time-attenuation washout curves of adrenal adenomas and nonadenomas. Am J Roentgenol. 1998;170(3):747–752. doi: 10.2214/ajr.170.3.9490968 [DOI] [PubMed] [Google Scholar]
- 13.Dunnick NR, Korobkin M. Imaging of Adrenal Incidentalomas: Current Status. Am J Roentgenol. 2002;179(3):559–568. doi: 10.2214/ajr.179.3.1790559 [DOI] [PubMed] [Google Scholar]
- 14.Johnson PT, Karen Horton BM, Elliot Fishman BK. Adrenal Imaging with Multidetector CT: Evidence-based Protocol Optimization and Interpretative Practice. Radiographics. 2009:1319–1331. doi: 10.1148/rg.295095026 [DOI] [PubMed] [Google Scholar]
- 15.Pencina MJ, D’Agostino RB, D’Agostino RB, Vasan RS. Evaluating the added predictive ability of a new marker: From area under the ROC curve to reclassification and beyond. Stat Med. 2008;27(2):157–172. doi: 10.1002/sim.2929 [DOI] [PubMed] [Google Scholar]
- 16.Zweig MH, Campbell G. Receiver-operating characteristic (ROC) plots: a fundamental evaluation tool in clinical medicine. Clin Chem. 1993;39(4):561–577. http://www.ncbi.nlm.nih.gov/pubmed/8472349. [PubMed] [Google Scholar]
- 17.Blake M, Cronin C, Boland G. Adrenal Imaging. Am J Roentgenol. 2010;194(6): 1450460. [DOI] [PubMed] [Google Scholar]
- 18.Singer AA, Obuchowski NA, Einstein DM, Paushter DM. Metastasis or adenoma? Computed tomographic evaluation of the adrenal mass. Cleve Clin J Med. 1994;61(3):200–205. doi: 10.3949/ccjm.61.3.200 [DOI] [PubMed] [Google Scholar]
- 19.Korobkin M, Brodeur FJ, Yutzy GG, et al. Differentiation of adrenal adenomas from nonadenomas using CT attenuation values. Am J Roentgenol. 1996;166(3):531–536. doi: 10.2214/ajr.166.3.8623622 [DOI] [PubMed] [Google Scholar]
- 20.Anagnostis P, Karagiannis A, Tziomalos K, Kakafika AI, Athyros VG, Mikhailidis DP. Adrenal incidentaloma: A diagnostic challenge. Hormones. 2009;8(3):163–184. doi: 10.14310/horm.2002.1233 [DOI] [PubMed] [Google Scholar]
- 21.Song JH, Grand DJ, Beland MD, Chang KJ, Machan JT, Mayo-Smith WW. Morphologic features of 211 adrenal masses at initial contrast-enhanced CT: Can we differentiate benign from malignant lesions using imaging features alone? Am J Roentgenol. 2013;201(6):1248–1253. doi: 10.2214/AJR.12.10302 [DOI] [PubMed] [Google Scholar]