

Abstract
Background and aims.
There is very limited data on the healthcare burden of muscle loss, the most frequent complication in hospitalized cirrhotics. We determined the healthcare impact of a muscle loss phenotype in hospitalized cirrhotics.
Methods.
The Nationwide Inpatient Sample (NIS) database (years 2010–2014) was analyzed. Search terms included cirrhosis and its complications, and an expanded definition of a muscle loss phenotype that included all conditions associated with muscle loss. In-hospital mortality, length of stay (LOS), post-discharge disposition, co-morbidities and cost during admission were analyzed. Univariate and multivariate analyses were performed to identify associations between a muscle loss phenotype and outcomes. Impact of muscle loss in cirrhotics was compared to that in a random sample (2%) of general medical inpatients.
Results.
A total of 162,694 hospitalizations for cirrhosis were reported, of which 18,261(11.2%) included secondary diagnosis codes for a muscle loss phenotype. A diagnosis of muscle loss was associated with a significantly (p<0.001 for all) higher mortality (19.3% vs 8.2%), LOS (14.2±15.8 vs. 4.6±6.9 days), and median hospital charge per admission ($21,400 vs. $8,573) and a lower likelihood of discharge to home (30.1% vs. 60.2%). All evaluated outcomes were more severe in cirrhotics than general medical patients (n=534,687). Multivariate regression analysis showed that a diagnosis of muscle loss independently increased mortality by 130%, LOS by 80% and direct cost of care by 119%(p<0.001 for all). Alcohol use, female gender, malignancies and other organ dysfunction were independently associated with muscle loss.
Conclusions.
Muscle loss contributed to higher mortality, LOS, and direct healthcare costs in hospitalized cirrhotics.
Keywords: Cirrhosis, cachexia, sarcopenia, mortality outcomes, healthcare cost
Introduction.
Cirrhosis is a major burden on the healthcare system with estimates from the National Health and Nutrition Examination Survey (NHANES) data of 900 patients per 100,000 US population with an overall prevalence of 2.7 million patients based on current census estimates of 300 million population(1, 2). Complications of cirrhosis contribute to morbidity and mortality, and preventive and therapeutic interventions have been developed for most of these complications(1, 3, 4). Skeletal muscle loss or sarcopenia is one of the most frequent complications in cirrhosis and has significant economic impact(5, 6). Despite the high clinical significance, there are very limited therapeutic options for sarcopenia in cirrhosis that continues to adversely impact outcomes in these patients(1, 3–5). In the past, a number of terms have been used to define a phenotype of muscle loss in cirrhosis including “malnutrition,” “protein calorie malnutrition,” “cachexia,” and, more recently, “frailty”(1, 3, 4, 6). The term cachexia has been used to define a syndrome of weight loss with a decrease in skeletal muscle and/or fat mass due to a number of pathophysiological perturbations and is believed to be independent of food intake(1, 7–9). Of the phenotypic components of cachexia, skeletal muscle loss is the major contributor to adverse clinical outcomes in cirrhosis(1). The term sarcopenia refers primarily to loss of muscle mass and strength with aging but is now increasingly used to describe a phenotype of muscle loss in patients with chronic diseases including cirrhosis(3, 6, 10, 11). In this study, we use the term “muscle loss phenotype” to include all of the terms for muscle loss to evaluate the impact on clinical outcomes.
The prevalence of a muscle loss phenotype in cirrhosis has been reported between 20–80% depending on the severity, duration, and etiology of the underlying liver disease and the measurement instrument employed for diagnosis(3, 4, 12). Even though the adverse impact of muscle loss on mortality and morbidity in cirrhosis has been well established in the outpatient settings(10, 11), there is very limited published data on hospitalized patients. Hospitalized patients have greater disease severity, more complications of cirrhosis, and/or multiple co-morbidities and therefore the adverse clinical impact of muscle loss may not be as evident in these patients(13–17). In addition to mortality, in hospitalized patients with cirrhosis, greater length of stay, cost of hospitalization and discharge disposition to a non-home setting are also clinically significant adverse outcomes. An impairment in mobility and functional capacity also adversely impacts clinical outcomes(10), however, there are no defined codes for impaired mobility. Surrogate measures that include discharge disposition to a supervised facility or to home with home support can therefore be used to determine if patients with muscle loss require functional restorative measures after discharge from the hospital. Identifying the clinical impact of muscle loss will help with allocation of patient care resources and develop practical management strategies to improve long-term outcomes in patients with cirrhosis. A previous study published over a decade ago using the Nationwide Inpatient Sample (NIS) data for the years 1998–2005 reported higher mortality, length of stay and hospitalization costs in cirrhotics with portal hypertension(18). Whether there have been temporal changes in outcomes in hospitalized cirrhotics due to an overall improvement in population nutrition(19–22) is not known. We tested the hypothesis that a skeletal muscle loss phenotype worsens predefined clinical outcomes in hospitalized cirrhotics in the current decade using the NIS, the largest all-payer database of national hospital discharges in the United States database.
Methods
The NIS is a database maintained by the Agency for Healthcare Research and Quality through the Healthcare Cost and Utilization Project (HCUP). Participating state organizations are listed at https://www.hcup-us.ahrq.gov/db/hcupdatapartners.jsp. The NIS hosts administrative data from about 8 million annual hospitalizations from nearly 1,000 U.S. hospitals including non-federal public hospitals and academic medical centers. NIS data includes primary and secondary diagnoses, patient demographics, hospital length of stay, discharge status, and severity/comorbidity measures.
In the present study, data from NIS between the dates January 1, 2010 and December 31, 2014 were included. All International Classification of Diseases, 9th Revision (ICD-9)(23) codes for an expanded definition of a muscle loss phenotype were used because it has been reported that a restrictive use of ICD9 codes limits the number of patients with muscle loss(24). We did not include the code for sarcopenia, new to the ICD10 codes which were initiated in October 2015, because of the relatively short duration over which it has been used and also because the term sarcopenia has been understood traditionally to refer only to aging-related muscle loss. Secondary sarcopenia has only recently been recommended to refer to muscle loss in chronic diseases(25) but the ICD10 codes do not distinguish between primary and secondary sarcopenia. Hospital discharges with a primary or secondary ICD9 code for cirrhosis (571.2, 571.5, 571.6), or cirrhosis-related complications including hepatorenal syndrome [572.4], portal hypertensive complication (portal hypertension [572.3], variceal bleed [456.0, 456.2]), spontaneous bacterial peritonitis [567.23], hepatic encephalopathy [572.2]), with or without a secondary diagnosis code for cachexia phenotype, were included. A muscle loss phenotype included billing codes for: “abnormal loss of weight and underweight” (783.2), “other severe protein-calorie malnutrition” (262), “malnutrition to moderate degree” (263.0), “other protein-calorie malnutrition” (263.8), “unspecified protein-calorie malnutrition” (263.9), “nutrition deficiency” (269.8), “nutrition deficiency not otherwise specified” (269.9), “cachexia” (799.4), and “adult failure-to-thrive” (783.7). Patients aged ≥18 years were included for analyses. Maternal discharges were excluded by use of Major Diagnostic Category (MDC) 14 “Pregnancy, Childbirth and the Puerperium” codes. “Other” category for race included Native Americans and Asian / Pacific Islanders. The ICD codes needed to calculate the Charlson and Elixhauser comorbidity indices(26, 27) (predictors of in-hospital mortality and discharge disposition) were collected and the comorbidity indices calculated using the data from the NIS. Covariables with counts less than or equal to ten were excluded in accordance with the NIS privacy agreement. To provide context, the impact of a muscle loss phenotype in cirrhosis was compared to that in a sample of 2% of hospitalized general medical patients. This would ensure about a 5:1 ratio of general medical to a cirrhosis population ratio.
Other components that were evaluated included duration of stay, cost for each admission, in-hospital mortality, and discharge disposition. For these analyses, we defined a “routine discharge” as when a hospitalized patient was sent home without any additional assistance. A “non-routine discharge” (home with home health aide/support, nursing home, rehabilitation, home health support, against medical advice) was considered a suboptimal discharge outcome because these are offered to patients with functional limitations in contrast to those who are discharged home for routine management. To determine if there was a difference between patient outcomes and clinical characteristics based on geographic and socioeconomic criteria, the location of the hospital and the type of insurance carrier were also obtained.
Statistical analysis.
The primary outcome was in-hospital mortality in cirrhotic patients with or without a muscle loss phenotype. Other outcomes of interest included the duration of hospital stay and cost of care for each admission. Summary statistics included counts and percentages for qualitative variables and means with standard deviations for quantitative variables. Median values were presented as summary statistics for hospital cost per admission. Qualitative variables were assessed with chi-square tests, and continuous variables that were normally distributed were compared using t-tests. Wilcoxon analysis was performed for data that was not normally distributed including hospital cost and length of stay. Box-cox analysis was performed for non-normally distributed data. Multivariate logistic and linear regression analysis was performed to identify independent associations with outcomes. Data was log-transformed for analyses of hospital costs and length of stay. Best subsets and lasso were used for linear regression modeling. Simple imputation was used for missing variables not related to the primary outcome. Model fit was assessed using R2 and C-Index. All analyses were two-tailed and performed with an alpha set at 5%. Confidence intervals were set to 95% unless otherwise stated. All above covariates assumed to affect risk for muscle loss phenotype (including age, sex, race, and covariates that included AIDS, chronic lung disease, congestive heart failure, metastatic cancer, acute kidney injury, coagulopathy, anemia, alcohol abuse, solid tumors) were entered in a multivariate logistic regression model to determine the propensity of muscle loss phenotype (i.e., the conditional probability of muscle loss phenotype given a set of covariates). Individual propensity scores were calculated without regard to outcomes. Individuals with missing covariates for the propensity score calculations were excluded. Missing variables for outcomes were excluded. For propensity score matching, those with cirrhosis were matched with a 1:1 ratio with replacement with the general medical population based on the logit of the propensity score using optimal pairwise propensity score matching (n=197,870). All statistical analyses were performed using the R version 3.6.2 (The R Foundation for Statistical Computing, Vienna, Austria) and SAS 9.4 software (SAS Institute, Cary, NC). The logistic regression and propensity score matching were conducted using R Core Team (2014). R: A language and environment for statistical computing. R Foundation for Statistical Computing, Vienna, Austria.
Results
During the years 2010–2014, there were 162,543 hospitalizations coded with a diagnosis of cirrhosis with or without a secondary diagnosis of a muscle loss phenotype. We compared the data from these patients with a concurrent random sample of 534,687 hospitalizations among general medical patients. Their clinical and demographic features are shown in Table 1. The prevalence of a muscle loss phenotype was significantly higher (p<0.001) in the cirrhotic cohort (18,261; 11.2%) than in the general medical patients (11,534; 2.1%) (Fig. 1, Panel A). The mortality in patients hospitalized for cirrhosis (15,329; 9.4%) was significantly higher (p<0.001) than in the general medical patients (11,509; 2.2%). The ethnic distribution of the cirrhotic patients was similar to that in the general medical population (Fig. 1, Panel B). Parenteral nutritional support is generally recommended and used in hospitalized patients with severe nutritional deficiency and poor oral intake(28). In the cohort evaluated, use of parenteral nutrition in cirrhotics was higher than that in the general medical population. Patients hospitalized with cirrhosis were less likely to undergo discharge to home (57.2% vs 68.6%) and more likely to require transfer to a skilled nursing facility (21.4% vs 15.6%) or require home health care (15.7% vs 12.4%) than general medical patients. Consistently, the Elixhauser comorbidity index, length of stay in hospital and median hospital charge per admission were also significantly higher (p<0.001) in patients with cirrhosis than the general medical cohort.
Table 1.
Demographical characteristics for patients with cirrhosis and the general medical population
| General medical population n=534,687 | Cirrhosis n=162,543 | p value | |
|---|---|---|---|
| Age in years (mean (SD)) | 65.69 (23.44) | 70.51 (13.55) | <0.001 |
| Female (%) | 318001 (59.5) | 63578 (39.1) | <0.001 |
| Length of stay in days (mean (SD)) | 4.60 (6.85) | 7.59 (10.34) | <0.001 |
| In-hospital mortality (%) | 11509 (2.2) | 15329 (9.4) | <0.001 |
| Cost of hospitalization (median (IQR)) | 5849.3 [3082.9–11363.3] | 9382.30 [5329.75–18657.09] | <0.001 |
| Muscle loss phenotype | 11534 (2.1) | 18261 (11.2) | <0.001 |
| Elective | 137433 (25.7) | 11264 (6.9) | <0.001 |
| Comorbidities (%) | |||
| AIDS | 1153 (0.2) | 759 (0.5) | <0.001 |
| Alcohol abuse | 23135 (4.3) | 71656 (44.0) | <0.001 |
| Chronic lung disease | 94206 (17.6) | 32884 (20.2) | <0.001 |
| Coagulopathy | 24366 (4.6) | 70410 (43.3) | <0.001 |
| Depression | 54856 (10.3) | 22129 (13.6) | <0.001 |
| Diabetes (uncomplicated) | 96627 (18.1) | 47479 (29.2) | <0.001 |
| Diabetes (complicated) | 22964 (4.3) | 12552 (7.7) | <0.001 |
| Drug abuse | 21701 (4.1) | 11953 (7.4) | <0.001 |
| Hypertension | 252768 (47.3) | 80353 (49.4) | <0.001 |
| Hypothyroidism | 57428 (10.7) | 21467 (13.2) | <0.001 |
| Lymphoma | 4052 (0.8) | 1334 (0.8) | 1.00 |
| Obesity | 58285 (10.9) | 20905(12.9) | <0.001 |
| Peptic ulcer disease | 154 (0.0) | 158 (0.1) | <0.001 |
| Pulmonary circulatory disorder | 10740 (2.0) | 8203 (5.0) | <0.001 |
| Solid tumors | 10336 (1.9) | 7595 (4.7) | <0.001 |
| Total parenteral nutrition | 155 (0.03) | 332 (0.2) | <0.001 |
| Weight loss | 21387 (4.0) | 27658 (17.0) | <0.001 |
| Number of diagnoses on discharge | 9.67 (5.85) | 16.68 (7.21) | <0.001 |
| Elixhauser score | 4.03 (8.83) | 14.34 (12.25) | <0.001 |
| Charlson comorbidity score | 1.65 (1.75) | 3.15 (2.41) | <0.001 |
| Disposition of patient upon discharge (%)Ψ | <0.001* | ||
| Routine | 358663 (68.6) | 84046 (57.2) | |
| Transfer to short-term hospital | 11080 (2.1) | 5706 (3.9) | |
| Transfer other: SNF, ICF | 82068 (15.6) | 31402 (21.4) | |
| Home Health Care | 64802 (12.4) | 23110 (15.7) | |
| Against medical advice | 6193 (1.2) | 2731 (1.9) | |
| Missing | 372 (0.1) | 219 (0.1) | |
| Urban-rural classification for US county (%) | <0.001* | ||
| Metro areas >=1 million | 158616 (29.7) | 52223 (32.1) | |
| Metro areas of 250,000–999,999 | 97454 (18.2) | 31010 (19.1) | |
| Metro areas of 50,000–249,999 | 49567 (9.3) | 14880 (9.2) | |
| Fringe counties of metro >=1 million | 133716 (25.0) | 37747 (23.2) | |
| Micropolitan counties | 55535 (10.4) | 16143 (9.9) | |
| Non-metro or micropolitan counties | 39799 (7.4) | 10540 (6.5) | |
| Primary payer for insurance (%) | <0.001* | ||
| Medicare | 237286 (44.4) | 72098 (44.4) | |
| Medicaid | 90630 (17.0) | 34972 (21.5) | |
| Private insurance | 156390 (29.2) | 34691 (21.3) | |
| Self-pay | 29439 (5.5) | 13253 (8.2) | |
| No charge | 3175 (0.6) | 1341 (0.8) | |
| Other | 17767 (3.3) | 6238 (3.8) | |
| Hospital location and teaching status (%) | <0.001* | ||
| Rural | 60885 (11.4) | 13872 (8.5) | |
| Urban non-teaching | 210343 (39.3) | 59579 (36.7) | |
| Urban teaching | 263459 (49.3) | 89092 (54.8) | |
| Hospital region (%) | <0.001* | ||
| Northeast | 92562 (17.3) | 23149 (14.2) | |
| Midwest | 108453 (20.3) | 32190 (19.8) | |
| South | 238993 (44.7) | 73011 (44.9) | |
| West | 94679 (17.7) | 34193 (21.0) | |
Analysis of the Nationwide Inpatient Sample, comparing 2% of the general medication population versus hospitalized patients with cirrhosis between 2010–2014 with or without a secondary diagnosis of muscle loss phenotype.
P values that are starred represent ANOVA analysis; otherwise p values represent t-tests.
“Other race” includes Native Americans and Asian/Pacific Islander.
“Routine” disposition of the patient upon discharge means discharge to home.
The sum of the disposition locations does not equal to the total number of patients because mortality is also a disposition. Therefore, mortality needs to be added to the sum of disposition locations in order to get the total number of patients.
AIDS = acquired immunodeficiency syndrome.
Fig. 1. Prevalence of muscle loss phenotype of hospitalized patients between 2010 and 2014.
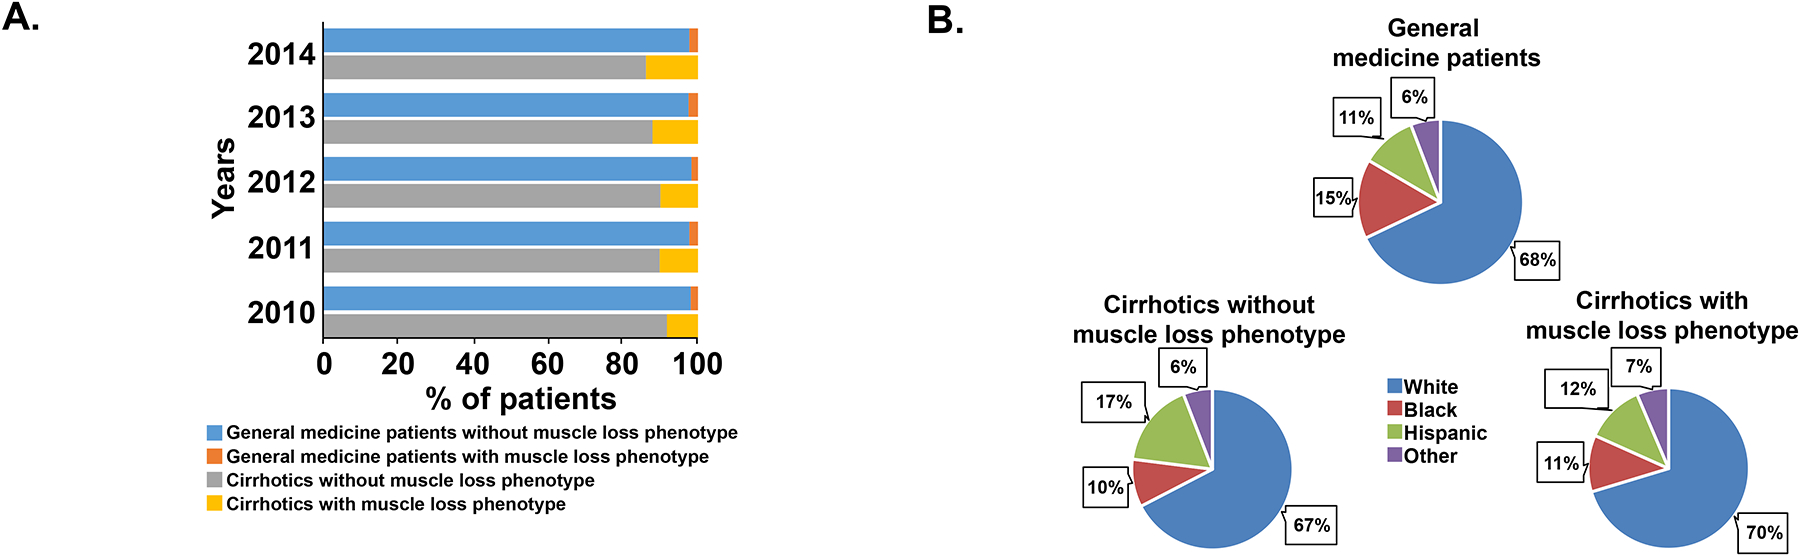
Panel A. Distribution of muscle loss phenotype between the general medical patients and those with cirrhosis. Panel B. Pie chart showing the ethnic composition of the cohort of hospitalized patients during the period 2010–2014.
We, then, performed propensity score matching comparing the general medical population to the cirrhosis population (Table 2). After matching based on age, sex, race, and covariates known to increase the risk for muscle loss phenotype, we found that those with cirrhosis had a persistently higher risk for muscle loss phenotype compared to the general medical population (adjusted OR 2.52, CI 2.42–2.61). We also found that those with cirrhosis had a significantly increased risk for mortality (adjusted OR 2.15, CI: 2.07–2.24), length of stay (adjusted increased length of stay by 1.41 days, CI 1.33–1.49), and cost of hospitalization (adjusted increased cost by 4,050 dollars, CI: 3,794–4,304 dollars) (Table 3).
Table 2.
Propensity score matching analysis for demographical characteristics of general medical population and cirrhotics
| General medical population n=98935 | Cirrhosis n=98935 | p value | |
|---|---|---|---|
| Age in years (mean (SD)) | 61.09 (17.31) | 60.37 (12.50) | <0.001 |
| Female (%) | 55356 (56.0) | 54373 (55.0) | <0.001 |
| Length of stay in days (mean (SD)) | 5.94 (7.72) | 7.35 (10.24) | <0.001 |
| In-hospital mortality (%) | 4064 (4.1) | 8391 (8.5) | <0.001 |
| Cost of hospitalization (mean (SD)) | 14074.49 (21443.81) | 18123.90 (35075.23) | <0.001 |
| Muscle loss phenotype (%) | 4050 (4.1) | 9500 (9.6) | <0.001 |
| Race (%) | 0.009* | ||
| White | 67792 (68.5) | 68269 (69.0) | |
| Black | 11338 (11.5) | 11254 (11.4) | |
| Hispanic | 14392 (14.5) | 13899 (14.0) | |
| Other | 5413 (5.5) | 5513 (5.6) | |
| Comorbidities (%) | |||
| Acute kidney injury (%) | 23556 (23.8) | 22581 (22.8) | <0.001 |
| AIDS (%) | 435 (0.4) | 456 (0.5) | 0.502 |
| Alcohol abuse (%) | 23259 (23.5) | 24514 (24.8) | <0.001 |
| Anemia (%) | 3250 (3.3) | 3549 (3.6) | <0.001 |
| Chronic lung disease (%) | 20254 (20.5) | 20237 (20.5) | 0.929 |
| Coagulopathy (%) | 24088 (24.3) | 24218 (24.5) | 0.5 |
| Congestive heart failure (%) | 15412 (15.6) | 14956 (15.1) | 0.005 |
| Metastatic cancer (%) | 3713 (3.8) | 3238 (3.3) | <0.001 |
| Solid tumors (%) | 4452 (4.5) | 4067 (4.1) | <0.001 |
| Mean household income by zip code (%) | <0.001* | ||
| 0–25th percentile | 30208 (30.5) | 32796 (33.1) | |
| 26th to 50th percentile (median) | 25920 (26.2) | 25963 (26.2) | |
| 51st to 75th percentile | 23202 (23.5) | 23064 (23.3) | |
| 76th to 100th percentile | 19605 (19.8) | 17112 (17.3) | |
| Primary payer for insurance (%) | <0.001* | ||
| Medicare | 50477 (51.0) | 48068 (48.6) | |
| Medicaid | 13702 (13.8) | 18678 (18.9) | |
| Private insurance | 23619 (23.9) | 21246 (21.5) | |
| Self-pay | 6851 (6.9) | 6715 (6.8) | |
| No charge | 796 (0.8) | 702 (0.7) | |
| Other | 3490 (3.5) | 3526 (3.6) | |
P values that are starred represent ANOVA analysis; otherwise p values represent t-tests.
Other race include Native Americans and Asian/Pacific Islander.
AIDS = acquired immunodeficiency syndrome
Table 3.
Propensity score matching analysis of general medical population and cirrhosis
| General medical population n=98937 × Cirrhosis n=98937 | Unadjusted OR (95% CI) | Adjusted OR (95% CI) | |
|---|---|---|---|
| Length of stay in days (SD) | 5.94 (7.72) × 7.35 (10.24) | 1.42 days (1.35–1.50) | 1.41 days (1.33–1.49) |
| In-hospital mortality (%) | 4064 (4.1) × 8391 (8.5) | 2.49 (2.40–2.59) | 2.15 (2.07–2.24) |
| Cost of hospitalization (SD) | 14075 (21444) × 18123.90 (35075) | 4,099 dollars (3,843–4,355) | 4,050 dollars (3,794–4,304) |
| Muscle loss phenotype (%) | 4050 (4.1) × 9500 (9.6) | 2.48 (2.38–2.57) | 2.52 (2.42–2.61) |
Propensity score matching analysis with a 1:1 ratio without replacement of hospitalized general medical population and hospitalized cirrhotics.
OR = Odds Ratio. CI= Confidence Interval. SD= Standard Deviation.
Clinical characteristics.
The clinical characteristics of cirrhotic patients with and without a muscle loss phenotype are shown in Table 4. Hospitalized cirrhotic patients with a muscle loss phenotype were more likely (p<0.001) to require transfer to a skilled nursing facility (42.5% vs 19.0%), less likely to undergo discharge to home (30.1% vs 60.2%), and more likely to require home health care (21.3%) compared to cirrhotics without a muscle loss phenotype (15.0%). An unadjusted length of stay of 10.16 (±12.05 days) in non-routine discharges for cirrhotics was significantly higher (p<0.001) versus routine discharge (5.17±6.42 days).
Table 4.
Hospitalization for cirrhosis with and without muscle loss phenotype
| No muscle loss phenotype, n=144,433 | Muscle loss phenotype, n=18,261 | p value | |
|---|---|---|---|
| Age in years (mean (SD)) | 70.22 (13.63) | 72.23 (14.10) | <0.001 |
| Female (%) | 56129 (38.9) | 7528 (41.2) | <0.001 |
| Length of stay in days (mean (SD)) | 4.62 (6.90) | 14.20 (15.77) | <0.001 |
| In-hospital mortality (%) | 11830 (8.2) | 3522 (19.3) | <0.001 |
| Cost of hospitalization (median (IQR)) | $8572.96 [5017.55, 16113.34] | $21399.54 [11256.51, 43857.00] | <0.001 |
| Complications of cirrhosis (%) | |||
| Portal hypertension | 11761 (8.1) | 4923 (27.0) | <0.001 |
| Hepatorenal syndrome | 3484 (2.4) | 1811 (9.9) | <0.001 |
| Hepatic encephalopathy | 9099 (6.3) | 4346 (23.8) | <0.001 |
| Spontaneous bacterial peritonitis | 1820 (1.3) | 1012 (5.5) | <0.001 |
| Variceal hemorrhage | 275 (0.2) | 95 (0.5) | <0.001 |
| Hepatocellular carcinoma | 998 (0.7) | 467 (2.6) | <0.001 |
| Coagulopathy | 60546 (41.9) | 9929 (54.4) | <0.001 |
| Comorbidities (%) | |||
| Acute kidney injury | 32615 (22.6) | 5755 (31.5) | <0.001 |
| AIDS | 637 (0.4) | 122 (0.7) | <0.001 |
| Alcohol abuse | 63742 (44.1) | 7914 (43.3) | 0.042 |
| Anemia | 6121 (4.2) | 826 (4.5) | 0.075 |
| Chronic lung disease | 28076 (19.4) | 4812 (26.4) | <0.001 |
| Depression | 19019 (13.2) | 3110 (17.0) | <0.001 |
| Diabetes (uncomplicated) | 43042 (29.8) | 4438 (24.3) | <0.001 |
| Diabetes (complicated) | 10826 (7.5) | 1726 (9.5) | <0.001 |
| Drug abuse | 11851 (7.2) | 1911 (9.1) | <0.001 |
| Hypertension | 70841 (49.0) | 9540 (52.2) | <0.001 |
| Lymphoma | 1227 (0.7) | 279 (1.3) | <0.001 |
| Obesity | 20967 (12.7) | 2879 (13.7) | <0.001 |
| Pulmonary circulatory disorder | 6840 (4.7) | 1366 (7.5) | <0.001 |
| Solid tumors | 6558 (4.5) | 1039 (5.7) | <0.001 |
| Total parenteral nutrition | 190 (0.1) | 149 (0.8) | <0.001 |
| Etiologies of cirrhosis (%) | |||
| Alcoholic cirrhosis | 10864 (7.5) | 5285 (28.9) | <0.001 |
| Non-alcoholic cirrhosis | 16264 (11.3) | 5052 (27.7) | <0.001 |
| Biliary cirrhosis | 545 (0.4) | 216 (1.1) | 0.712 |
| Other chronic liver diseases | 2478 (1.7) | 629 (3.4) | <0.001 |
| Number of diagnosis on discharge (mean (SD)) | 15.72 (6.98) | 24.19 (3.79) | <0.001 |
| Elixhauser comorbidity index (mean(SD)) | 12.71 (11.41) | 27.18 (10.97) | <0.001 |
| Charlson comorbidity index (mean(SD)) | 2.98 (2.36) | 4.48 (2.33) | <0.001 |
| Disposition of patient upon discharge (%)Ψ | <0.001* | ||
| Routine | 79733 (60.2) | 4416 (30.1) | |
| Transfer to short-term hospital | 5004 (3.8) | 710 (4.7) | |
| Transfer other: SNF, ICF | 25150 (19.0) | 6257 (42.5) | |
| Home Health Care | 19976 (15.0) | 3146 (21.3) | |
| Against medical advice | 2565 (1.9) | 166 (1.1) | |
| Missing | 175 (0.1) | 44 (0.3) | |
| Mean household income by zip code (%) | <0.001* | ||
| 0–25th percentile | 48654 (33.7) | 5794 (31.7) | |
| 26th to 50th percentile | 38418 (26.6) | 4812 (26.4) | |
| 51st to 75th percentile | 33101 (22.9) | 4281 (23.4) | |
| 76th to 100th percentile | 24260 (16.8) | 3374 (18.5) | |
| Urban-rural classification for US county (%) | <0.001* | ||
| Metro areas >=1 million | 45894 (31.8) | 6386 (35.0) | |
| Metro areas of 250,000–999,999 | 27774 (19.2) | 3265 (17.9) | |
| Metro areas of 50,000–249,999 | 13249 (9.2) | 1642 (9.0) | |
| Fringe counties of metro >=1 million | 33618 (23.3) | 4170 (22.8) | |
| Micropolitan counties | 14467 (10.0) | 1681 (9.2) | |
| Not metro or micropolitan counties | 9431 (6.5) | 1117 (6.1) | |
| Primary payer for insurance (%) | <0.001* | ||
| Medicaid | 62991 (43.6) | 9109 (49.9) | |
| Medicare | 31397 (21.7) | 3656 (20.0) | |
| Private insurance | 30870 (21.4) | 3824 (20.9) | |
| Self-pay | 12221 (8.5) | 1033 (5.7) | |
| No charge | 1245 (0.9) | 97 (0.5) | |
| Other | 5709 (4.0) | 542 (3.0) | |
| Hospital location and teaching status (%) | <0.001* | ||
| Rural | 12815 (8.9) | 1057 (5.8) | |
| Urban nonteaching | 78439 (54.3) | 10801 (59.1) | |
| Urban teaching | 53179 (36.8) | 6403 (35.1) | |
| Hospital region (%) | <0.001* | ||
| Northeast | 21724 (15.0) | 1441 (7.9) | |
| Midwest | 28143 (19.5) | 4070 (22.3) | |
| South | 64933 (45.0) | 8139 (44.6) | |
| West | 29633 (20.5) | 4611 (25.3) | |
Analysis of the Nationwide Inpatient Sample (2010–2014) for the diagnosis of cirrhosis with or without a secondary diagnosis of muscle loss phenotype.
P values that are starred represent ANOVA analysis; otherwise p values represent t-tests.
Other race include Native Americans and Asian/Pacific Islander.
“Routine” disposition of patient means discharge to home.
SNF = skilled nursing facility. ICF = intermediate care facility. AIDS = acquired immunodeficiency syndrome.
The sum of the disposition locations does not equal to the total number of patients because mortality is also a disposition. Therefore, mortality needs to be added to the sum of disposition locations in order to get the total number of patients.
Complications of cirrhosis including portal hypertension, hepatic encephalopathy, hepatorenal syndrome, coagulopathy, spontaneous bacterial peritonitis and hepatocellular carcinoma were significantly more frequent in cirrhotic patients with muscle loss phenotype than without (Table 4). Other co-existing illnesses including renal failure, chronic pulmonary disease, systemic hypertension, malignancies including hepatocellular carcinoma, and diabetes mellitus were more common in cirrhotics with a muscle loss phenotype than those without. Consistently, comorbidity indices were higher (p<0.001) in cirrhotics with a muscle loss phenotype compared to those without. Patients with cirrhosis with a muscle loss phenotype had a greater mortality rate (19.3% vs 8.2%, p<0.001), length of stay in hospital (14.2 ± 15.8 vs 4.6 ± 6.9 days, p<0.001) and a higher median hospital charge per patient ($21,400 vs. $8,573, p<0.001) compared to those without muscle loss respectively.
Risk factors for muscle loss phenotype.
Based on results from univariate analyses, risk factors for a muscle loss phenotype in cirrhosis were used to determine independent associations using a multivariate linear regression analysis (Table 5). Major factors associated with an increased risk for a muscle loss phenotype in cirrhosis included metastatic cancer, coagulopathy, acute kidney injury, AIDS, solid tumors, chronic lung diseases, heart failure, alcohol abuse, increasing age, and female gender. Patients with cirrhosis who reported being of black race tended to have an increased risk of muscle loss phenotype compared to those who reported being of white race.
Table 5.
Risk Factors for muscle loss phenotype in a cirrhosis population
| Univariate OR (95% CI) | Multivariate OR (95% CI) | |
|---|---|---|
| Age* | 1.21 (1.19–1.24) | 1.14 (1.12–1.17) |
| Female | 1.10 (1.07–1.14) | 1.10 (1.07–1.14) |
| Race (White) | ||
| Black | 1.15 (1.09–1.20) | 1.08 (1.03–1.13) |
| Hispanic | 0.70 (0.67–0.73) | 0.73 (0.70–0.76) |
| Other | 1.06 (1.00–1.12) | 1.06 (1.00–1.13) |
| Comorbidities | ||
| Alcohol abuse | 0.96 (0.93–0.99) | 1.17 (1.13–1.21) |
| Metastatic cancer | 2.37 (2.21–2.53) | 2.67 (2.49–2.87) |
| Solid tumors | 1.31 (1.23–1.40) | 1.46 (1.36–1.56) |
| Chronic lung disease | 1.49 (1.44–1.54) | 1.37 (1.33–1.42) |
| Coagulopathy | 1.66 (1.62–1.71) | 1.76 (1.71–1.81) |
| Anemia | 1.06 (0.99–1.14) | 1.07 (0.99–1.15) |
| CHF | 1.59 (1.53–1.64) | 1.35 (1.29–1.40) |
| AIDS | 1.36 (1.15–1.62) | 1.47 (1.23–1.76) |
| Acute kidney injury | 1.63 (1.58–1.68) | 1.54 (1.49–1.60) |
Multiple R square: 0.05; p < 2.2e-16. Baseline comparison group inparentheses.
Age represents the increased risk of mortality going from 52 to 67 years old.
Other race includes Native Americans and Asian / Pacific Islanders.
OR = Odds Ratio. CHF = congestive heart failure. AIDS = acquired immunodeficiency syndrome.
Health care costs related to muscle loss in hospitalized cirrhotics.
Multivariate linear regression modeling was performed to analyze the factors associated with increased length of stay (LOS) for cirrhosis (Table 6). These included muscle loss phenotype (increased LOS by 81.2%), coagulopathy (increased LOS by 20.9%), congestive heart failure (increased LOS by 19.5%), acute kidney injury (increased LOS by 16.1%), metastatic cancer (increased LOS by 7.0%), anemia (increased LOS by 6.2%) and female gender (increased LOS by 3.1%). Independent covariates associated with increased cost of care related to cirrhosis alone are shown in Table 7. Diagnosis of a muscle loss phenotype increased cost of hospitalization by 119.1% and coagulopathy increased hospitalization cost by 37.1% compared to those without these complications.
Table 6.
Multivariate linear regression predicting variables associated with increased length of stay
| Beta coefficient | Standard error | Exponentiated coefficient | p value | |
|---|---|---|---|---|
| Muscle loss phenotype | 0.588 | 0.005 | 80.15 | <0.001 |
| Age* | −0.001 | 0.001 | −0.15 | <0.001 |
| Female | 0.031 | 0.003 | 3.13 | <0.001 |
| Race (white) | ||||
| Black | 0.070 | 0.005 | 7.33 | <0.001 |
| Hispanic | −0.048 | 0.004 | −4.99 | <0.001 |
| Other | 0.020 | 0.007 | 2.10 | 0.004 |
| Comorbidities | ||||
| Alcohol abuse | −0.029 | 0.003 | −2.96 | <0.001 |
| Metastatic cancer | 0.067 | 0.010 | 6.98 | <0.001 |
| Solid tumors | 0.037 | 0.008 | 3.81 | <0.001 |
| Chronic lung disease | 0.072 | 0.004 | 7.57 | <0.001 |
| Coagulopathy | 0.189 | 0.003 | 20.91 | <0.001 |
| Anemia | 0.060 | 0.008 | 6.21 | <0.001 |
| CHF | 0.178 | 0.005 | 19.49 | <0.001 |
| AIDS | 0.030 | 0.022 | 3.32 | 0.172 |
| Acute kidney injury | 0.149 | 0.004 | 16.11 | <0.001 |
Multiple R square: 0.11; p < 2.2e-16. Baseline comparison group in parentheses.
Age represents an increase in age from 52 to 67.
Other race includes Native Americans and Asian / Pacific Islanders.
CHF = congestive heart failure. AIDS = acquired immunodeficiency syndrome.
Table 7.
Multivariate linear regression predicting log transformed cost of hospitalization
| Beta coefficient | Standard error | Exponentiated coefficient | p value | |
|---|---|---|---|---|
| Muscle loss phenotype | 0.784 | 0.007 | 119.16 | <0.001 |
| Age* | 0.005 | 0.0002 | −0.54 | <0.001 |
| Female | 0.001 | 0.004 | −0.12 | 0.806 |
| Race (white) | ||||
| Black | 0.063 | 0.008 | 6.56 | <0.001 |
| Hispanic | 0.004 | 0.006 | 0.50 | 0.433 |
| Other | 0.134 | 0.009 | 14.45 | <0.001 |
| Comorbidities | ||||
| Alcohol abuse | 0.064 | 0.005 | −6.66 | <0.001 |
| Metastatic cancer | 0.216 | 0.014 | 16.39 | <0.001 |
| Solid tumors | 0.190 | 0.011 | 21.04 | <0.001 |
| Chronic lung disease | 0.108 | 0.005 | 11.41 | <0.001 |
| Coagulopathy | 0.315 | 0.004 | 37.11 | <0.001 |
| Anemia | 0.190 | 0.011 | 21.03 | <0.001 |
| CHF | 0.216 | 0.006 | 24.14 | <0.001 |
| AIDS | 0.032 | 0.030 | 3.31 | 0.290 |
| Acute kidney injury | 0.196 | 0.005 | 21.66 | <0.001 |
Multiple R square: 0.12; p < 2.2e-16.
Age represents the increase from 52 to 67 years old.
Other race includes Native Americans and Asian / Pacific Islanders.
CHF = congestive heart failure. AIDS = acquired immunodeficiency syndrome.
Impact of muscle loss on mortality.
The trendline for mortality in cirrhotics with and without a muscle loss phenotype is shown in Fig. 2. Factors independently associated with mortality during a hospital admission for cirrhosis are shown in Table 8. An increased risk of mortality in hospitalized cirrhotics due to a muscle loss phenotype (OR 2.30, CI 2.21–2.39) was nearly as high as that of metastatic cancer (OR 2.82, CI 2.62–3.03).
Fig. 2. Trend analysis of mortality for cirrhotics with muscle loss phenotype between 2010 and 2014.
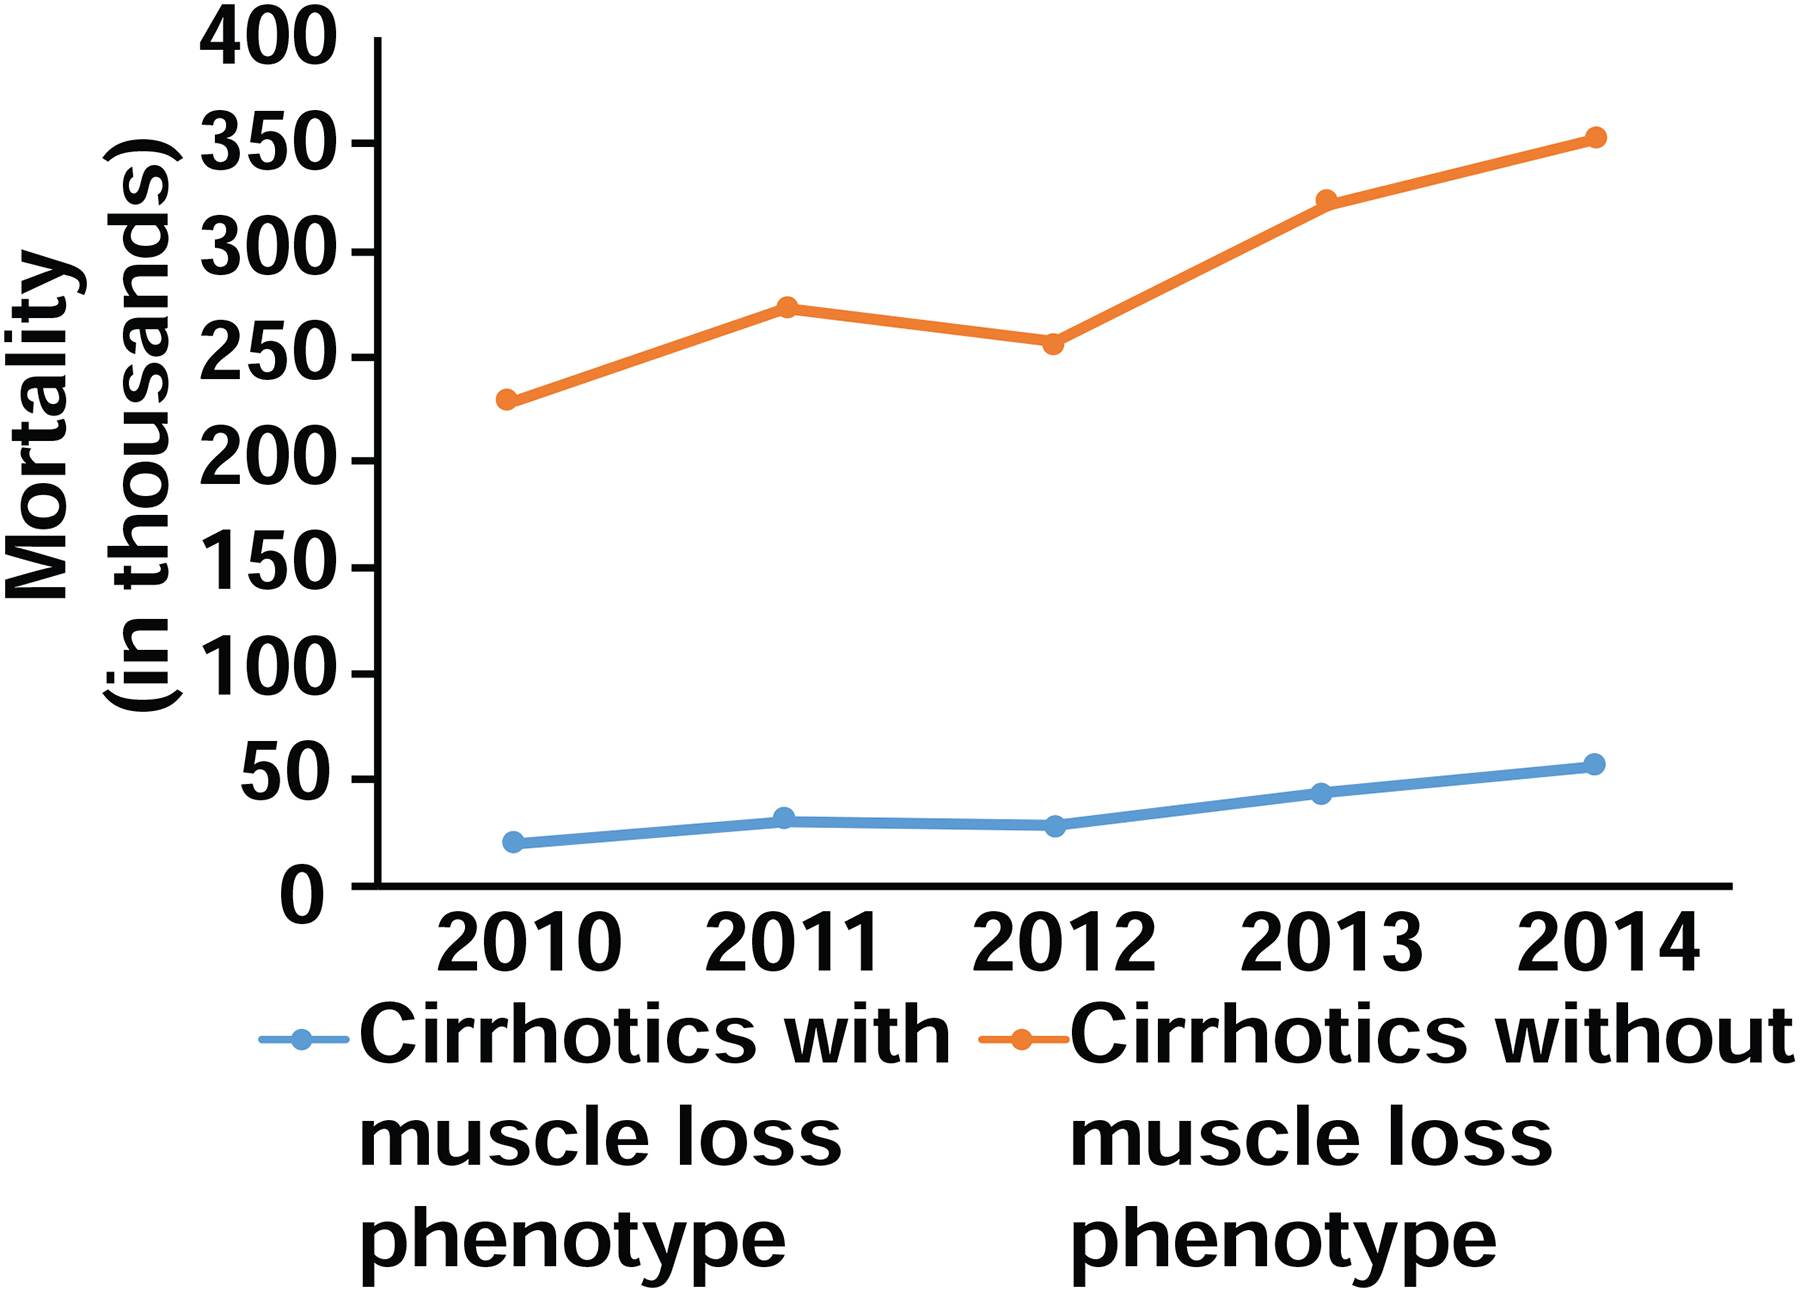
Cochran Armitage trend test demonstrated increased risk of mortality over the time period for cirrhotics with muscle loss phenotype (p<0.001).
Table 8.
Risk Factors for mortality due to cirrhosis
| Univariate OR (95% CI) | Multivariate OR (95% CI) | |
|---|---|---|
| Muscle loss phenotype | 2.71 (2.61–2.82) | 2.30 (2.21–2.39) |
| Age* | 1.16 (1.14–19) | 1.08 (1.05–1.10) |
| Female | 0.96 (0.93–0.99) | 0.93 (0.90–0.96) |
| Race (white) | ||
| Black | 1.28 (1.21–1.34) | 1.22 (1.16–1.28) |
| Hispanic | 0.84 (0.80–0.88) | 0.88 (0.84–0.92) |
| Other | 1.15 (1.08–1.23) | 1.11 (1.04–1.19) |
| Comorbidities | ||
| Alcohol abuse | 0.87 (0.84–0.89) | 0.96 (0.92–0.99) |
| Metastatic cancer | 2.89 (2.70–3.09) | 2.82 (2.62–3.03) |
| Solid tumors | 1.45 (1.36–1.55) | 1.46 (1.36–1.56) |
| Chronic lung disease | 1.13 (1.09–1.17) | 1.04 (0.99–1.08) |
| Coagulopathy | 1.79 (1.73–1.84) | 1.82 (1.76–1.88) |
| Anemia | 0.91 (0.84–0.98) | 0.90 (0.83–0.98) |
| CHF | 1.49 (1.43–1.55) | 1.34 (1.28–1.40) |
| AIDS | 1.03 (0.84–1.27) | 0.99 (0.80–1.22) |
| Acute kidney injury | 1.40 (1.36–1.45) | 1.25 (1.20–1.30) |
Multiple R square: 0.06; p < 2.2e-16. Baseline comparison group in parentheses.
Age represents the increased risk of mortality going from 52 to 67 years old.
Other race includes Native Americans and Asian / Pacific Islanders.
OR = Odds Ratio. CHF = congestive heart failure. AIDS = acquired immunodeficiency syndrome.
Discussion
Our data showed that a muscle loss phenotype was noted in over 11% of hospitalized patients with cirrhosis. This is lower than the prevalence of muscle loss/malnutrition reported in previous studies that were primarily in outpatients(1, 3, 4, 29, 30). Factors that may contribute to the lower than previously reported prevalence of a muscle loss phenotype include: lack of consistency in coding for a muscle loss phenotype in these patients and only patients with the most severe phenotype may have a diagnosis code linked to muscle loss and challenges in diagnosis of muscle loss in patients with obesity (sarcopenic obesity), ascites or edema. Previous cross-sectional studies have reported greater muscle loss in cirrhotics with increasing severity of liver disease(31–33). Since hospitalized patients with cirrhosis are more likely to have advanced disease, our observations of a lower prevalence of muscle loss than other studies is surprising. Interestingly, the prevalence of a muscle loss phenotype in this analysis was higher than the prevalence of protein calorie malnutrition in hospitalized cirrhotics in the NIS database for the years 1998–2005(18). The higher prevalence in our cohort may be related to a broader inclusion criteria for muscle loss phenotype. Another potential reason for the observed prevalence of a muscle loss phenotype to be higher than that of protein calorie malnutrition could be a difference in population nutritional trends across studies(19–21). However, population trends in dietary intake are likely to alter the prevalence of protein calorie malnutrition in the general medical population also. In contrast to our observations in the cirrhotic cohort, the prevalence of a muscle loss phenotype in the general medical patients in the present study was similar to the reported prevalence of protein calorie malnutrition in the previous NIS study(18), suggesting that the difference in prevalence was due to a true increase in prevalence, clinical recognition of muscle loss or variability in clinical characteristics of the patients evaluated including age, severity or etiology of liver disease.
The prevalence and severity of malnutrition or its major component, muscle loss, in cirrhosis has been reported to be higher in patients with alcoholic liver disease(12, 34) and the present data suggest that patients with alcoholic cirrhosis were more likely to be diagnosed to have a muscle loss phenotype than those with non-alcoholic causes of cirrhosis. Increasing prevalence of alcohol use disorders and the predicted increase in alcoholic liver disease may explain the higher prevalence of a muscle loss phenotype in the present study than the prevalence of protein calorie malnutrition reported earlier(18, 35). Irrespective of the underlying etiology of liver disease, single center studies have reported that muscle loss is associated with higher mortality and morbidity(6, 10, 33, 36). In our study, we noted that patients with a muscle loss phenotype had a higher mortality and greater predicted mortality/morbidity indices and consequent in-hospital mortality(26, 27, 37). These observations are consistent with reports by others that complications of cirrhosis (portal hypertension, encephalopathy, hepatorenal syndrome and spontaneous bacterial peritonitis) are more frequent in those with protein calorie malnutrition(38).
Comorbidity indices are correlated with length of hospital stay in patients with chest pain and orthopedic procedures, but such correlations are not available for those with liver disease(26, 27). We observed higher comorbidity indices and more liver-related comorbidities in cirrhotics than in general medical patients. Cirrhotic patients also had a longer duration of hospital stay, cost per admission, and more frequent suboptimal discharge outcomes, with a larger proportion being discharged either to a non-home facility or required additional home health assistance compared with the general medical population. Interestingly, in the present study, cirrhotics with a muscle loss phenotype were more likely to have longer durations of hospitalization, higher costs per admission and suboptimal discharge outcomes than those without a muscle loss phenotype. Longer duration of hospitalizations results not only in higher inpatient costs but also increased indirect costs of care because of the greater outpatient costs due to non-routine discharges (as defined by us). It is not known if a non-routine discharge increases readmissions or other adverse post-discharge outcomes, though there is emerging data that supports this interpretation(39). Others have reported that readmissions in cirrhosis are higher with longer length of stay, hepatic encephalopathy, and ascites(14, 16, 39), all of which were more frequent in cirrhotics with a muscle loss phenotype in the present study(13, 17). A muscle loss phenotype is, therefore, likely to add to the hospital admission costs of managing patients with liver disease and is consistent with a recent report that sarcopenia is associated with increased hospital costs(25). An interesting question would be if the length of stay contributed to the severity of or progression of muscle loss as has been reported in the hospitalized elderly subjects(40) but will require prospective analyses of nutritional indices before and after admissions. We also noted a lower coding for the use of parenteral nutrition than reported in the past in hospitalized cirrhotics(18) that may be due to variety of factors including underreporting as shown in other settings(41, 42), perception of limited benefits in cirrhosis or risks of central venous catheters(28, 34). Whether the primary team managing the patients (specialist vs. consultative) or nutritional consultations in these subjects also contribute to the development and contributions of muscle loss in hospitalization but these data are not available in such deidentified databases as the NIS and will require prospective studies.
On a multivariable analysis, we noted that in hospitalized cirrhotics, the odds ratio of death in those with a muscle loss phenotype was similar to those with metastatic cancer, after adjusting for comorbidities. Length of stay and hospital costs were also independently associated with a muscle loss phenotype, reiterating the clinical and resource costs of a diagnosis of a muscle loss phenotype in hospitalized patients with cirrhosis. These data are consistent with reports by us and others that outcomes in patients with cirrhosis are adversely affected by muscle loss(4, 33). There is also increasing recognition of the adverse impact of impaired contractile function, a component of frailty, that are not currently coded or evaluated in clinical settings. Measures of muscle strength and functional impairment during clinical assessment may help improve patient outcomes.
A limitation of using the NIS that is not unique to our study is that the data refer to individual hospitalizations and not to unique patients. Hence patients who are readmitted are counted as unique admissions which is likely to result in an underestimation of the consequences of muscle loss. Another limitation is that the severity of disease affects the degree of muscle loss(43), but the NIS database does not provide the data to calculate either the Child-Pugh score or MELD score. However, the primary goals of the present study were not to reiterate previous data, but rather to identify if hospital mortality, length of stay, cost per admission and the comorbidity indices were different in patients with or without a muscle loss phenotype. Our data showed that all of these parameters were adversely affected by muscle loss in this large cohort of patients. These data provide compelling evidence for targeting muscle loss in hospitalized patients with cirrhosis to not only improve clinical outcomes, but also reduce the health care cost burden in patients with liver disease.
Highlights.
Muscle loss contributed to higher mortality in hospitalized patients with cirrhosis
Hospitalized cirrhotics with muscle loss had higher length of stay, hospital charges
Cirrhotics with muscle loss needed greater post discharge care.
Targeting muscle loss in cirrhosis can improve outcomes in hospitalized cirrhotics.
Acknowledgements
The authors responsibilities were as follows - Adil Vural: Writing - original draft, Writing - review & editing. Amy Attaway: Data curation, Formal analysis, Investigation, Methodology, Writing - original draft, Writing - review & editing. Nicole Welch: Conceptualization, Formal analysis, Investigation, Methodology, Resources, Validation, Writing - original draft, Writing - review & editing. Joe Zein: Data curation, Methodology, Writing - review & editing. Srinivasan Dasarathy: Conceptualization, Data curation, Funding acquisition, Investigation, Methodology, Project administration, Resources, Supervision, Validation, Visualization, Writing - original draft, Writing - review & editing.
Funding: Supported in part by: NIH R21 AA022742; RO1 DK 113196; RO1 GM119174; R56HL141744; P50 AA024333; UO1 AA021890, UO1 AA026975; UO1 DK061732; and the Mikati Foundation Grant support to SD. AA was funded in part by the Research Program Committee (RPC) at the Cleveland Clinic. NW supported in part by the NIH Combined Training Program in Digestive Diseases Sciences (DTPDDS) (T32 DK083251) and American College of Gastroenterology Clinical Research Award.
Abbreviations used:
- NIS
Nationwide Inpatient Sample
- LOS
length of stay
- ICD
International Classification of Diseases
- OR
odds ratio
- SNF
skilled nursing facility
- ICF
intermediate care facility
- AIDS
acquired immunodeficiency syndrome
- CHF
congestive heart failure
Footnotes
Publisher's Disclaimer: This is a PDF file of an unedited manuscript that has been accepted for publication. As a service to our customers we are providing this early version of the manuscript. The manuscript will undergo copyediting, typesetting, and review of the resulting proof before it is published in its final form. Please note that during the production process errors may be discovered which could affect the content, and all legal disclaimers that apply to the journal pertain.
Conflict of interest: The authors have no other conflicts (financial or potential personal) to declare other than the unrestricted funding to the authors listed above.
REFERENCES.
- 1.Dasarathy S. Consilience in sarcopenia of cirrhosis. J Cachexia Sarcopenia Muscle 2012;3(4):225–37. doi: 10.1007/s13539-012-0069-3. [DOI] [PMC free article] [PubMed] [Google Scholar]
- 2.Scaglione S, Kliethermes S, Cao G, Shoham D, Durazo R, Luke A, Volk ML. The Epidemiology of Cirrhosis in the United States: A Population-based Study. J Clin Gastroenterol 2015;49(8):690–6. doi: 10.1097/MCG.0000000000000208. [DOI] [PubMed] [Google Scholar]
- 3.Dasarathy S, Merli M. Sarcopenia from mechanism to diagnosis and treatment in liver disease. J Hepatol 2016;65(6):1232–44. doi: 10.1016/j.jhep.2016.07.040. [DOI] [PMC free article] [PubMed] [Google Scholar]
- 4.Periyalwar P, Dasarathy S. Malnutrition in cirrhosis: contribution and consequences of sarcopenia on metabolic and clinical responses. Clin Liver Dis 2012;16(1):95–131. doi: 10.1016/j.cld.2011.12.009. [DOI] [PMC free article] [PubMed] [Google Scholar]
- 5.van Vugt JLA, Buettner S, Alferink LJM, Bossche N, de Bruin RWF, Darwish Murad S, Polak WG, Metselaar HJ, JNM IJ. Low skeletal muscle mass is associated with increased hospital costs in patients with cirrhosis listed for liver transplantation-a retrospective study. Transpl Int 2018;31(2):165–74. doi: 10.1111/tri.13048. [DOI] [PubMed] [Google Scholar]
- 6.Cause Dasarathy S. and management of muscle wasting in chronic liver disease. Curr Opin Gastroenterol 2016;32(3):159–65. doi: 10.1097/MOG.0000000000000261. [DOI] [PMC free article] [PubMed] [Google Scholar]
- 7.Evans WJ. Skeletal muscle loss: cachexia, sarcopenia, and inactivity. Am J Clin Nutr 2010;91(4):1123S–7S. doi: 10.3945/ajcn.2010.28608A. [DOI] [PubMed] [Google Scholar]
- 8.Muscaritoli M, Anker SD, Argiles J, Aversa Z, Bauer JM, Biolo G, Boirie Y, Bosaeus I, Cederholm T, Costelli P, et al. Consensus definition of sarcopenia, cachexia and pre-cachexia: joint document elaborated by Special Interest Groups (SIG) “cachexia-anorexia in chronic wasting diseases” and “nutrition in geriatrics”. Clin Nutr 2010;29(2):154–9. doi: 10.1016/j.clnu.2009.12.004. [DOI] [PubMed] [Google Scholar]
- 9.Plauth M, Schutz ET. Cachexia in liver cirrhosis. Int J Cardiol 2002;85(1):83–7. [DOI] [PubMed] [Google Scholar]
- 10.Carey EJ, Lai JC, Sonnenday C, Tapper EB, Tandon P, Duarte-Rojo A, Dunn MA, Tsien C, Kallwitz ER, Ng V, et al. A North American Expert Opinion Statement on Sarcopenia in Liver Transplantation. Hepatology 2019;70(5):1816–29. doi: 10.1002/hep.30828. [DOI] [PMC free article] [PubMed] [Google Scholar]
- 11.Carey EJ, Lai JC, Wang CW, Dasarathy S, Lobach I, Montano-Loza AJ, Dunn MA, Fitness LE, Exercise in Liver Transplantation C. A multicenter study to define sarcopenia in patients with end-stage liver disease. Liver Transpl 2017;23(5):625–33. doi: 10.1002/lt.24750. [DOI] [PMC free article] [PubMed] [Google Scholar]
- 12.Dasarathy J, McCullough AJ, Dasarathy S. Sarcopenia in Alcoholic Liver Disease: Clinical and Molecular Advances. Alcohol Clin Exp Res 2017;41(8):1419–31. doi: 10.1111/acer.13425. [DOI] [PMC free article] [PubMed] [Google Scholar]
- 13.Essam Behiry M, Mogawer S, Yamany A, Rakha M, Awad R, Emad N, Abdelfatah Y. Ability of the Short Physical Performance Battery Frailty Index to Predict Mortality and Hospital Readmission in Patients with Liver Cirrhosis. Int J Hepatol 2019;2019:8092865. doi: 10.1155/2019/8092865. [DOI] [PMC free article] [PubMed] [Google Scholar]
- 14.Ganesh S, Rogal SS, Yadav D, Humar A, Behari J. Risk factors for frequent readmissions and barriers to transplantation in patients with cirrhosis. PLoS One 2013;8(1):e55140. doi: 10.1371/journal.pone.0055140. [DOI] [PMC free article] [PubMed] [Google Scholar]
- 15.K ST, Kumar M, Ranjan P, Ghuman S, Arora A. IDDF2019-ABS-0345 Sarcopenia in cirrhosis: a risk factor for hospitalizations and short term mortality. Gut 2019;68(Suppl 1):A159–A60. doi: 10.1136/gutjnl-2019-IDDFAbstracts.310. [DOI] [Google Scholar]
- 16.Orman ES, Ghabril M, Emmett TW, Chalasani N. Hospital Readmissions in Patients with Cirrhosis: A Systematic Review. J Hosp Med 2018. 13 (7):490–495. doi: 10.12788/jhm.2967. [DOI] [PMC free article] [PubMed] [Google Scholar]
- 17.Reuter B, Shaw J, Hanson J, Tate V, Acharya C, Bajaj JS. Nutritional Assessment in Inpatients With Cirrhosis Can Be Improved After Training and Is Associated With Lower Readmissions. Liver Transpl 2019;25(12):1790–9. doi: 10.1002/lt.25602. [DOI] [PMC free article] [PubMed] [Google Scholar]
- 18.Sam J, Nguyen GC. Protein-calorie malnutrition as a prognostic indicator of mortality among patients hospitalized with cirrhosis and portal hypertension. Liver Int 2009;29(9):1396–402. doi: 10.1111/j.1478-3231.2009.02077.x. [DOI] [PubMed] [Google Scholar]
- 19.Berryman CE, Lieberman HR, Fulgoni VL 3rd, Pasiakos SM. Protein intake trends and conformity with the Dietary Reference Intakes in the United States: analysis of the National Health and Nutrition Examination Survey, 2001–2014. Am J Clin Nutr 2018;108(2):405–13. doi: 10.1093/ajcn/nqy088. [DOI] [PubMed] [Google Scholar]
- 20.Kim H, Rebholz CM, Caulfield LE, Ramsing R, Nachman KE. Trends in types of protein in US adults: results from the National Health and Nutrition Examination Survey 1999–2010. Public Health Nutr 2018:1–11. doi: 10.1017/S1368980018003348. [DOI] [PMC free article] [PubMed] [Google Scholar]
- 21.Shan Z, Rehm CD, Rogers G, Ruan M, Wang DD, Hu FB, Mozaffarian D, Zhang FF, Bhupathiraju SN. Trends in Dietary Carbohydrate, Protein, and Fat Intake and Diet Quality Among US Adults, 1999–2016. JAMA 2019;322(12):1178–87. doi: 10.1001/jama.2019.13771. [DOI] [PMC free article] [PubMed] [Google Scholar]
- 22.Wang DD, Leung CW, Li Y, Ding EL, Chiuve SE, Hu FB, Willett WC. Trends in dietary quality among adults in the United States, 1999 through 2010. JAMA Intern Med 2014;174(10):1587–95. doi: 10.1001/jamainternmed.2014.3422. [DOI] [PMC free article] [PubMed] [Google Scholar]
- 23.U.S. Department of Health and Human Services. International classification of diseases tr, clinical modifications (ICD-9-CM). 6th edition Washington, DC: Health Care Financing Administration; 1997. DHHS Publication No. (PHS) 96–1260. [Google Scholar]
- 24.Fox KM, Brooks JM, Gandra SR, Markus R, Chiou CF. Estimation of Cachexia among Cancer Patients Based on Four Definitions. J Oncol 2009;2009:693458. doi: 10.1155/2009/693458. [DOI] [PMC free article] [PubMed] [Google Scholar]
- 25.Cruz-Jentoft AJ, Bahat G, Bauer J, Boirie Y, Bruyere O, Cederholm T, Cooper C, Landi F, Rolland Y, Sayer AA, et al. Sarcopenia: revised European consensus on definition and diagnosis. Age Ageing 2019;48(1):16–31. doi: 10.1093/ageing/afy169. [DOI] [PMC free article] [PubMed] [Google Scholar]
- 26.Lieffers JR, Baracos VE, Winget M, Fassbender K. A comparison of Charlson and Elixhauser comorbidity measures to predict colorectal cancer survival using administrative health data. Cancer 2011;117(9):1957–65. doi: 10.1002/cncr.25653. [DOI] [PubMed] [Google Scholar]
- 27.Menendez ME, Neuhaus V, van Dijk CN, Ring D. The Elixhauser comorbidity method outperforms the Charlson index in predicting inpatient death after orthopaedic surgery. Clin Orthop Relat Res 2014;472(9):2878–86. doi: 10.1007/s11999-014-3686-7. [DOI] [PMC free article] [PubMed] [Google Scholar]
- 28.Plauth M, Bernal W, Dasarathy S, Merli M, Plank LD, Schutz T, Bischoff SC. ESPEN guideline on clinical nutrition in liver disease. Clin Nutr 2019;38(2):485–521. doi: 10.1016/j.clnu.2018.12.022. [DOI] [PMC free article] [PubMed] [Google Scholar]
- 29.Merli M, Riggio O, Dally L. Does malnutrition affect survival in cirrhosis? PINC (Policentrica Italiana Nutrizione Cirrosi). Hepatology 1996;23(5):1041–6. doi: 10.1002/hep.510230516. [DOI] [PubMed] [Google Scholar]
- 30.Merli M, Romiti A, Riggio O, Capocaccia L. Optimal nutritional indexes in chronic liver disease. JPEN J Parenter Enteral Nutr 1987;11(5 Suppl):130S–4S. doi: 10.1177/014860718701100521. [DOI] [PubMed] [Google Scholar]
- 31.Roongpisuthipong C, Sobhonslidsuk A, Nantiruj K, Songchitsomboon S. Nutritional assessment in various stages of liver cirrhosis. Nutrition 2001;17(9):761–5. doi: 10.1016/s0899-9007(01)00626-8. [DOI] [PubMed] [Google Scholar]
- 32.Kang SH, Jeong WK, Baik SK, Cha SH, Kim MY. Impact of sarcopenia on prognostic value of cirrhosis: going beyond the hepatic venous pressure gradient and MELD score. J Cachexia Sarcopenia Muscle 2018;9(5):860–70. doi: 10.1002/jcsm.12333. [DOI] [PMC free article] [PubMed] [Google Scholar]
- 33.Kim G, Kang SH, Kim MY, Baik SK. Prognostic value of sarcopenia in patients with liver cirrhosis: A systematic review and meta-analysis. PLoS One 2017;12(10):e0186990. doi: 10.1371/journal.pone.0186990. [DOI] [PMC free article] [PubMed] [Google Scholar]
- 34.Dasarathy S. Nutrition and Alcoholic Liver Disease: Effects of Alcoholism on Nutrition, Effects of Nutrition on Alcoholic Liver Disease, and Nutritional Therapies for Alcoholic Liver Disease. Clin Liver Dis 2016;20(3):535–50. doi: 10.1016/j.cld.2016.02.010. [DOI] [PMC free article] [PubMed] [Google Scholar]
- 35.Guirguis J, Chhatwal J, Dasarathy J, Rivas J, McMichael D, Nagy LE, McCullough AJ, Dasarathy S. Clinical impact of alcohol-related cirrhosis in the next decade: estimates based on current epidemiological trends in the United States. Alcohol Clin Exp Res 2015;39(11):2085–94. doi: 10.1111/acer.12887. [DOI] [PMC free article] [PubMed] [Google Scholar]
- 36.Kalafateli M, Konstantakis C, Thomopoulos K, Triantos C. Impact of muscle wasting on survival in patients with liver cirrhosis. World J Gastroenterol 2015;21(24):7357–61. doi: 10.3748/wjg.v21.i24.7357. [DOI] [PMC free article] [PubMed] [Google Scholar]
- 37.Jepsen P Comorbidity in cirrhosis. World J Gastroenterol 2014;20(23):7223–30. doi: 10.3748/wjg.v20.i23.7223. [DOI] [PMC free article] [PubMed] [Google Scholar]
- 38.Huisman EJ, Trip EJ, Siersema PD, van Hoek B, van Erpecum KJ. Protein energy malnutrition predicts complications in liver cirrhosis. Eur J Gastroenterol Hepatol 2011;23(11):982–9. doi: 10.1097/MEG.0b013e32834aa4bb. [DOI] [PubMed] [Google Scholar]
- 39.Koola JD, Ho SB, Cao A, Chen G, Perkins AM, Davis SE, Matheny ME. Predicting 30-Day Hospital Readmission Risk in a National Cohort of Patients with Cirrhosis. Dig Dis Sci 2019. doi: 10.1007/s10620-019-05826-w.epub ahead of print. [DOI] [PMC free article] [PubMed] [Google Scholar]
- 40.Covinsky KE, Palmer RM, Fortinsky RH, Counsell SR, Stewart AL, Kresevic D, Burant CJ, Landefeld CS. Loss of independence in activities of daily living in older adults hospitalized with medical illnesses: increased vulnerability with age. J Am Geriatr Soc 2003;51(4):451–8. doi: 10.1046/j.1532-5415.2003.51152.x. [DOI] [PubMed] [Google Scholar]
- 41.Venkatesh AK, Mei H, Kocher KE, Granovsky M, Obermeyer Z, Spatz ES, Rothenberg C, Krumholz HM, Lin Z. Identification of Emergency Department Visits in Medicare Administrative Claims: Approaches and Implications. Acad Emerg Med 2017;24(4):422–31. doi: 10.1111/acem.13140. [DOI] [PMC free article] [PubMed] [Google Scholar]
- 42.Dismuke CE. Underreporting of computed tomography and magnetic resonance imaging procedures in inpatient claims data. Med Care 2005;43(7):713–7. doi: 10.1097/01.mlr.0000167175.72130.a7. [DOI] [PubMed] [Google Scholar]
- 43.Welch N, Dasarathy J, Runkana A, Penumatsa R, Bellar A, Reen J, Rotroff D, McCullough AJ, Dasarathy S. Continued muscle loss increases mortality in cirrhosis: Impact of aetiology of liver disease. Liver Int 2019. doi: 10.1111/liv.14358. [DOI] [PMC free article] [PubMed] [Google Scholar]