

Abstract
Purpose:
To determine the functional concerns of patients with different clinical and demographic characteristics seeking low vision care in south India.
Design:
Cross-sectional clinic-based survey.
Methods:
Consecutive new patients evaluated by the low vision service at xref, xref, India from September 2016 to March 2017 were recruited. Clinical and sociodemographic data were collected and participants underwent a semi-structured survey to determine vision-related functional concerns. Analyses were conducted to determine associations with functional concerns. This study was approved by the xref Institutional Review Board and all participants provided informed consent.
Results:
The study included 419 participants (mean age 42.0 years, 65.2% male). Retinal dystrophy (35.8%) and acquired retinal disease (22.0%) were the most common diagnoses. The most frequently cited functional concerns were reading (37.7%), mobility (19.9%), and facial identification (13.8%). The number of functional concerns did not vary by diagnosis, age, sex, education, occupation, or presenting visual acuity (p>.05). Participants with retinal dystrophy were more likely to cite problems with night vision (p<.001). Age was significantly associated with greater difficulty recognizing faces (OR=1.20, 95%CI=1.01–1.43) and less night vision difficulty (OR=0.75, 95%CI=0.60–1.00). Worse presenting visual acuity was significantly associated with reporting a mobility problem (OR=2.87, 95%CI=2.09–3.93).
Conclusion:
This study supports the expansion of low vision services in India targeted to common functional concerns including reading, mobility, and facial identification. However, results do not support the use of ocular diagnosis for this purpose.
Keywords: low vision, India, vision rehabilitation
I. INTRODUCTION
More than 250 million people are blind or visually impaired worldwide and 90% live in low and middle income countries.1 Due to India’s large population and high prevalence of eye disease, it is home to more individuals with blindness and VI than any other country2 and the number affected is projected to increase due to aging of the population. In India, vision impairment has been associated with increased falls, depression, social isolation, and decreased independence and vision-related quality of life (VRQOL).3–7 While up to 85% of patients who receive low vision services may experience improved functioning and VRQOL,8–11 low vision services are available to less than 10% of the Indian population.12
Low vision services can include the prescription of low vision aids, orientation and mobility therapy, adaptive techniques, and occupational therapy. Typically, a plan for low vision rehabilitation is developed around an individual patient’s goals, impairments, and type(s) of vision loss (e.g. visual acuity, peripheral fields, contrast sensitivity).13 A rehabilitation plan should also be responsive to the local culture and environment, since in different settings disabilities may cause distinct functional limitations due to variable factors like local occupational demands and environmental challenges.14
Accordingly, it is important for local practitioners to understand the clinical and demographic factors that are associated with specific impairments in patients with low vision. A study by Brown et al identified the prevalence and risk factors for 13 different concerns in patients with low vision in the United States.15 They found that difficulty reading was by far the most common impairment, followed by driving, using assistive devices, in-home activities, lighting and glare, and social interactions. Some concerns varied as a function of age, visual acuity, or sex of the patient. However, as the authors pointed out, these results may not be applicable to settings beyond the United States. To our knowledge, few studies from India have investigated the factors associated with specific functional limitations in low vision,11,16–18 and they were focused on a highly specific population,17,18 a single disease,16 or were limited by a predefined set of survey questions.11
In the current study, we sought to determine the most common functional concerns of patients with different ocular diagnoses seeking low vision care in south India. We also identified clinical and demographic factors predictive of each concern. These data may help practitioners and researchers to design informed treatment plans and new interventions that are responsive to the needs of Indians with low vision.
II. METHODS
Ethical approval for this study (Project Code RES2016034CLI) was provided by the Institutional Review Board of xref, xref, India (Chairperson xref) on 20 August 2016. All participants provided informed consent to participate in this study and it adhered to the tenets of the Declaration of Helsinki.
A. Study Sample
Consecutive new patients seen in the low vision clinic at xref in xref, India from September 2016 to March 2017 were informed of the study and offered the opportunity to participate. Participants in this study were new to the low vision service and were either referred internally from other xref doctors, referred from other medical providers in the community, or were self-referred. The low vision service at xref provides a standard low vision examination and evaluation and offers a range of optical low vision devices.
B. Data
The primary ocular diagnosis for each participant was determined by the examining ophthalmologist and presenting visual acuity (PVA) was measured for each eye on a logMAR chart. Detailed ocular diagnoses were categorized as acquired retinal disease, congenital pathology, glaucoma, high refractive error, neuro-ophthalmic disease, retinal dystrophy, or other diseases. The most common types of acquired retinal disease were age-related macular degeneration (20/92, 21.7%) and retinal detachment (10/92, 10.9%), while other less common diagnoses included conditions such as central serous chorioretinopathy, retinal detachment, and macular scar, for example. Acquired retinal diseases were grouped together due to the small number of participants with each individual diagnosis. The anatomic site of low vision was noted according the World Health Organization Eye Examination Record.19
Additional data were recorded by a trained interviewer, including age, sex, educational attainment, and occupation. Participants were asked, “because of your vision, do you face any difficulties in your life?” Up to 3 responses to this question were recorded and served as the primary outcome variable. The free-text responses of participants were assigned to one of the following 12 impairment categories: color identification; computers; cooking; driving; face identification; mobility; night vision; pain; reading and writing; school/work difficulty; socioemotional problems; and watching television. To classify participant responses, two independent coders classified each free-text statement and disagreements were adjudicated by a third coder.
On initial review of the study data, the difficulties that participants faced in their lives could not be determined for 194 (41%) participants because data was missing or recorded answers were vague (e.g. “seeing problem”). Therefore, the same interviewer attempted to contact each of these participants by telephone to obtain complete data. Ultimately, complete data was available for 419 of the 470 (89.1%) participants enrolled in the study.
C. Statistical Analyses
Pearson chi-squared tests and ANOVA were used to compare differences in age, sex, educational attainment, occupation, number of functional impairments, and PVA in the better-seeing eye by ocular diagnosis category. The proportion of participants reporting each impairment was stratified by ocular diagnosis category (for impairments reported by >1 participant). Multivariable logistic regression was used to model the odds of reporting each impairment as a function of age, sex, and PVA in the better-seeing eye. Education and occupation were not included in these models since there was too few participants in some levels of those variables to do so. Logistic models were run for each impairment category endorsed by ≥ 30 participants, since logistic models with < 10 events per predictor variable have a high risk of bias due to large sample variance estimates.20 Negative binomial regression was used to test the association of age, sex, highest education, occupation, and PVA in the better-seeing eye with the number of functional impairments cited. Analyses were conducted using Stata version 14 (Stata Corp, College Station, TX, USA). All statistical tests were two-tailed with a significance threshold of P ≤ .05.
III. RESULTS
Characteristics of the study sample stratified by primary ocular diagnosis are presented in Table 1. We included 419 patients, 65.2% of whom were male with a mean age of 42.0 years old. The most common ocular diagnoses were retinal dystrophy (35.8%) and acquired retinal disease (22.0%), which together comprised more than half of the sample. Ocular diagnoses varied significantly as a function of age (p<0.001), educational attainment (p=.001), occupation (p<.001), and PVA in the better-seeing eye (p<0.001), but not sex (p=0.67). Table 2 presents the classification of participants according to the anatomic site of their low vision.
Table 1.
Characteristics of study sample stratified by primary ocular diagnosis.
| Overall (n=419) | Acquired retinal disease (n=92) | Congenital Pathology (n=36) | Glaucoma (n=45) | High Refractive Error (n=16) | Neurologic (n=46) | Retinal Dystrophy (n=150) | Other (n=34) | P | ||
|---|---|---|---|---|---|---|---|---|---|---|
| Age | 48.5 | 30.8 | 46.5 | 40.6 | 38.0 | 42.3 | 35.5 | <.001 | ||
| Sex | ||||||||||
| Female | 146 (34.8%) | 34 (36.9%) | 14 (38.9%) | 14 (31.1%) | 6 (37.5%) | 12 (26.1%) | 57 (38.0%) | 9 (26.5%) | .67 | |
| Male | 273 (65.2%) | 58 (63.0%) | 22 (61.1%) | 31 (68.9%) | 10 (62.5%) | 34 (73.9%) | 93 (62.0%) | 25 (73.5%) | ||
| Education | ||||||||||
| No School | 41 (9.8%) | 3 (3.3%) | 1 (2.8%) | 5 (11.1%) | 0 (0.0%) | 9 (19.6%) | 16 (10.7%) | 7 (20.6%) | .001 | |
| Primary | 77 (18.4%) | 14 (15.2%) | 5 (13.9%) | 11 (24.4%) | 1 (6.3%) | 8 (17.4%) | 33 (22.0%) | 5 (14.7%) | ||
| Secondary | 157 (37.5%) | 39 (42.4%) | 10 (27.8%) | 14 (31.1%) | 13 (81.3%) | 14 (30.4%) | 60 (40.0%) | 7 (20.6%) | ||
| Higher Secondary | 22 (5.3%) | 4 (4.4%) | 2 (5.6%) | 4 (8.9%) | 2 (12.5%) | 3 (6.5%) | 7 (4.7%) | 0 (0.0%) | ||
| University | 116 (27.7%) | 30 (32.6%) | 17 (47.2%) | 10 (22.2%) | 0 (0.0%) | 10 (21.7%) | 34 (22.7%) | 15 (44.1%) | ||
| Advanced Degree | 6 (1.4%) | 2 (2.2%) | 1 (2.8%) | 1 (2.2%) | 0 (0.0%) | 2 (4.4%) | 0 (0.0%) | 0 (0.0%) | ||
| Occupation | ||||||||||
| Agriculture | 28 (6.7%) | 3 (3.3%) | 0 (0.0%) | 6 (13.3%) | 0 (0.0%) | 5 (10.9%) | 12 (8.0%) | 2 (5.9%) | <.001 | |
| Business | 13 (3.1%) | 5 (5.4%) | 3 (8.3%) | 1 (2.2%) | 0 (0.0%) | 2 (4.4%) | 2 (1.3%) | 0 (0.0) | ||
| Wage Work | 58 (13.8%) | 8 (8.7%) | 3 (8.3%) | 3 (6.7%) | 9 (56.3%) | 6 (13.0%) | 26 (17.3%) | 3 (8.8%) | ||
| Not Working | 67 (16.0%) | 12 (13.0%) | 6 (16.7%) | 11 (24.4%) | 3 (18.7%) | 2 (4.4%) | 26 (17.3%) | 7 (20.6%) | ||
| Other | 138 (32.9%) | 33 (35.9%) | 7 (19.4%) | 13 (28.9%) | 3 (18.7%) | 18 (39.1%) | 53 (35.3%) | 11 (32.4%) | ||
| Professional | 53 (12.7%) | 13 (14.1%) | 7 (19.4%) | 5 (11.1%) | 0 (0.0%) | 7 (15.2%) | 14 (9.3%) | 7 (20.6%) | ||
| Retired | 21 (5.0%) | 13 (14.1%) | 0 (0.0%) | 1 (2.2%) | 0 (0.0%) | 0 (0.0%) | 7 (4.7%) | 0 (0.0%) | ||
| Student | 41 (9.8%) | 5 (5.4%) | 10 (27.8%) | 5 (11.1%) | 1 (6.3%) | 6 (13.0%) | 10 (6.7%) | 4 (11.8%) | ||
| Presenting VA in Better Eye, logMAR (SD) | 1.08 (.76) | .77 (.46) | 1.39 (.79) | 1.23 (.82) | .90 (.41) | 1.13 (.66) | 1.10 (.88) | 1.37 (.90) | <.001 | |
SD: standard deviation, VA: visual acuity
Table 2.
Distribution of study sample by anatomic site of low vision.
| Anatomic site | N | % |
|---|---|---|
| Cornea | 2 | 0.48% |
| Lens | 7 | 1.7% |
| Optic Nerve | 45 | 10.7% |
| Retina | 257 | 61.3% |
| Uvea | 4 | 0.95% |
| Whole Globea | 41 | 9.8% |
| Other | 63 | 15.0% |
38 of 41 (92.7%) classified as whole globe had a diagnosis of glaucoma
Most participants (n=242, 57.8%) endorsed a single impairment, though 26.0% did not cite any difficulty due to their vision, and 16.2% noted 2–3 difficulties (Figure 1). The number of difficulties did not differ significantly by diagnosis (p=0.69), age (p=0.93), sex (p=0.31), highest education (p=0.13), occupation (p=0.82), or PVA in the better-seeing eye (p=0.60). Figure 2 illustrates the proportion of participants who endorsed each functional limitation. The most common difficulty was reading (37.7%), followed by mobility (19.9%), and facial identification (13.8%), while all others impairments were cited by <10% of respondents.
Figure 1. Number of Reported Functional Difficulties.

Vertical bars depict the proportion of the study sample that cited zero, one, two, or three distinct functional difficulties related to low vision.
Figure 2. Prevalence of Functional Difficulties Related to Low Vision.
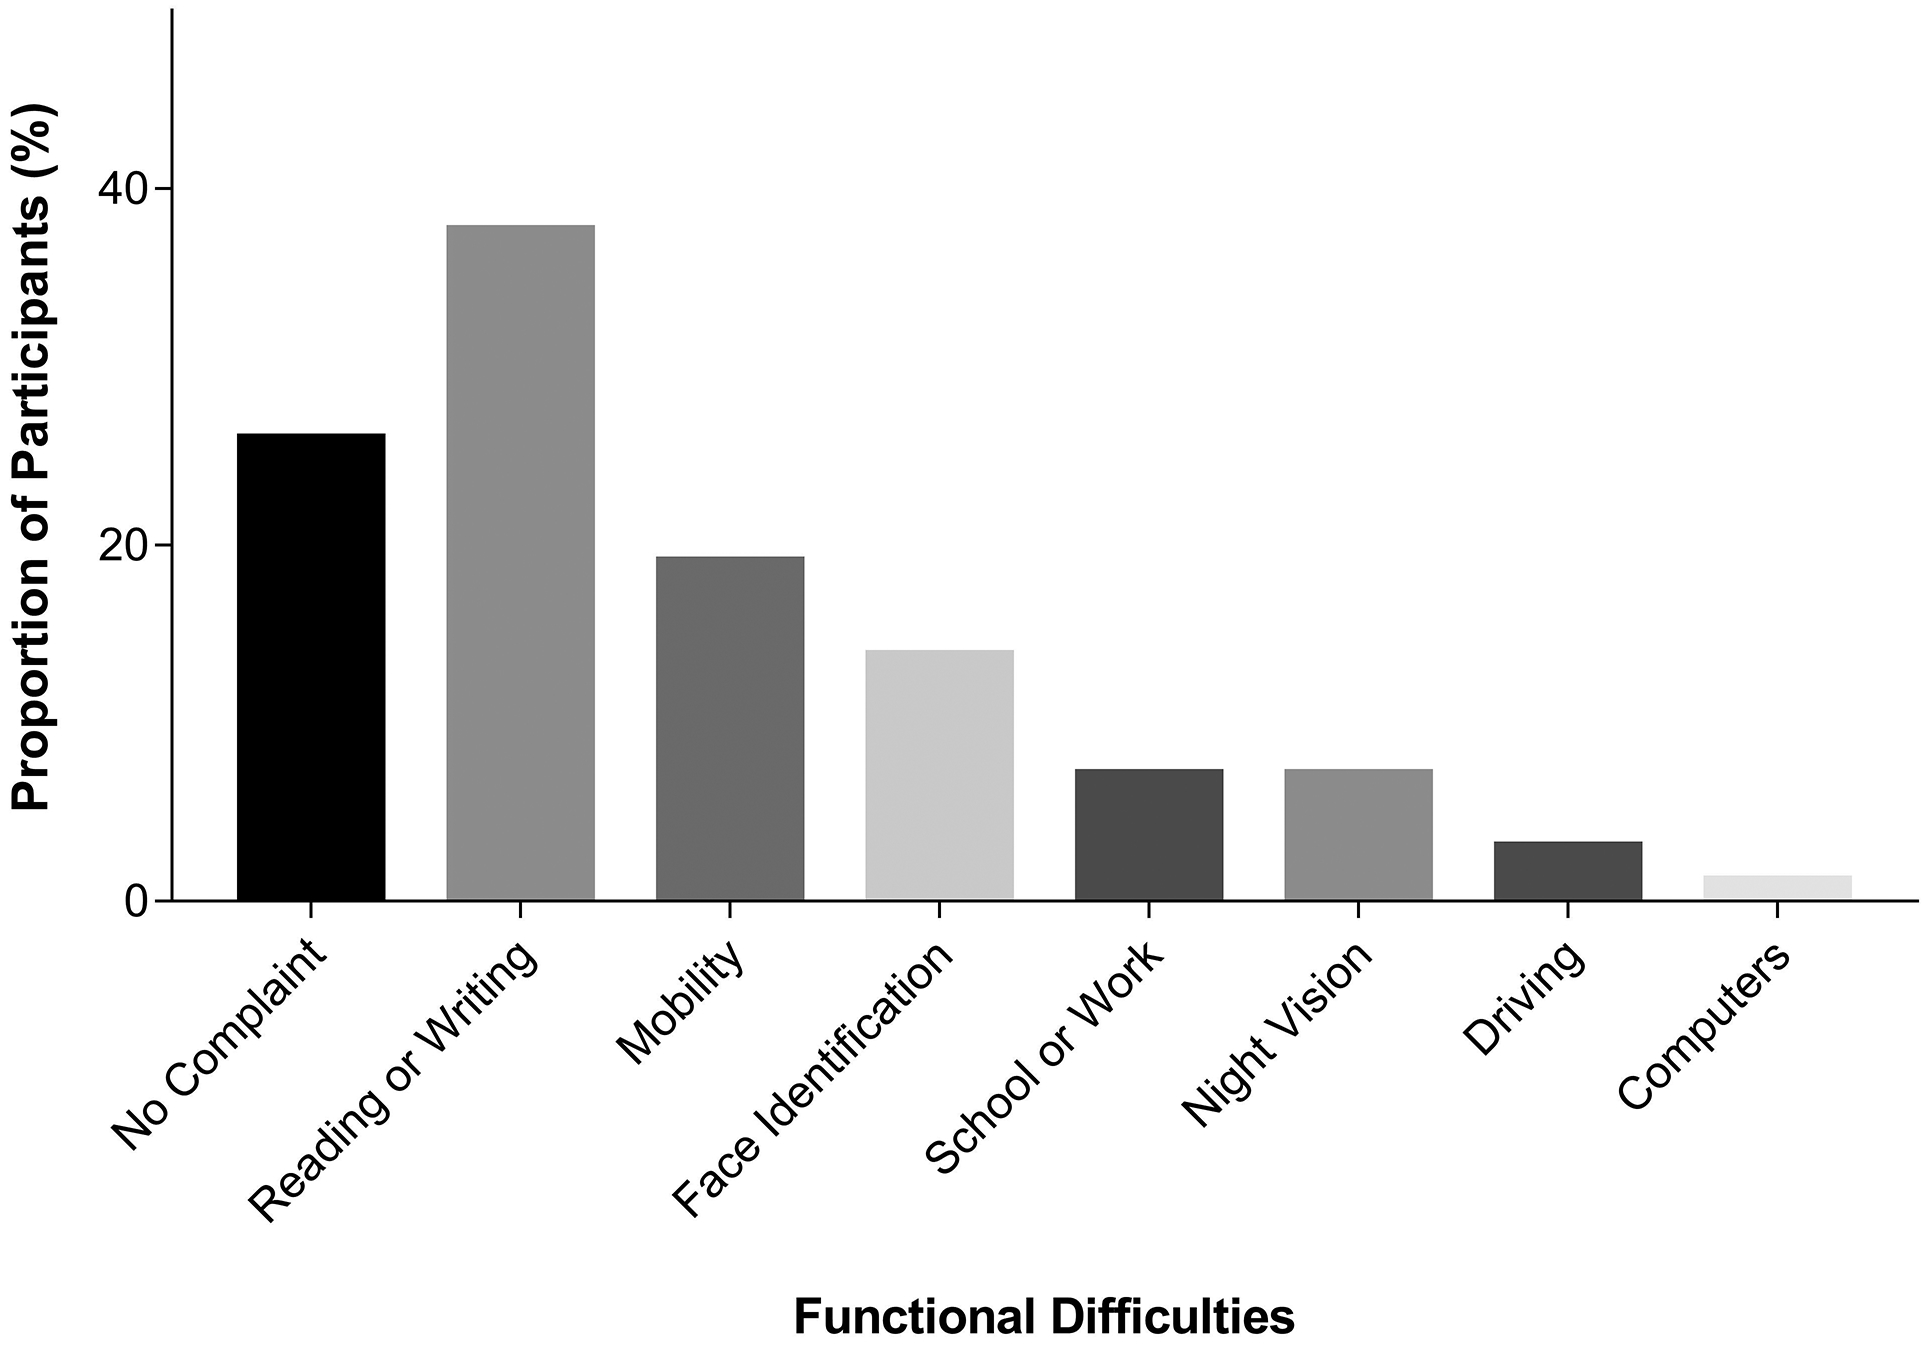
The proportion of participants reporting concerns related to each functional category that was endorsed by ≥ 1% of the study sample.
Table 3 presents functional difficulties stratified by ocular diagnosis. The only significant association was between night vision difficulty and ocular diagnosis (p<.001); of the 30 participants who endorsed night vision problems, 23 (76.7%) had a diagnosis of retinal dystrophy. Other functional difficulties were not more common in any specific eye disease.
Table 3.
Functional difficulties stratified by primary ocular diagnosis.
| Overall (n=419) | Acquired retinal disease (n=92) | Congenital Pathology (n=36) | Glaucoma (n=45) | High Refractive Error (n=16) | Neurologic (n=46) | Retinal Dystrophy (n=150) | Other (n=34) | P | |
|---|---|---|---|---|---|---|---|---|---|
| Impairment(s) | |||||||||
| ≥1 | 310 | 68 (73.9%) | 30 (83.3%) | 31 (68.9%) | 13 (81.2%) | 30 (65.2%) | 116 (77.3%) | 22 (64.7%) | .33 |
| Reading or Writing | |||||||||
| Yes | 158 | 45 (48.9%) | 17 (47.2%) | 17 (37.8%) | 6 (37.5%) | 16 (34.8%) | 44 (29.3%) | 13 (38.2%) | .09 |
| Mobility | |||||||||
| Yes | 80 | 9 (9.8%) | 8 (22.2%) | 11 (24.4%) | 3 (18.8%) | 6 (13.0%) | 37 (24.7%) | 6 (17.7%) | .11 |
| Facial Identification | |||||||||
| Yes | 58 | 13 (14.1%) | 5 (13.9%) | 5 (11.1%) | 6 (37.5%) | 6 (13.0%) | 21 (14.0%) | 2 (5.9%) | .14 |
| School or Work | |||||||||
| Yes | 30 | 5 (5.4%) | 2 (5.6%) | 2 (4.4%) | 2 (12.5%) | 4 (8.7%) | 13 (8.7%) | 2 (5.9%) | .87 |
| Night Vision | |||||||||
| Yes | 30 | 2 (2.2%) | 0 (0.0%) | 0 (0.0%) | 0 (0.0%) | 4 (8.7%) | 23 (15.3%) | 1 (2.9%) | <.001 |
| Driving | |||||||||
| Yes | 13 | 4 (4.3%) | 1 (2.8%) | 2 (4.4%) | 0 (0.0%) | 2 (4.3%) | 2 (1.3%) | 2 (5.9%) | .69 |
| Computers | |||||||||
| Yes | 5 | 0 (0.0%) | 1 (2.8%) | 0 (0.0%) | 0 (0.0%) | 1 (2.2%) | 3 (2.0%) | 0 (0.0%) | .65 |
| Cooking | |||||||||
| Yes | 2 | 0 (0.0%) | 0 (0.0%) | 1 (2.2%) | 0 (0.0%) | 0 (0.0%) | 1 (0.7%) | 0 (0.0%) | .67 |
Multivariable logistic models were used to test the association between functional impairments and age, sex, and PVA in the better-seeing eye. The results of these models are presented in Figure 3. Each 10-year increase in age corresponded to 20% increased odds of difficulty with facial recognition (OR=1.20, 95% CI=1.01, 1.43, p=.03) and 22% decreased odds of night vision difficulty (OR=0.78, 95% CI=0.60, 1.00, p=.05). Worse PVA was associated with greater odds of reporting a mobility problem (OR=2.87, 95% CI=2.09, 3.93, p<.001). No other statistically significant associations were detected in these models.
Figure 3. Forest Plot of Associations with Functional Impairment Categories.

Results of logistic regression models of the odds of functional impairment categories as a function of presenting visual acuity in the better-seeing eye, sex, and age. Models were built for impairment categories endorsed by ≥ 30 participants.
IV. DISCUSSION
Blindness and VI are the second leading cause of years lived with disability in India.2 Nonetheless, a 2011 report found that only 10% or less of the Indian population had access to low vision services.12 Additional research, training, and capacity building is needed to improve the provision of low vision services in India and to attend to the needs of an aging population. The current study makes several important contributions to this effort. First, to our knowledge this is the only Indian study to describe the day-to-day difficulties that are common in different ocular diagnoses among those seeking low vision services. In addition, the study provides practical data on clinical and demographic factors that are associated with specific functional limitations.
In the current study, reading was the most common functional difficulty, affecting 37.7% of those presenting for low vision care. In a study from the U.S., reading was also the most important functional difficulty and affected 66.4%.15 The higher prevalence of reading difficulty in the U.S. was likely due to the high proportion of macular disease, as well as differences in literacy and cultural, environmental, and occupational demands between India and the U.S. The second and third most commonly cited functional difficulties in the U.S. study were driving and assistive device use, respectively. Neither of these issues were commonly cited by Indian patients with low vision. While this study did not ask about past and current driving behaviors, automotive vehicle ownership is low in India and access to assistive devices is poor.21,22 These findings further underscore the importance of local studies to understand how the experience of living with eye disease varies from place to place.
It was surprising to learn that there were few associations between ocular diagnosis and functional difficulty. Based on prior reports,23,24 it was anticipated that eye diseases like glaucoma and retinal dystrophy that cause peripheral field loss would be strongly associated with mobility difficulty. Since the extent of peripheral field loss was not known in this study, it is possible that a measure of the extent visual field loss (e.g. mean deviation) would be associated with mobility difficulty. In addition, visual acuity was not associated with tasks like reading and facial identification that require good central vision. It is possible that some participants may have successfully adapted to vision loss or adopted compensatory strategies, and therefore did not express difficulty performing tasks that would otherwise be challenging. It is notable, however, that age was significantly associated with greater difficulty recognizing faces and that worse PVA was significantly associated with mobility difficulty; these may be important considerations for low vision providers in India. Finally, the functional difficulties of those with congenital and acquired pathologies did not appear to differ, despite the possibility that individuals with congenital vision loss might be more likely to develop compensatory strategies.
About one-quarter of the study sample did not cite any difficulty in their daily lives due to vision impairment. This may have been the case if patients were referred because a medical provider or family member believed they could benefit from low vision care or if they were inappropriately referred for low vision services. It is important to understand patients’ perceptions and experiences with low vision services in India, a topic that should be addressed in future qualitative or mixed-methods studies.
There were several limitations to this study. Several of the disease categories contained individuals with more than one ophthalmic diagnosis and this could have obfuscated associations between functional difficulties and specific disease states. Since it was not possible to perform robust and valid analyses on diagnostic categories containing a small number of individuals, some diagnoses were grouped together (e.g. acquired retinal diseases) and this may have biased the results away from detecting significant associations. Likewise, we did not perform analyses based on a classification using the anatomic site of low vision since nearly all cases (96.9%) were assigned to only four anatomic sites. A larger sample may have permitted more in depth analyses of the impact of education and occupation on functional difficulties among individuals with diverse low vision diagnoses. There were also a number of strengths to this study. To our knowledge, this is the first study to provide a comprehensive assessment of functional difficulties in a large and diverse sample of patients seeking low vision services in India. This study also provides data that can be easily compared to prior studies from other settings to discern differences between populations.
In summary, the results of this study support the expansion of low vision services in India targeted to common functional concerns like reading, mobility, and facial identification. However, these results do not support the use of ocular diagnosis for this purpose. Additional research is needed to better understand the effectiveness of low vision interventions for individuals with different conditions and functional concerns in India. Addressing the functional needs of patients with low vision in India is an important step toward decreasing vision-related disability and promoting independence and well-being for an aging population.
Conflicts of Interest/Sources of funding:
This research was supported by a grant from the National Institutes of Health to JRE (K23EY027848). For the remaining authors none was declared.
REFERENCES
- 1.Flaxman SR, Bourne RRA, Resnikoff S, et al. Global causes of blindness and distance vision impairment 1990–2020: a systematic review and meta-analysis. Lancet Glob Health 2017;5:e1221–e1234. [DOI] [PubMed] [Google Scholar]
- 2.Institute for Health Metrics and Evaluation (IHME). GBD Compare. Seattle, WA: IHME, University of Washington; 2015. Available at: vizhub.healthdata.org/gbd-compare [Accessed January 19, 2018]. [Google Scholar]
- 3.Ehrlich JR, Stagg BC, Andrews C, et al. Vision Impairment and Receipt of Eye Care Among Older Adults in Low- and Middle-Income Countries. JAMA Ophthalmol 2018. [DOI] [PMC free article] [PubMed] [Google Scholar]
- 4.Ravindran RM, Kutty VR. Risk Factors for Fall-Related Injuries Leading to Hospitalization Among Community-Dwelling Older Persons: A Hospital-Based Case-Control Study in Thiruvananthapuram, Kerala, India. Asia Pac J Public Health 2016;28:70S–76S. [DOI] [PMC free article] [PubMed] [Google Scholar]
- 5.Nirmalan PK, Tielsch JM, Katz J, et al. Relationship between vision impairment and eye disease to vision-specific quality of life and function in rural India: the Aravind Comprehensive Eye Survey. Invest Ophthalmol Vis Sci 2005;46:2308–2312. [DOI] [PubMed] [Google Scholar]
- 6.Nakade A, Rohatgi J, Bhatia MS, Dhaliwal U. Adjustment to acquired vision loss in adults presenting for visual disability certification. Indian J Ophthalmol 2017;65:228–232. [DOI] [PMC free article] [PubMed] [Google Scholar]
- 7.Kulkarni RS, Shinde RL. Depression and Its Associated Factors in Older Indians: A Study Based on Study of Global Aging and Adult Health (SAGE)-2007. J Aging Health 2015;27:622–649. [DOI] [PubMed] [Google Scholar]
- 8.Do AT, Ilango K, Ramasamy D, et al. Effectiveness of low vision services in improving patient quality of life at Aravind Eye Hospital. Indian J Ophthalmol 2014;62:1125–1131. [DOI] [PMC free article] [PubMed] [Google Scholar]
- 9.Hinds A, Sinclair A, Park J, et al. Impact of an interdisciplinary low vision service on the quality of life of low vision patients. Br J Ophthalmol 2003;87:1391–1396. [DOI] [PMC free article] [PubMed] [Google Scholar]
- 10.Leat SJ, Fryer A, Rumney NJ. Outcome of low vision aid provision: the effectiveness of a low vision clinic. Optom Vis Sci Off Publ Am Acad Optom 1994;71:199–206. [DOI] [PubMed] [Google Scholar]
- 11.Gothwal VK, Bharani S. Outcomes of Multidisciplinary Low Vision Rehabilitation in Adults. Investig Opthalmology Vis Sci 2015;56:7451. [DOI] [PubMed] [Google Scholar]
- 12.Chiang PP-C, O’Connor PM, Le Mesurier RT, Keeffe JE. A global survey of low vision service provision. Ophthalmic Epidemiol 2011;18:109–121. [DOI] [PubMed] [Google Scholar]
- 13.Fontenot JL, Bona MD, Kaleem MA, et al. Vision Rehabilitation Preferred Practice Pattern®. Ophthalmology 2018;125:P228–P278. [DOI] [PubMed] [Google Scholar]
- 14.World Health Organization, World Bank. World Report on Disability. Geneva, Switzerland: World Health Organization; 2011. [Google Scholar]
- 15.Brown JC, Goldstein JE, Chan TL, et al. Characterizing functional complaints in patients seeking outpatient low-vision services in the United States. Ophthalmology 2014;121:1655–1662.e1. [DOI] [PMC free article] [PubMed] [Google Scholar]
- 16.Das K, Gopalakrishnan S, Dalan D, et al. Factors influencing the choice of low-vision devices for visual rehabilitation in Stargardt disease. Clin Exp Optom 2018. [DOI] [PubMed] [Google Scholar]
- 17.Ganesh S, Sethi S, Srivastav S, et al. Impact of low vision rehabilitation on functional vision performance of children with visual impairment. Oman J Ophthalmol 2013;6:170–174. [DOI] [PMC free article] [PubMed] [Google Scholar]
- 18.Gogate P, Bhusan S, Ray S, Shinde A. Impact of correcting visual impairment and low vision in deaf-mute students in Pune, India. Indian J Ophthalmol 2016;64:898–903. [DOI] [PMC free article] [PubMed] [Google Scholar]
- 19.Gilbert C, Foster A, Négrel AD, Thylefors B. Childhood blindness: a new form for recording causes of visual loss in children. Bull World Health Organ 1993;71:485–489. [PMC free article] [PubMed] [Google Scholar]
- 20.Peduzzi P, Concato J, Kemper E, et al. A simulation study of the number of events per variable in logistic regression analysis. J Clin Epidemiol 1996;49:1373–1379. [DOI] [PubMed] [Google Scholar]
- 21.Bansal P, Kockelman KM, Schievelbein W, Schauer-West S. Indian vehicle ownership and travel behavior: A case study of Bengaluru, Delhi and Kolkata. Res Transp Econ 2018;71:2–8. [Google Scholar]
- 22.Dandona R, Dandona L, Srinivas M, et al. Planning low vision services in India : a population-based perspective. Ophthalmology 2002;109:1871–1878. [DOI] [PubMed] [Google Scholar]
- 23.Friedman DS, Freeman E, Munoz B, et al. Glaucoma and mobility performance: the Salisbury Eye Evaluation Project. Ophthalmology 2007;114:2232–2237. [DOI] [PubMed] [Google Scholar]
- 24.Turano KA, Geruschat DR, Stahl JW, Massof RW. Perceived visual ability for independent mobility in persons with retinitis pigmentosa. Invest Ophthalmol Vis Sci 1999;40:865–877. [PubMed] [Google Scholar]