Abstract
Spheroids recapitulate the organization, heterogeneity and microenvironment of solid tumors. Herein, we targeted spatiotemporally the accelerated metabolism of proliferative cells located on the spheroid surface that ensure structure maintenance and/or growth. We demonstrate that phosphorylated carbohydrate amphiphile acts as a potent antimetabolite due to glycolysis inhibition and to in situ formation of supramolecular net around spheroid surface where alkaline phosphatase is overexpressed. The efficiency of the treatment is higher in spheroids as compared to the conventional 2D cultures because of the 2-fold higher expression of glucose transporter 1 (GLUT1). Moreover, treated spheroids do not undergo following relapse.
Biocatalytic self-assembly (BSA) combines the selectivity of an enzymatic conversion with the sensitivity and the precision of the supramolecular self-assembly.1, 2 The approach has been applied to different pathologies, including cancers, where an overexpressed enzyme triggers in situ fiber formation by localized self-assembly leading to cell death or localized drug delivery through triggered disassembly of designed precursors.1–6 BSA efficiency and modus operandi are usually demonstrated in vitro using two-dimensional (2D) cell cultures.4, 7–9 While these cultures serve as suitable proof-of-concept model systems because of the high reproducibility and ease of handling, they do not recapitulate the complex tumor microenvironment: tumors are heterogeneous and complex organ-like structures, whose identity is dependent on the cell-to-cell contacts and alterations of the extracellular matrix.10, 11 These characteristics are particularly relevant in BSA, where proteins present at the cell membrane are used as a trigger of the self-assembly process.
Herein, we developed a 3D tumor model using HS578T human breast cancer cells and studied BSA of the phosphorylated carbohydrate amphiphile, N-fluorenylmethyloxycarbonyl-glucosamine-6-phosphate (1). This amphiphile can be transformed by alkaline phosphatase (ALP) overexpressed in some tumors, e.g. osteosarcoma, into the low molecular mass gelator N-fluorenylmethyloxycarbonyl-glucosamine (2) that self-assembles into a nanoscale network (Scheme 1c) which sequesters and efficiently kills cancer cells.4 Beyond the physical effect of creating a nanoscale network that acts as a barrier at the cell surface, there is also a specific chemical role for these glucose-based aromatic amphiphiles. The phosphorylated precursor 1 and its dephosphorylated analogue 2 contain a glucose moiety that interacts with glucose transporter 1 (GLUT1) (Scheme 1d), overexpressed in different cancers, thus, allowing double targeting, as we recently demonstrated.12
Scheme 1.
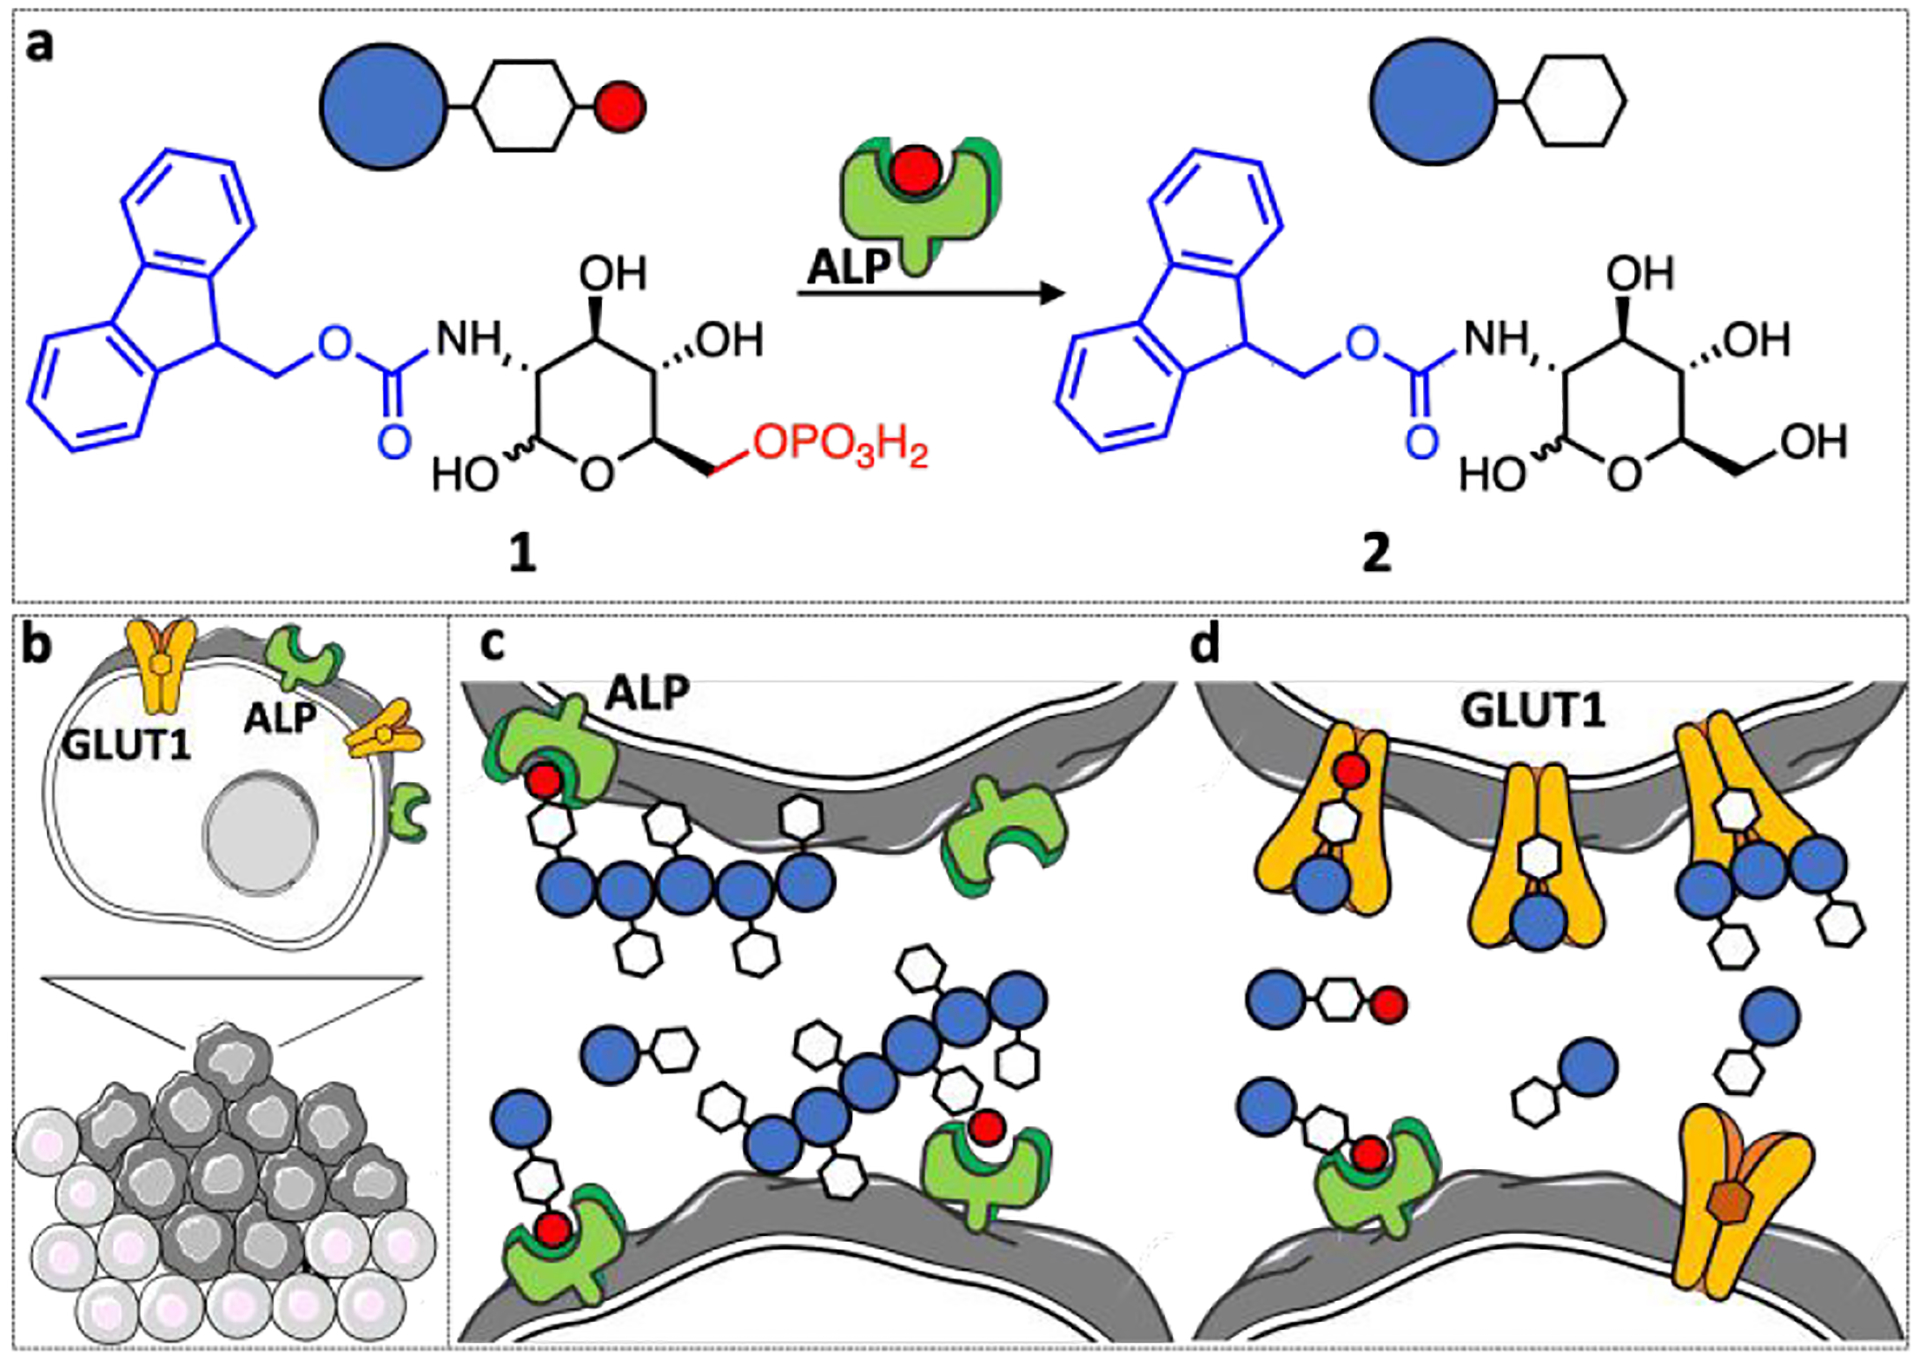
(a) Schematic presentation of the enzymatic transformation of the phosphorylated precursor 1 to carbohydrate amphiphile 2. (b-d) In tumors this transformation can trigger (c) self-assembly on the tumor surface and (d) blocking of the GLUT1 expressed by the proliferative cells on the tumor surface.
We have selected three cell lines for spheroid formation, namely SaOs2 osteosarcoma, HS578T breast and MCF7 breast cancer cells because they all overexpress ALP, GLUT1 and caveolin 1 (CAV1) (Figure S1).13 Our interests in GLUT1- and ALP-overexpressing cell lines is related to the affinity of compound 1 for those proteins: 1 can bind to GLUT1 because of the glucose moiety (Scheme 1d) and can be transformed in the self-assembling 2 upon ALP action (Scheme 1c).4, 12 In addition to GLUT1 and ALP, we also explored the contribution of CAV1 in carbohydrate amphiphile mediated BSA processes. CAV1 is the main structural protein of caveolae, the small pockets in the cell membrane that are known to modulate the glycolysis and to interact dynamically with ALP.14, 15
Formation of spheroids was studied by seeding the selected cell lines on agarose-coated well plates at different density (2,500–20,000 cells per well) and culture time (24 – 72 h).11 Among the tested cells, only HS578T cells formed spheroids in a highly reproducible manner (Figures S2 and S3): 24 h after seeding, HS578T cells gathered into unstable aggregates, which were easily disrupted by mechanical force (e.g. pipetting). After 48 h, we observed formation of compact and stable spheroids composed by a shell of viable cells (Figure 1a) surrounding a necrotic core (Figure 1b), which is typical for solid tumors.10 Further compacting and a significant reduction in the spheroid volume were observed in the following 24 h (Figure S3). We selected a cell density of 5,000 cells/well and 48 h of culture time for the spheroids’ formation.
Figure 1.
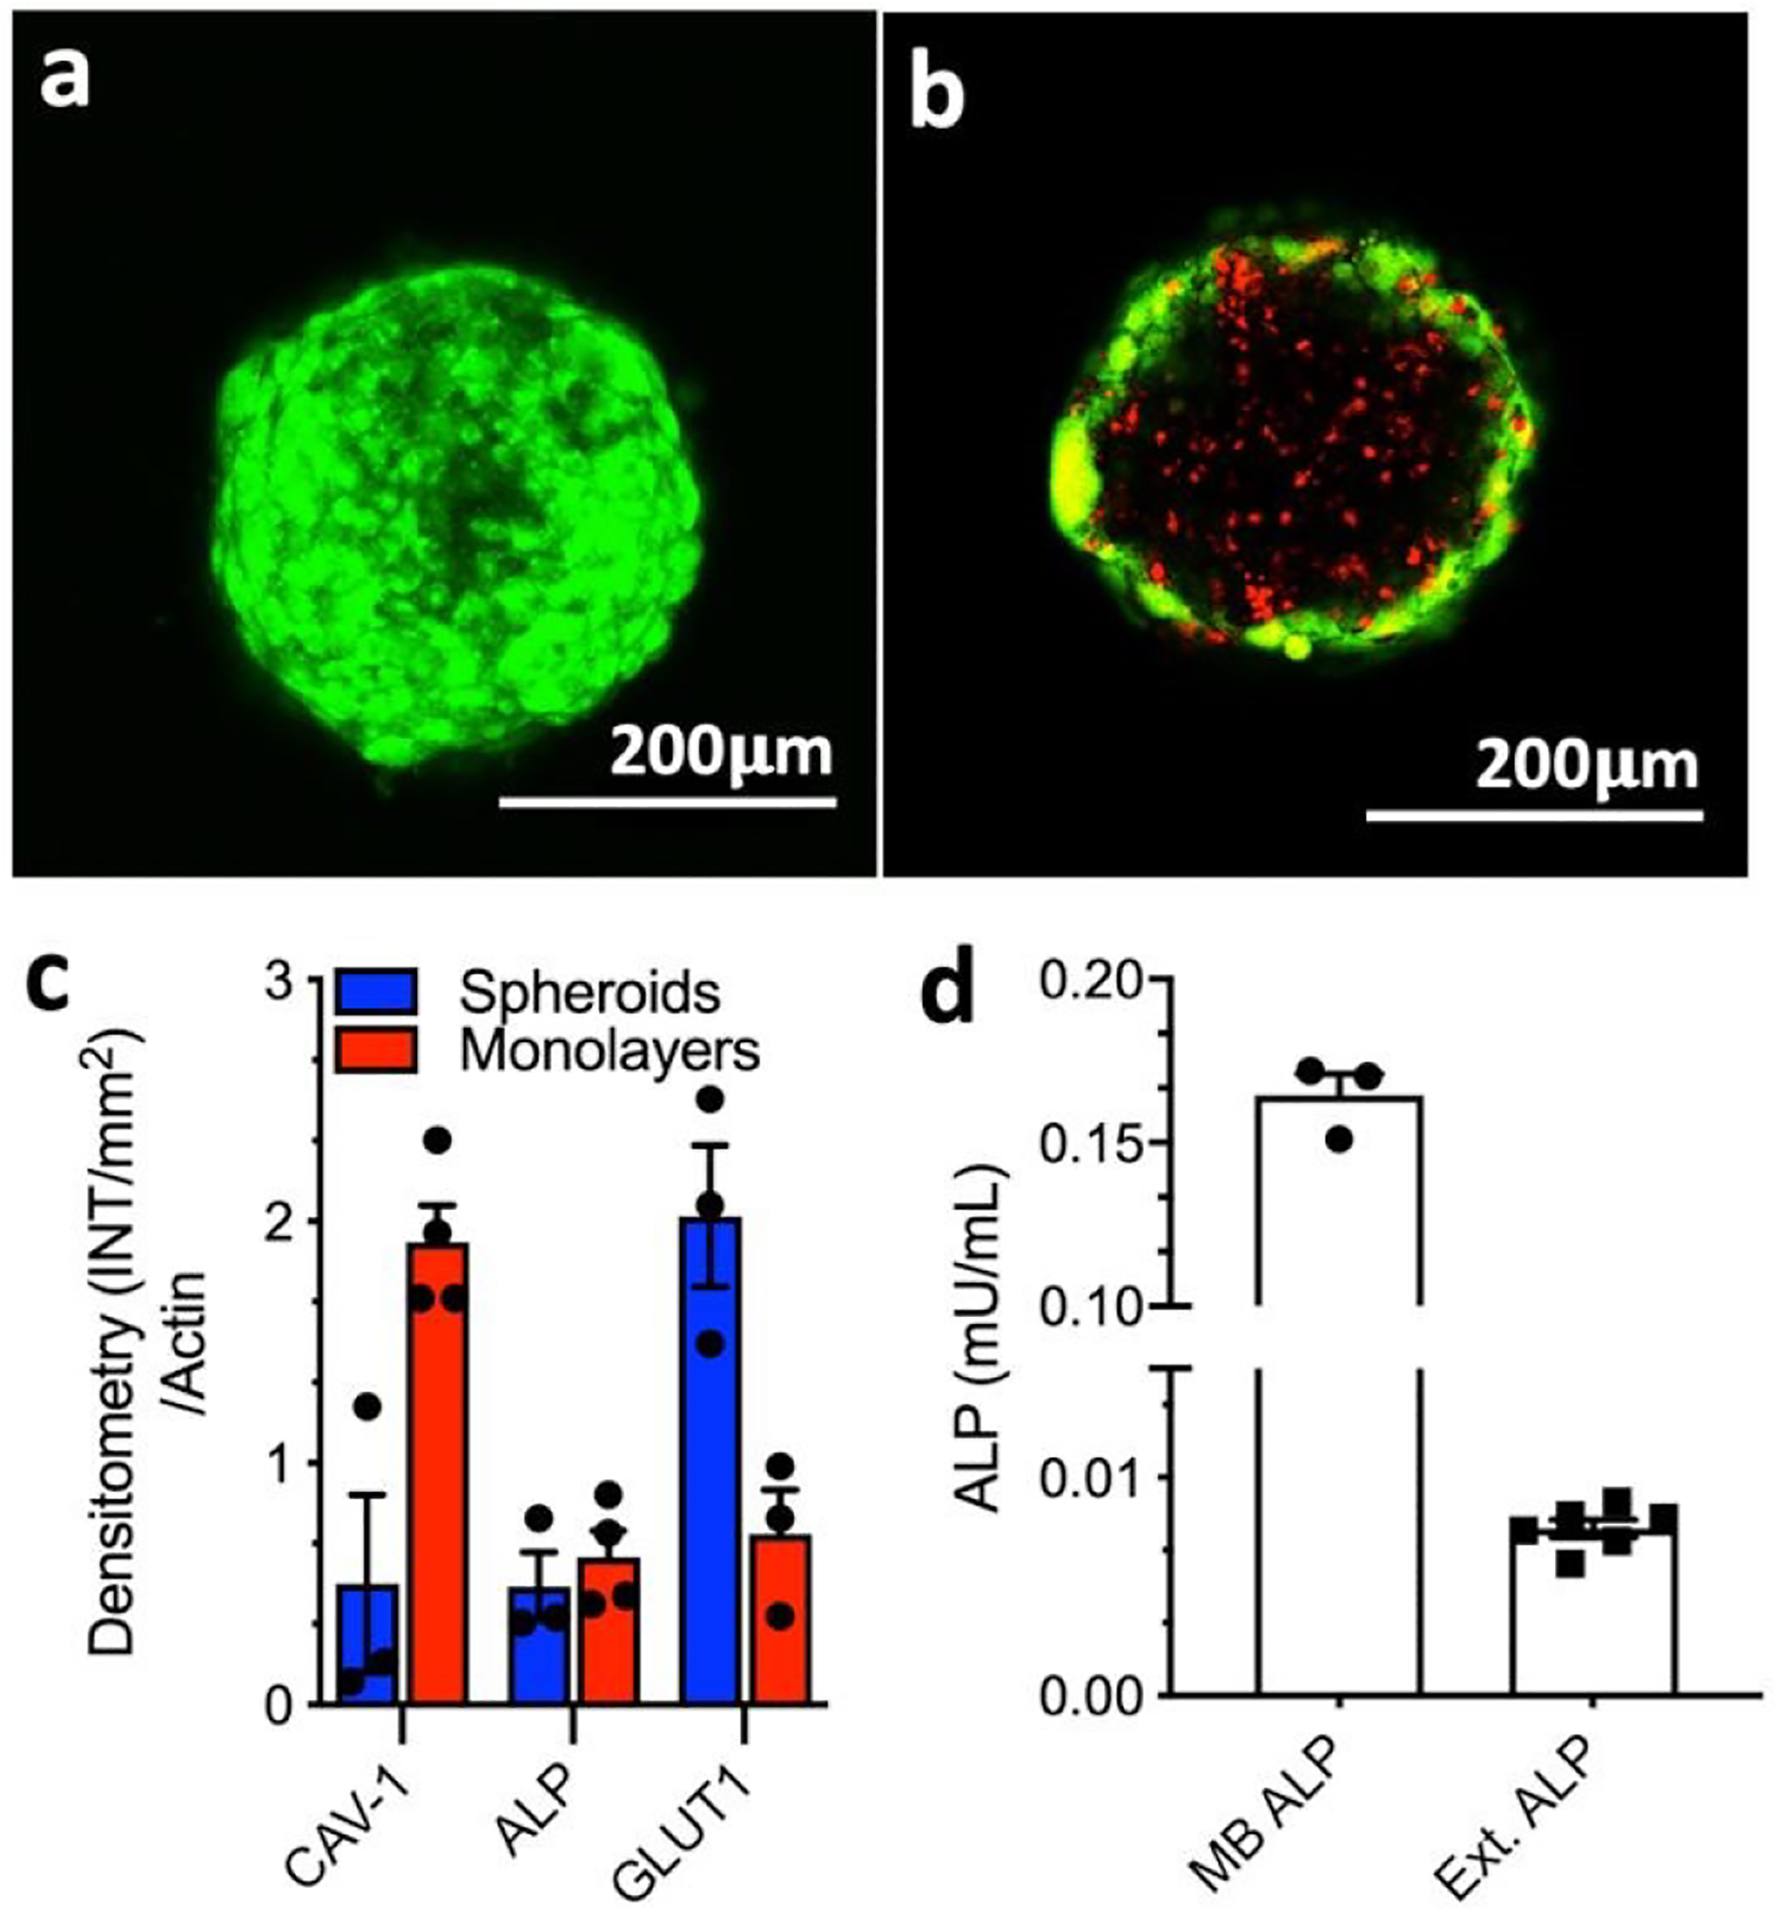
Characterization of the HS587T spheroids: Representative confocal microscopy images of (a) spheroid surface (whole spheroid projection) and (b) core (single focal plane/z-stack) stained for live (green, calcein AM) and dead (red, propidium iodide) cells; (c) Densitometry quantification of Western-Blot analysis of ALP, CAV1, and GLUT1 expression by the 3D spheroids and 2D cell culture, normalized to the total β-actin protein content; (d) expression of membrane-bound (MB) and extracellular (Ext.) ALP in spheroids.
The structure of the spheroids (proliferative and quiescent cellular compartments) evidenced gradual deprivation of nutrients and oxygen from the surface to the bulk of the 3D structure. Such gradient is distinctive for solid tumors and is associated with specific genetic and metabolic changes. As an example, cells in the core are adapting to an anaerobic metabolism and produce large amount of lactate used as a source of energy.16 This scenario is significantly different from 2D cultures where no competition for nutrients and oxygen exist and the population is homogeneous.
The comparison between HS578T monolayers and spheroids showed that both cultures expressed ALP, GLUT1 and CAV1 proteins (Figures 1c and S1): ALP expression in spheroids was similar to that found in monolayers but both GLUT1 and CAV1 expression were found to be substantially different from that obtained for the 2D cell culture. In accordance with previous studies, we detected 3-fold lower CAV1 expression in spheroids when compared with monolayers.17 On the other hand, a 2-fold increase in GLUT1 expression was observed when cells were cultured in spheroids. GLUT1 expression in spheroids and solid tumors is commonly higher than in the respective 2D cultures.11, 18–20 This overexpression is associated with the survival mechanism(s) activated by the cells in the hostile tumor environment and correlates with aggressive, metastatic behavior.18, 19 GLUT1 is therefore both prognostic marker and therapeutic target.21–23
Among the heterogenous cell populations within the tumors, the proliferative cells on the surface are unique because they sustain the structure growth and provide an interface between the tumor and its environment. Thus, spatiotemporal targeting of these surface cells at their proliferative phase provides a very efficient mean of isolating and destroying the tumors. The high energy demands of cancer cells especially during their proliferation instruct accelerated metabolism associated with high glucose consumption/dependence and overexpression of GLUT1 (Warburg effect).18, 24, 25 Therefore, we expected that the GLUT1 antagonist 1 will decelerate their metabolism crucial for tumor maintenance.12, 21, 22 On the other hand, these surface cells are not adapted to an anaerobic metabolism and the formation of ALP catalyzed BSA nanostructured network around the tumor will affect them further by deprivation of nutrients and oxygen.2, 4, 26
The addition of 1 to the spheroids resulted in their partial disintegration in a concentration and time-dependent manner (Figures 2 and S4): the effect of 1 on the spheroid morphology was visible after 48 h when 0.5 mM concentration was used and this time was shortened to 24 h upon a concentration increase to 1 mM. A closer look at the spheroids revealed the formation of a nanofibrous coating on the surface of the samples treated for 48 h, suggesting the occurrence of in situ BSA (Figures 2f and S8). These nanostructures were absent in the control sample. Previously, we have observed a similar effect in 2D cultures of ALP overexpressing osteosarcomas SaOs2 that showed reduced metabolic activity at shorter culture time (1–7 h), which caused cell death at longer exposure (≥ 24 h) to 1.4
Figure 2.
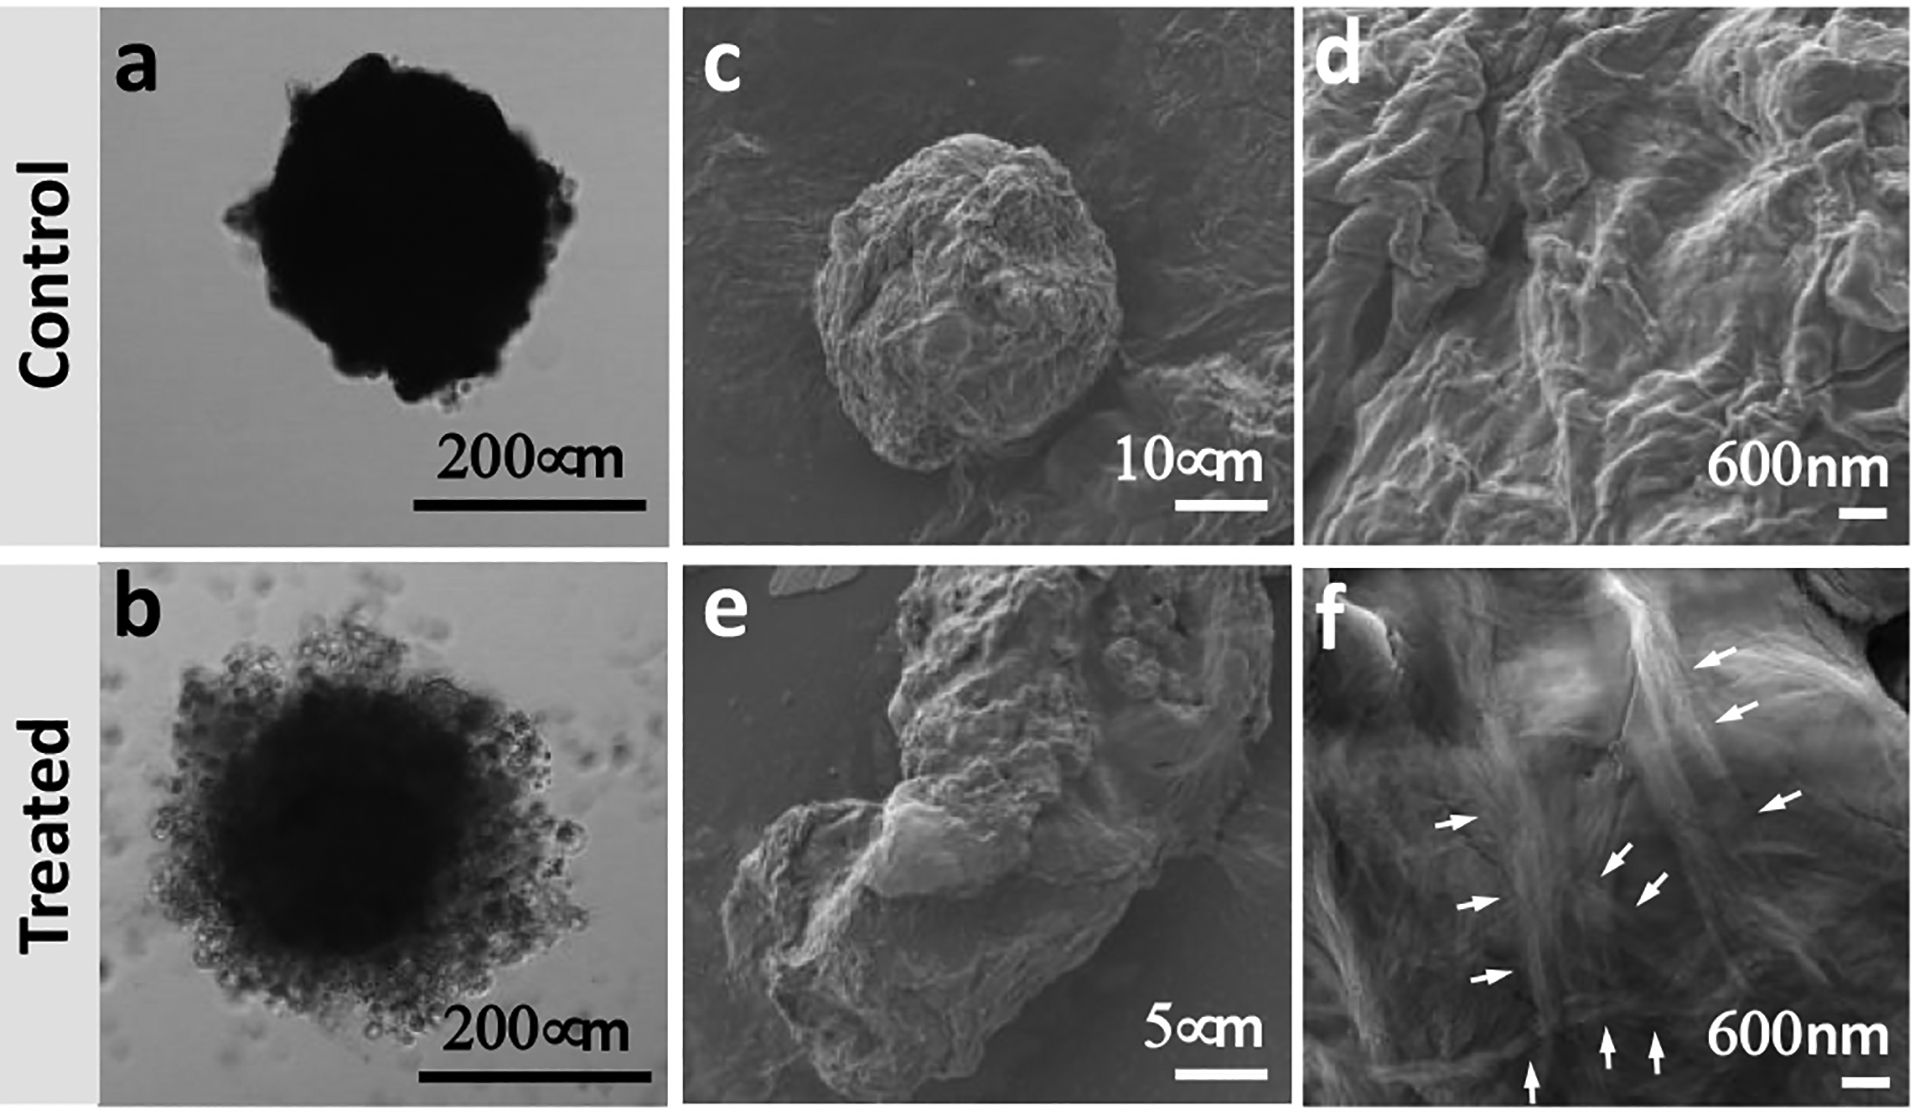
Effect of 1 on spheroid integrity and morphology: Representative (a, b) confocal microscopy and (c-f) high-resolution scanning electron microscopy images of untreated spheroids (control) and spheroids treated with 1 (1 mM, 48 h). White arrows indicate different fibers bundles.
The morphological differences observed for the spheroids were accompanied by an increased release of lactate dehydrogenase (LDH) in the extracellular milieu of the treated samples (Figure 3a). This increase indicates compromised or damaged plasma membrane and is commonly used as a marker of necrotic cell death.27 Indeed, histological staining of the spheroids with hematoxylin and eosin showed typical necrotic areas formed by cells without nuclei (Figure 3e, yellow circlers).28 Live/dead staining also corroborated a significant increment of cell death in spheroids treated with 1 (Figure 3d).
Figure 3.
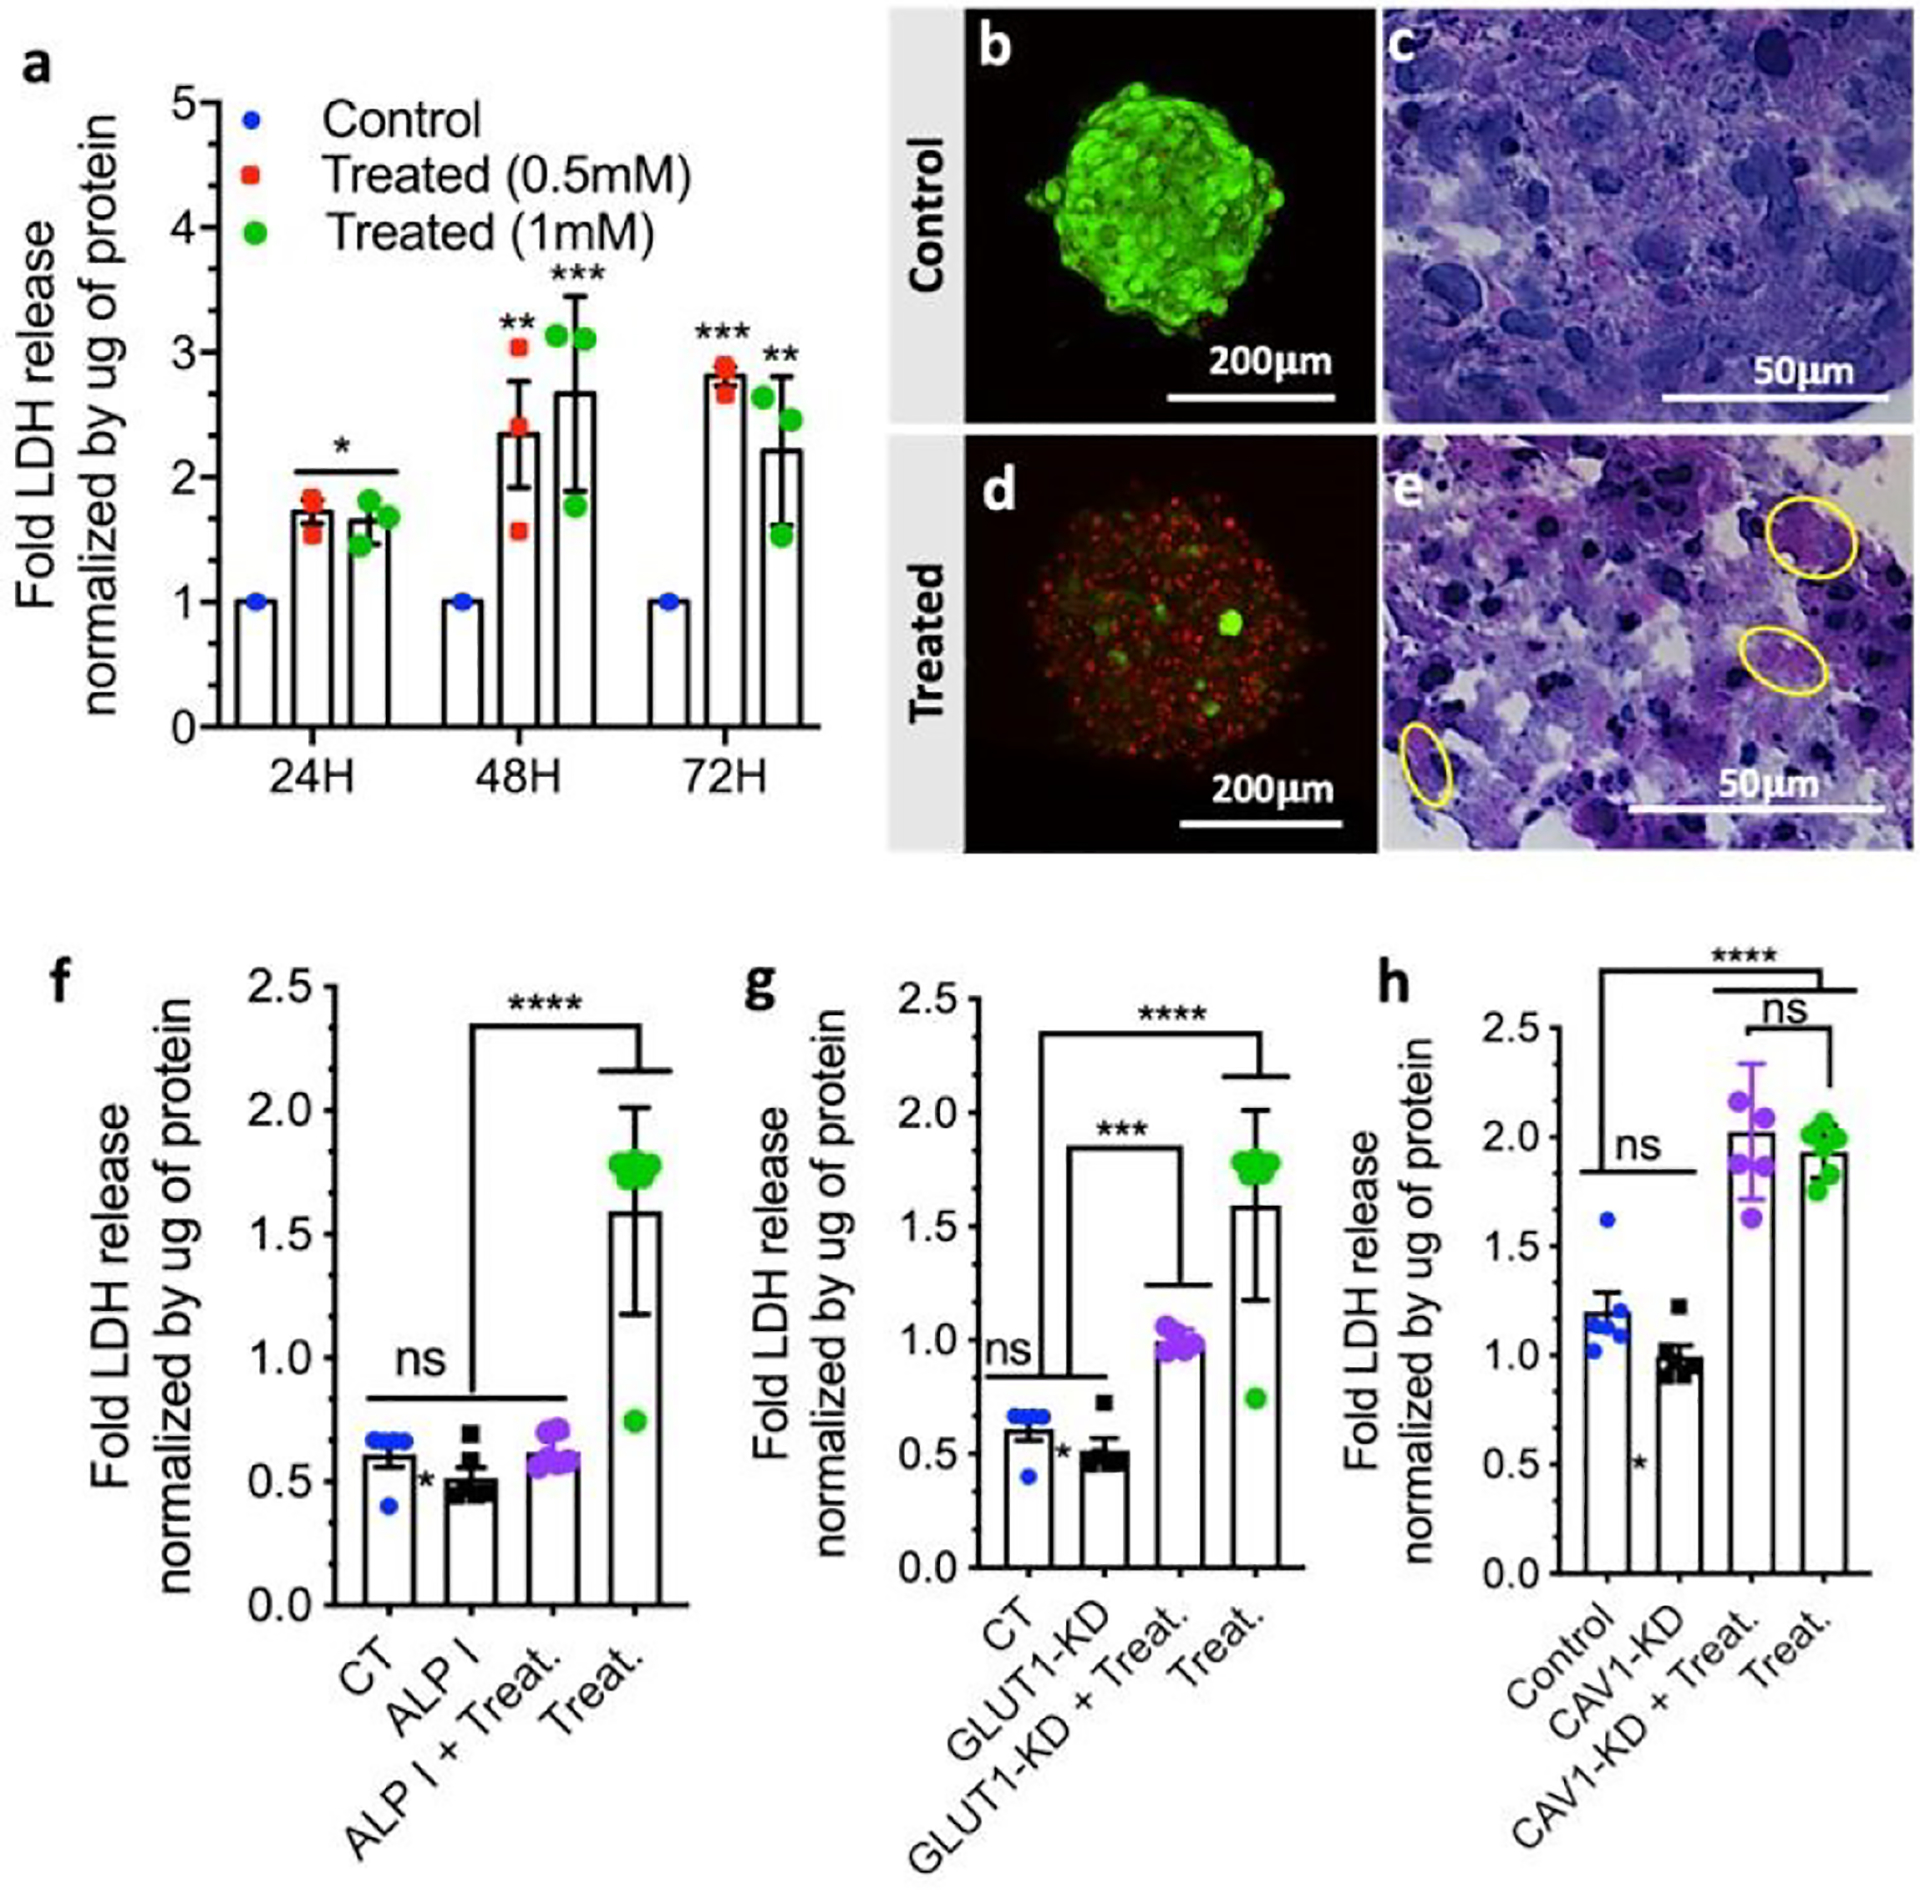
Effect of 1 on cell viability in HS578T spheroids: (a) Normalized LDH release as a function of time and concentration of 1; (b-e) Cell death shown by microscopy images after (b, d) live/dead (projection of the whole spheroid) and (c, e) hematoxylin/eosin staining. LDH release of HS578T spheroids as a function of (f) ALP inhibition (I), (g) GLUT1 and (h) CAV1 knockdown (KD). The applied treatment (Treat.) was spheroid exposition to 1 (1 mM, 48 h). Statistics: ns (non-significant); * p < 0.01; ** p < 0.005; *** p < 0.001; **** p < 0.0001.
Confirmation of BSA involvement in cell death was done by quantification and inhibition of ALP that triggers the self-assembly process. We quantified both membrane-bound and extracellular ALP in the spheroids and found 20-fold higher values for the former form (Figure 1d), suggesting its involvement in the BSA. Immunolocalization of membrane-bound ALP confirmed this result: the presence of 1 increased the expression of ALP on the cell surface (Figure S5). We then studied the inhibition of ALP using pierce phosphatase inhibitor.4 The addition of the inhibitor rescued the cells and the spheroids had a similar shape and cell viability when compared to the control spheroids (Figure 3f), manifesting a direct relationship between the ALP activity and the cytotoxicity of 1.
Glycolysis deprivation via blockage of GLUT1 by 1 and 2 was also studied as an additional contributor to cell death.12 As noted, spheroids have a higher expression of GLUT1 as compared to the 2D cell culture (Figure 1c). We knocked down GLUT1 expression in the spheroids by transfection with three target-specific siRNAs (Figure S6). Exposure of the transfected spheroids to 1 led to a reduction of the of LDH release, i.e. a significant decrease in the cytotoxicity of 1 (Figure 3g). This result confirms that 1 and/or its dephosphorylated analog 2 interact with GLUT1 and the observed cytotoxicity is also mediated by this interaction.
Because ALP is present within caveolae and CAV1 is involved in glycolysis,14 we also investigated possible interactions between this protein and 1 in the spheroids (Figure S5). CAV1 protein was knocked down29 (Figure S6) but its depletion did not affect the toxicity of 1 (Figure 3h), showing no direct participation of CAV1 in the necrotic pathway. Similar results (not shown) were obtained for 2D cultures with higher expression of CAV1.
A comparison of the effect of 1 on spheroids (Figure 3) and 2D cell culture (Figure S7) showed important differences: while cell death in 2D culture increases with increment of both the concentration of 1 and the treatment time, in the 3D spheroids we observed a maximum effect of 1 at lower concentration (i.e. 0.5 mM) and shorter treatment time (48 h). Further increase of the concentration of 1 (i.e. to 1 mM) or extension of the treatment timeframe (72 h) did not induce additional cell death in the spheroids. This result indicates that either there is a higher sensitivity of the spheroids to 1 or there is an inefficiency of the treatment at the studied conditions.
We, therefore, studied the possibility of recovery of the remaining live cells within the treated spheroid as a forecast of clinical scenario known as a relapse. Cancer recurrence and tumor relapse (usually in a more resistant form) caused by resistant cells within the tumors is one of the major hurdles in the development of efficient anti-cancer therapies. We re-plated the treated spheroid in an adherent well plate and confirmed that the cells were not able to recover from the effect of 1, supporting the efficacy of the treatment (Figure 4d). When untreated spheroid was re-plated, we observed formation of a dense spheroid (Figure 4c). Because ALP expression is similar for 2D cultures and 3D spheroids (Figure 1c), we suggest that the observed higher sensitivity of the 3D tumor model to 1 is due to the GLUT1 overexpression in spheroids. Thus, the use of the GLUT1 antagonist 1 as a substrate in a BSA anticancer therapeutic approach has two advantages. The first one is the enhanced efficacy: the high malignant potential of resistant cells is related to their ability to self-renew and form prone differentiated progeny that compose the bulk of the relapsed tumor - an energy-demanding process that depends on glucose uptake. In the presence of 1, some of these cells can survive, but their proliferative potential is significantly reduced due to the GLUT1 inhibition and deprivation of the glucose uptake. The second advantage is the selectivity: the overexpression of GLUT1 in solid tumors, and especially cells located at the surface makes it suitable target for a selective therapy.
Figure 4.
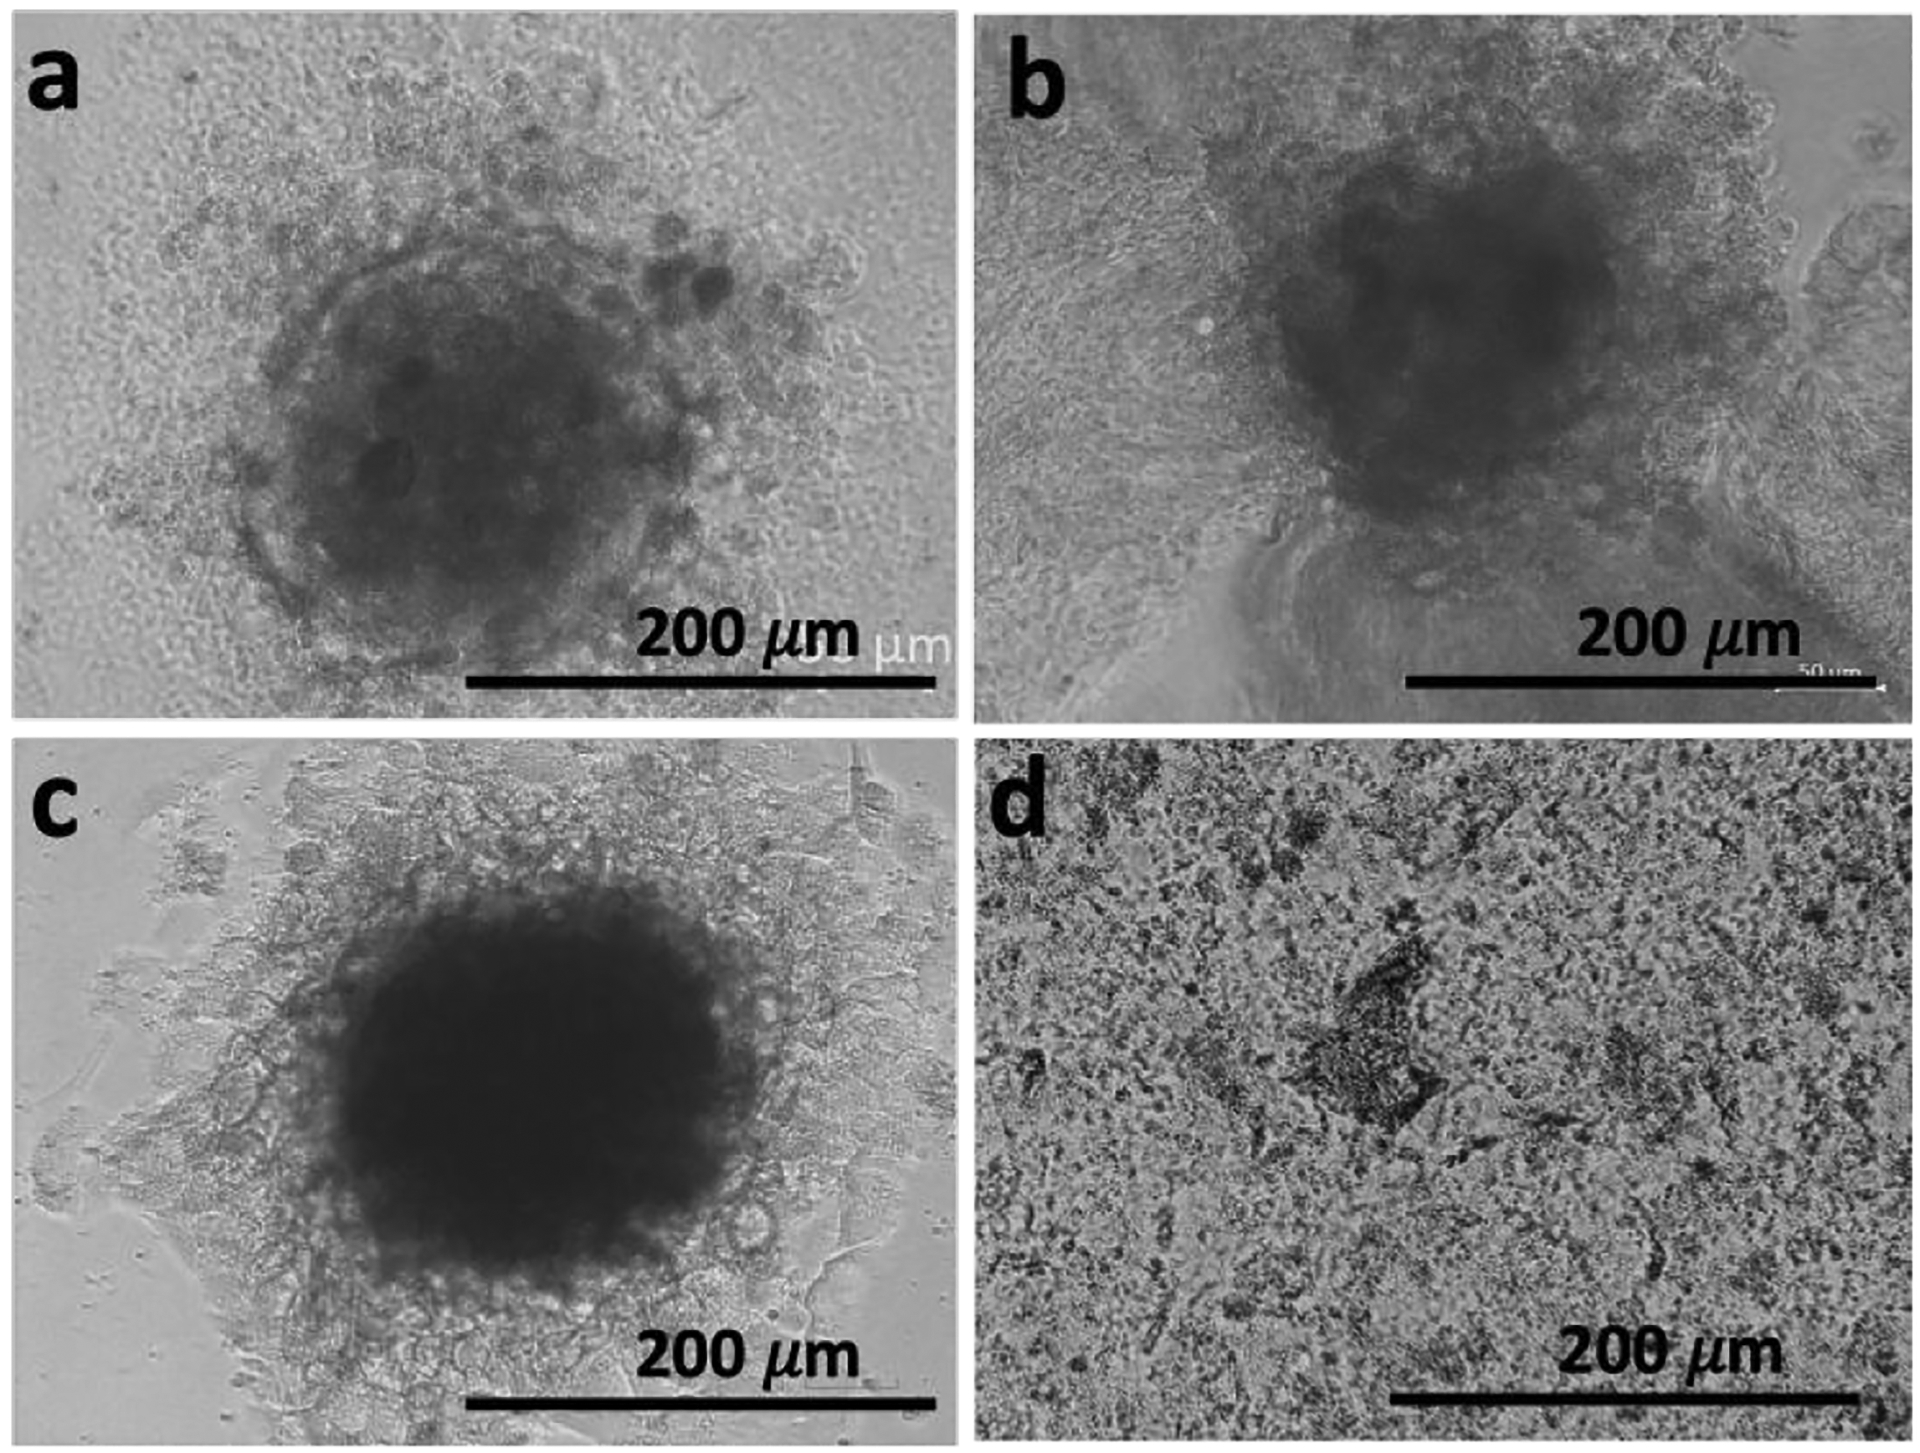
Spheroid relapse shown by replating the spheroids: representative transmitted-light microscope images of (a) untreated spheroid (control) and (b) spheroid exposed to 1 (1 mM, 48 h) that were re-plated (c control and d treated) in adherent well plates for 48 h.
In summary, we demonstrated that variable expression levels of the same proteins in 3D tumor models and 2D cell cultures can render dramatically different sensitivity to chemotherapies. We validated this observation by using carbohydrate amphiphile 1 that participates simultaneously in two processes that are sensitive to the surface expression of two proteins, namely BSA triggered by membrane-bound ALP and glycolysis inhibition by blockage of GLUT1. Our data show that the combination of supramolecular chemistry with the manipulation of vital biochemical cascades is feasible approach to achieve efficient cancer therapies.
Supplementary Material
Acknowledgements
This work was supported by the EU’s H2020 program (Forecast 668983), the Portuguese Foundation for Science and Technology (grants BD/113794/2015; PTDC/NAN-MAT/28468/2017 and PTDC/BTM-MAT/28327/2017), the US Army Research Laboratory and US Army Research Office (contract/grant W911NF-16-1-0113), NSF (grant 1808143), and the research infrastructure support of the NSF CREST Center IDEALS (grant 1547830). AB thanks to the Portuguese league against cancer for her fellowship. The authors also acknowledge the Radiochemistry and Molecular Imaging Probe Core which was supported by NIH grant P30 CA08748. This study was supported in part NIH NCI R35 CA232130 (to J.S. Lewis). P.M.R. Pereira acknowledges the Tow Foundation Postdoctoral Fellowship from the MSKCC Center for Molecular Imaging and Nanotechnology. The authors also acknowledge members of the MSKCC Radiochemistry and Molecular Imaging Probe Core and the Alan and Sandra Gerry Metastasis and Tumor Ecosystems Center of MSKCC. We also would like to acknowledge Komal Mandleywala for her help in the preparation of spheroid slides for immunocytochemistry.
Footnotes
Conflicts of interest
There are no conflicts to declare.
Electronic Supplementary Information (ESI) available: [details of any supplementary information available should be included here]. See DOI: 10.1039/x0xx00000x
References
- 1.Pires RA, Abul-Haija YM, Reis RL, Ulijn RV and Pashkuleva I, in Hydrogels: Design, Synthesis and Application in Drug Delivery and Regenerative Medicine, eds. Singh TRR, Laverty G and Donnelly R, CRC Press, 2018, ch. 10, pp. 170–183. [Google Scholar]
- 2.Kim BJ and Xu B, Bioconjugate Chem, 2020, 31, 492–500. [DOI] [PMC free article] [PubMed] [Google Scholar]
- 3.Anderson CF and Cui HG, Ind Eng Chem Res, 2017, 56, 5761–5777. [DOI] [PMC free article] [PubMed] [Google Scholar]
- 4.Pires RA, Abul-Haija YM, Costa DS, Novoa-Carballal R, Reis RL, Ulijn RV and Pashkuleva I, J Am Chem Soc, 2015, 137, 576–579. [DOI] [PubMed] [Google Scholar]
- 5.Zhou J and Xu B, Bioconjugate Chem, 2015, 26, 987–999. [DOI] [PMC free article] [PubMed] [Google Scholar]
- 6.Wang HM, Feng ZQQand Xu B, Chem Soc Rev, 2017, 46, 2421–2436. [DOI] [PMC free article] [PubMed] [Google Scholar]
- 7.Li J, Bullara D, Du X, He H, Sofou S, Kevrekidis IG, Epstein IR and Xu B, ACS Nano, 2018, 12, 3804–3815. [DOI] [PMC free article] [PubMed] [Google Scholar]
- 8.Zhou J, Du X, Yamagata N and Xu B, J Am Chem Soc, 2016, 138, 3813–3823. [DOI] [PMC free article] [PubMed] [Google Scholar]
- 9.Zhou ZQ, Xie X, Yi QK, Yin WC, Kadi AA, Li JB and Zhang Y, Org Biomol Chem, 2017, 15, 6892–6895. [DOI] [PubMed] [Google Scholar]
- 10.Duval K, Grover H, Han LH, Mou Y, Pegoraro AF, Fredberg J and Chen Z, Physiology, 2017, 32, 266–277. [DOI] [PMC free article] [PubMed] [Google Scholar] [Research Misconduct Found]
- 11.Pereira PMR, Berisha N, Bhupathiraju N, Fernandes R, Tome JPC and Drain CM, Plos One, 2017, 12. [DOI] [PMC free article] [PubMed] [Google Scholar]
- 12.Brito A, Pereira PMR, Soares da Costa D, Reis RL, Ulijn RV, Lewis JS, Pires RA and Pashkuleva I, Chem Sci, 2020, 11, 3737–3744. [DOI] [PMC free article] [PubMed] [Google Scholar]
- 13.Barretina J, Caponigro G, Stransky N, Venkatesan K, Margolin AA, Kim S, Wilson CJ, Lehar J, Kryukov GV, Sonkin D, Reddy A, Liu MW, Murray L, Berger MF, Monahan JE, Morais P, Meltzer J, Korejwa A, Jane-Valbuena J, Mapa FA, Thibault J, Bric-Furlong E, Raman P, Shipway A, Engels IH, Cheng J, Yu GYK, Yu JJ, Aspesi P, de Silva M, Jagtap K, Jones MD, Wang L, Hatton C, Palescandolo E, Gupta S, Mahan S, Sougnez C, Onofrio RC, Liefeld T, MacConaill L, Winckler W, Reich M, Li NX, Mesirov JP, Gabriel SB, Getz G, Ardlie K, Chan V, Myer VE, Weber BL, Porter J, Warmuth M, Finan P, Harris JL, Meyerson M, Golub TR, Morrissey MP, Sellers WR, Schlegel R and Garraway LA, Nature, 2012, 483, 603–607. [DOI] [PMC free article] [PubMed] [Google Scholar]
- 14.Nwosu ZC, Ebert MP, Dooley S and Meyer C, Mol Cancer, 2016, 15, 71. [DOI] [PMC free article] [PubMed] [Google Scholar]
- 15.Anderson RGW, Annu Rev Biochem, 1998, 67, 199–225. [DOI] [PubMed] [Google Scholar]
- 16.Fasano A, in New Challenges for Cancer Systems Biomedicine, eds. Donofrio A, Cerrai Pand Gandolfi A, 2012, vol. 1, pp. 173–190. [Google Scholar]
- 17.Warnke E, Pietsch J, Wehland M, Bauer J, Infanger M, Gorog M, Hemmersbach R, Braun M, Ma X, Sahana J and Grimm D, Cell Commun Signaling, 2014, 12, 32. [DOI] [PMC free article] [PubMed] [Google Scholar]
- 18.Amann T, Maegdefrau U, Hartmann A, Agaimy A, Marienhagen J, Weiss TS, Stoeltzing O, Warnecke C, Scholmerich J, Oefner PJ, Kreutz M, Bosserhoff AK and Hellerbrand C, Am J Pathol, 2009, 174, 1544–1552. [DOI] [PMC free article] [PubMed] [Google Scholar]
- 19.Osthus RC, Shim H, Kim S, Li Q, Reddy R, Mukherjee M, Xu Y, Wonsey D, Lee LA and Dang CV, J Biol Chem, 2000, 275, 21797–21800. [DOI] [PubMed] [Google Scholar]
- 20.Longati P, Jia XH, Eimer J, Wagman A, Witt MR, Rehnmark S, Verbeke C, Toftgard R, Lohr M and Heuchel RL, Bmc Cancer, 2013, 13, 95. [DOI] [PMC free article] [PubMed] [Google Scholar]
- 21.Chan DA, Sutphin PD, Nguyen P, Turcotte S, Lai EW, Banh A, Reynolds GE, Chi JT, Wu J, Solow-Cordero DE, Bonnet M, Flanagan JU, Bouley DM, Graves EE, Denny WA, Hay MP and Giaccia AJ, Sci Transl Med, 2011, 3, 94ra70. [DOI] [PMC free article] [PubMed] [Google Scholar]
- 22.Granchi C, Fortunato S and Minutolo F, Medchemcomm, 2016, 7, 1716–1729. [DOI] [PMC free article] [PubMed] [Google Scholar]
- 23.Hay N, Nat Rev Cancer, 2016, 16, 635–649. [DOI] [PMC free article] [PubMed] [Google Scholar]
- 24.Hsu PP and Sabatini DM, Cell, 2008, 134, 703–707. [DOI] [PubMed] [Google Scholar]
- 25.Heiden MGV, Cantley LC and Thompson CB, Science, 2009, 324, 1029–1033. [DOI] [PMC free article] [PubMed] [Google Scholar]
- 26.Kuang Y, Shi JF, Li J, Yuan D, Alberti KA, Xu QB and Xu B, Angew Chem Int Edit, 2014, 53, 8104–8107. [DOI] [PMC free article] [PubMed] [Google Scholar]
- 27.Chan FK, Moriwaki K and De Rosa MJ, Methods Mol Biol, 2013, 979, 65–70. [DOI] [PMC free article] [PubMed] [Google Scholar]
- 28.Gamrekelashvili J, Kruger C, von Wasielewski R, Hoffmann M, Huster KM, Busch DH, Manns MP, Korangy F and Greten TF, J Immunol, 2007, 178, 1573–1580. [DOI] [PubMed] [Google Scholar]
- 29.Pereira PMR, Sharma SK, Carter LM, Edwards KJ, Pourat J, Ragupathi A, Janjigian YY, Durack JC and Lewis JS, Nat Commun, 2018, 9, 5137. [DOI] [PMC free article] [PubMed] [Google Scholar]
Associated Data
This section collects any data citations, data availability statements, or supplementary materials included in this article.


