Abstract
Distal enhancers play pivotal roles in development and disease yet remain one of the least understood regulatory elements. We used massively parallel reporter assays to perform functional comparisons of two leading enhancer models and find that gene-distal transcription start sites (TSSs) are robust predictors of active enhancers with higher resolution than histone modifications. We show active enhancer units are precisely delineated by active TSSs, validate that these boundaries are sufficient for capturing enhancer function, and confirm that core promoter sequences are necessary for this activity. We assay adjacent enhancers and find that their joint activity is often driven by the stronger unit within the cluster. Finally, we validate these results through functional dissection of a distal enhancer cluster using CRISPR-Cas9 deletions. In summary, definition of high-resolution enhancer boundaries enables deconvolution of complex regulatory loci into modular units.
Introduction
Since their identification in viral and mammalian genomes, enhancers have been defined primarily by their function: the ability to activate promoters independently of their distance and orientation1–3. More basic questions about the nature of enhancer elements remain difficult to answer: what are the genomic features of active enhancers? How large are they? Classical examples such as the α- and β-globin locus control regions (LCRs) offer some clues: these LCRs are predominantly driven by 400-900 bp DNase I hypersensitive sites (DHSs) harboring transcription factor (TF) binding and extensive non-coding transcription4,5. Similar properties were also observed from all enhancers identified from a recent CRISPR-Cas9 screen of the MYC locus6. Histone modifications such as H3K27ac7 and H3K4me18 have been proposed to mark enhancers, although such predictors lack systematic comparison9–11. Similarly, genome annotation tools such as ChromHMM12 have been developed using histone modifications to generate enhancer predictions averaging 600 bp in size.
The finding that transcription from distal enhancers is widespread and corresponds with activation13,14 led to numerous hypotheses about roles and functions of non-coding “enhancer” RNAs (eRNAs). Many long non-coding RNAs (lncRNAs) were thought to facilitate gene-regulatory functions, but systematic introduction of premature polyadenylation signals into lncRNAs demonstrated that most of their RNA sequences are dispensable; instead, recruitment of transcription machinery drives their gene-regulatory activity15,16. Recently, a “molecular stirring” model has been proposed wherein transcription increases molecular motion to facilitate enhancer-promoter interactions17. Similarly, we have proposed that RNA Polymerase II’s (RNAPII) affinity for common co-factors or subunits might facilitate enhancer-promoter interactions18,19. This model is supported by reports that the C-terminal domain (CTD) of RNAPII specifies active promoter localization through its affinity for other CTDs20, as well as the low-complexity domain of Cyclin T121. If correct, these models suggest that transcription is required for distal enhancer function, challenging the commonplace methodology of using DHSs and histone marks to identify enhancers. Indeed, a large-scale study using capped analysis of gene expression (CAGE) data indicated eRNAs are more specific predictors of enhancer function than histone modifications22. However, CAGE fails to detect most eRNAs13 and therefore cannot be used to assess the important question of whether all active enhancers are transcribed23. If enhancer transcription could be shown to be a ubiquitous feature of functional enhancers, then this would imply a structural architecture within enhancer sequences that requires not only binding sites for sequence-specific TFs, but also well-positioned core promoter sequences for assembly of the pre-initiation complex24.
Numerous high-throughput sequencing methods identify enhancers using either plasmid or integrated reporter constructs and are collectively known as massively parallel reporter assays (MPRAs). While these assays offer unprecedented throughput for surveying genome function, their technical biases and limitations are a focus of ongoing research and optimization25–27. For example, most published MPRAs have been limited to short synthetic sequences (50-150 bp), despite the precise size of genomic enhancers remaining unknown11. The development of Self-Transcribing Active Regulatory Region sequencing (STARR-seq) circumvented this limitation with a simple cloning strategy to quantify genomic fragments as large as 1,500 bp by placing them into the 3’ untranslated region (3’UTR) of a reporter gene2. After transfecting cells with the reporter library, enhancers will drive their own RNA expression. Each candidate’s enhancer activity is then defined as the ratio of mRNA to plasmid DNA, as quantified by Illumina sequencing.
In this study, we perform systematic functional comparisons of histone marks to transcription initiation patterns that are frequently observed at enhancers. We find that transcription initiation is found at essentially all active distal enhancers and validate a basic unit model for enhancer sequences delineated by their TSSs. Finally, we survey dozens of genomic TSS clusters with distal enhancer activity and reveal that their activity is primarily driven by a single dominant subunit.
Results
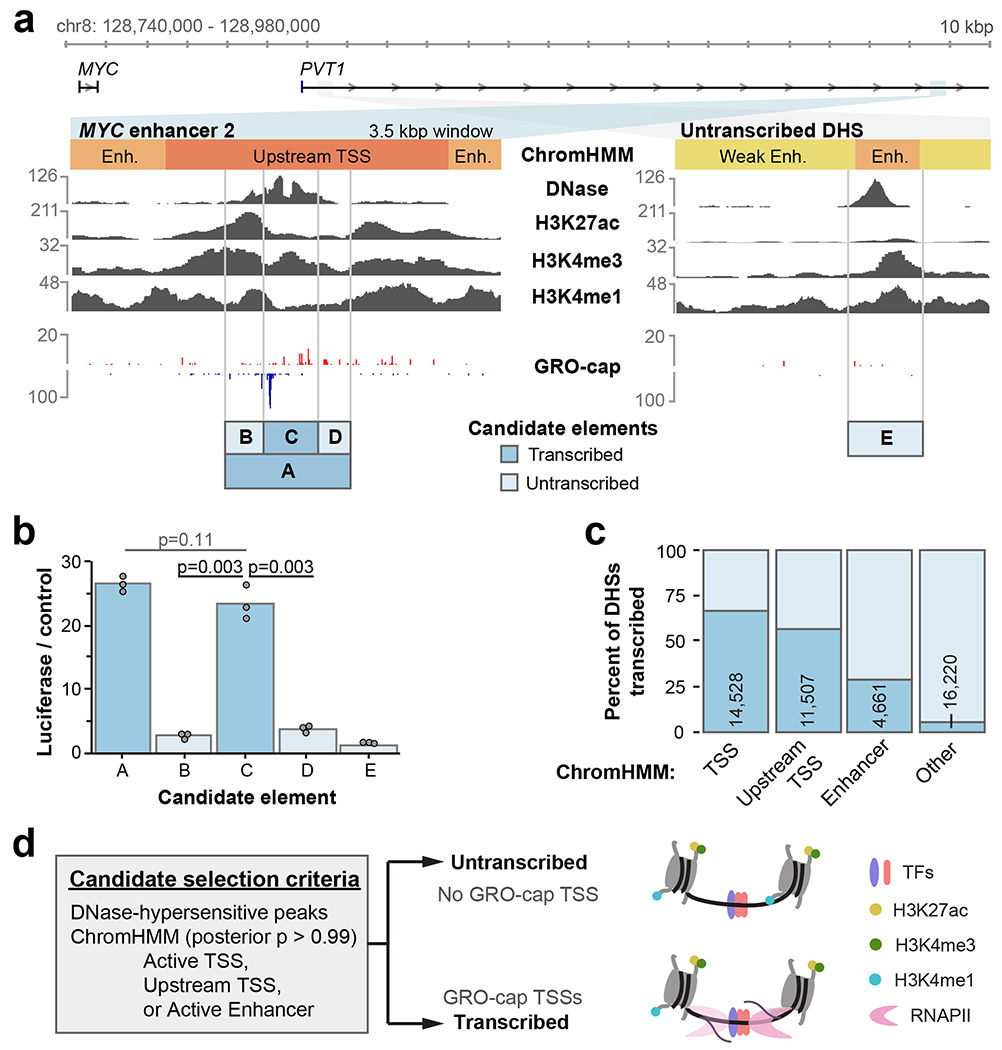
Seven MYC enhancers that were recently identified by CRISPR-Cas9 interference exhibit many conventional features of active enhancer architecture6. For example, MYC enhancer 2 (element A) is a DHS and contains elevated levels of H3K27ac and H3K4me3 (Fig. 1a). It also contains a single divergent TSS pair. To test features critical for enhancer function, we sub-cloned element C from the larger element A previously verified by luciferase assays, as well as flanking sequences (elements B & D) for comparison. Notably, element C harbored virtually all observed distal enhancer activity in luciferase assays (Fig. 1b). A nearby site with similar DNase hypersensitivity and histone modifications that does not exhibit divergent transcription (element E) did not show significant enhancer activity. This example illustrates how divergent transcription may help localize active enhancer boundaries with high resolution, and avoid ambiguities derived from lower-resolution DNase hypersensitivity and chromatin immunoprecipitation (ChIP) profiles.
Fig. 1. Divergent transcription identifies enhancer boundaries in high resolution.
a. Features of two candidate regulatory elements in the MYC locus. Raw read counts are shown for each track, and the “Candidate elements” track indicates cloning boundaries used for luciferase assays of tested sequences.
b. Luciferase reporter activity for the regions indicated in a (n = 3 luciferase reactions). P values are from one-sided t test.
c. The percent of DHSs within each indicated ChromHMM class that are untranscribed (no GRO-cap TSS) vs. transcribed (containing GRO-cap TSS). Number of transcribed DHSs are indicated.
d. A schematic of candidate element selection using DNase hypersensitivity, ChromHMM, and GRO-cap data. Molecular model illustrates DHSs sharing many features, with or without RNAPII transcription.
To generalize these results, we systematically sampled a larger set of candidate enhancers in K562 cells. This set was composed of DHSs from combinations of active ChromHMM classes12, and transcription initiation classes defined by Global Run-On Cap data13 (GRO-cap; see Methods). Notably, most DHSs do not contain a GRO-cap TSS (86%). However, DHSs from the Active Enhancer, Active TSS, and Upstream TSS ChromHMM classes are enriched for one or more GRO-cap TSSs (Fig. 1c). We compared enhancer activity of transcribed and untranscribed DHSs from only high-confidence examples of these ChromHMM classes (Fig. 1d). Selected candidates ranged from 180-300 bp in size (Extended Data Fig. 1a).
Divergent transcription marks active enhancer elements
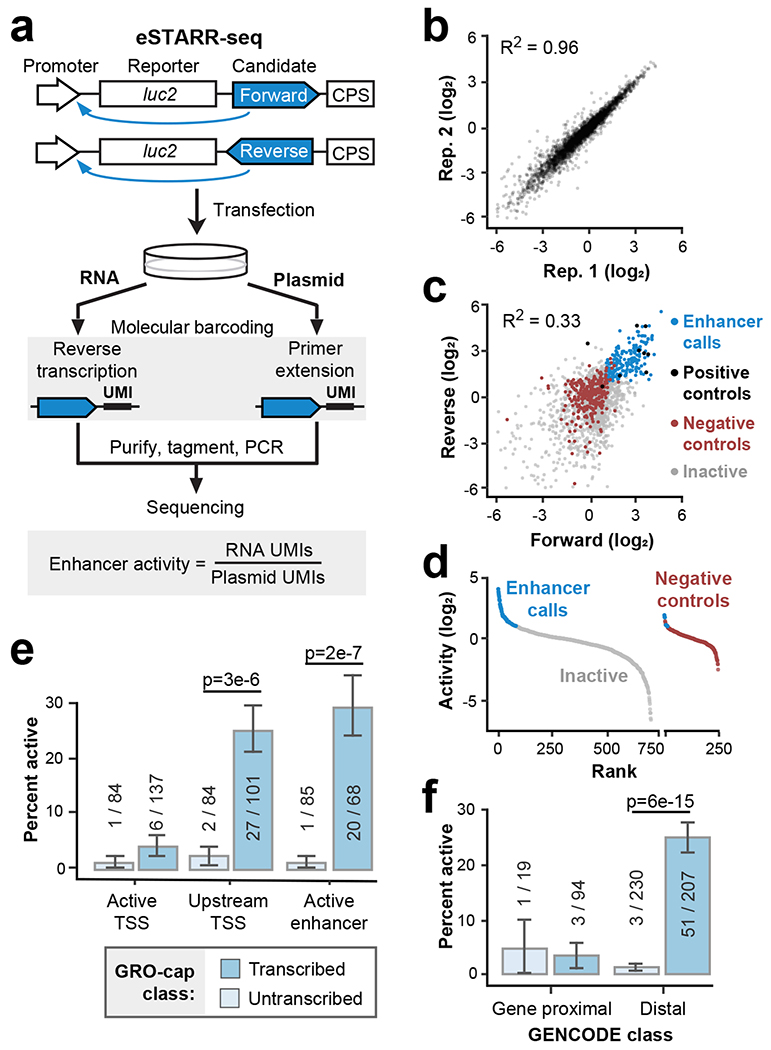
To test hundreds of candidate enhancer sequences across broad length scales, we adapted STARR-seq for use with sequence-verified candidate elements, which we call element-STARR-seq (eSTARR-seq; Fig. 2a, Extended Data Fig. 1b–c). We clone every candidate sequence in both forward and reverse orientations within the 3’UTR of the reporter gene to distinguish sequences that may regulate mRNA stability. We added unique molecular identifiers (UMIs, 12 nt) to the reverse transcription primer for removal of PCR duplicates, and tagmentation before Illumina sequencing to circumvent length limitations and minimize bias (Fig. 2a; Methods). As in other MPRAs, enhancer activity is quantified as the ratio of mRNA to transfected DNA (after de-duplication with UMIs). eSTARR-seq improves agreement with luciferase data compared with conventional STARR-seq (Extended Data Fig. 1b), likely because UMIs increase the dynamic range, and is highly reproducible from true biological replicates (Fig. 2b). We note that more recent human STARR-seq protocols may track luciferase more robustly26. Finally, we measure the relationship between fragment size and reporter activity (Extended Data Fig. 1c) using negative control sequences. We selected human open reading frames (ORFs) unlikely to destabilize mRNA or harbor distal enhancer activity as negative controls (Methods). In conclusion, eSTARR-seq enables robust quantification of enhancer activity while minimizing PCR, size, and orientation biases.
Fig. 2. Transcription marks active eSTARR-seq enhancers.
a. Outline of element-STARR-seq (eSTARR-seq). Each candidate is cloned into the 3’UTR of a reporter gene in forward or reverse orientations. After transfection, RNA and plasmids are purified separately. Addition of unique molecular identifiers (UMIs) occurs during reverse transcription for RNA, or primer extension for plasmids. After sequencing, enhancer activity is estimated by the ratio of RNA to plasmid UMIs. b. eSTARR-seq is highly reproducible between biological replicates. c. Comparison of activity from forward vs. reverse cloning orientations. Data points are shown as log2 fold-change vs. negative controls. Positive controls are known MYC or viral enhancers (black). Negative controls are human open reading frames (ORFs, red). Elements with significantly elevated activity in both orientations are called enhancers (blue). Remaining candidates are called inactive (gray). d. Summary of enhancer calls from c after averaging forward and reverse activities. Empirical false-discovery rate is 2.4% (6/243 negative controls misidentified as enhancers). e-f. Within each ChromHMM (e) or distance (f) class, the percent of active enhancers identified by eSTARR-seq is indicated. Protein-coding gene annotations are from GENCODE. Error bars indicate standard error calculated for a sample of binary trials, centered on the observed success rate. P values are from two-sided Fisher’s exact test.
Enhancer activity is known to be orientation-independent1,3, whereas mRNA stability is affected by strand-specific RNA sequences. Thus, we required candidates to exhibit significantly higher reporter activity than controls in both forward and reverse cloning orientations to be classified as an enhancer (Fig. 2c; Methods). Only 2.6% (6/243) of negative controls met these criteria, confirming very few false-positive enhancer calls (Fig. 2d).
Comparing transcribed and untranscribed DHS revealed that essentially all eSTARR-seq enhancers were found in transcribed DHSs, although rarely within the Active TSS class (Fig. 2e). Within the Upstream TSS and Active Enhancer ChromHMM classes, 25-30% of transcribed candidates exhibited significant enhancer activity. By contrast, only ~2% of untranscribed candidates exhibited significant enhancer activity, in line with the false-positive rate estimated from negative controls (2.6%, see Fig. 2d). Importantly, GRO-cap provides similar predictive performance without ChromHMM after using a 500 bp distance cut-off from GENCODE annotations to distinguish gene promoters from distal enhancers (Fig. 2f). We further confirmed these results with the standard STARR-seq promoter, the mammalian synthetic core promoter (SCP1; Extended Data Fig. 2). Our results strengthen previous associations between transcription and enhancer activity10,22,28,29, provide compelling evidence that essentially all active enhancers are transcribed, and suggest a functional role for transcription from active enhancers.
Transcription delineates regulatory sequence architecture
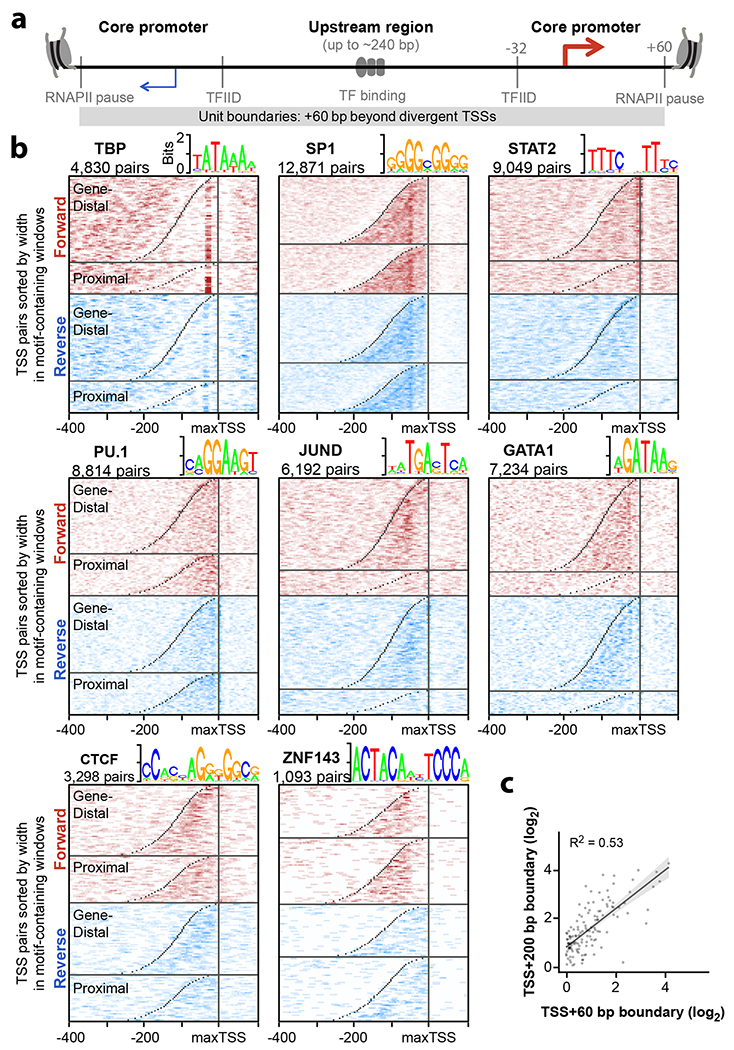
Given the striking co-occurrence of transcription initiation and active enhancer elements, we revisited the model that promoters and enhancers share a universal architecture13,30 (Fig. 3a). Classic studies defined minimal “core promoter” sequences that coordinate assembly of the pre-initiation complex; here, we define core promoters as beginning 32 bp upstream of the TSS (the location of TFIID binding to the TATA box motif when present) and ending at the RNAPII pause site (≤ 60 bp beyond the TSS19). Two distinct core promoters are found up to 240 bp apart (that is, 300 bp between TSSs) and may help position the −1 and +1 nucleosomes31. By contrast, the “upstream region” contains regulatory TF motifs that may activate one or both core promoters.
Fig. 3. Enhancer unit boundaries reveal sequence architecture.
a. Illustration of a unified model for regulatory sequence architecture of promoters and enhancers. Core promoter motifs (TBP, SP1, STAT2) surround an upstream region containing TF motifs. We define core promoters as the region from Transcription Factor II D (TFIID) binding 32 bp upstream of each TSS, to the RNAPII pause sites at +60 bp from each TSS. b. Divergent TSS pairs were sorted by width and aligned to the max TSS. TSS pairs were also divided by GENCODE class (Gene-distal vs. -proximal). Heatmaps indicate TF motif densities from pairs containing at least one motif within −400 to +100 bp of the maxTSS. Motifs are shown in both forward (red) and reverse (blue) orientations relative to the max TSS. TSS positions are marked in gray. c. Comparison of enhancer activities for the same set of elements using TSS + 60 bp and TSS + 200 bp cloning boundaries. Overlay shows linear regression with 95% confidence interval shaded gray (n = 93 candidate element pairs).
To illustrate similarities in architecture at both promoters and enhancers genome-wide, we plotted motif densities relative to the stronger TSS (or “maxTSS” from the pair) at both gene proximal and distal TSS pairs (Fig. 3b). Briefly, we sorted divergent TSS pairs by width, and computed motif densities around all pairs containing a motif from −400 to +100 bp from the maxTSS (see Methods). Interestingly, some motifs are well-aligned to TSSs, especially those known to recruit and position TFIID. Similar to the well-known TATA-box bound by TBP (max motif density at −32 bp), SP124 (at −53 bp), and STAT232 (−5 bp) show striking TSS alignment and are known to recruit TFIID. Systematic classification of core promoter sequences is particularly important since < 10% of human TSSs contain a TATA box, and recent reports demonstrate how core promoters respond differently to co-activators and distal enhancers24,33,34. However, most motifs appear dispersed throughout the “upstream region” between divergent TSSs, as illustrated by PU.1, JUND and GATA1 (Fig. 3b). By contrast, CTCF and ZNF143 motifs are found near the weaker TSS. Notably, CTCF and ZNF143 have been implicated in facilitating distal loop interactions, reinforcing the idea that similar motif alignments identify similar regulatory roles. Whereas ChIP-seq analyses can only reveal central and core promoter binding TFs13, sequence motif analyses reveal more nuanced spatial preferences within these elements35.
We re-tested a subset of elements after adding sequence context on each side to test whether core promoter boundaries are sufficient to capture enhancer activity (TSS + 60 bp vs. TSS + 200 bp). Importantly, adding sequence context affected enhancer activity less than testing identical fragments in differing orientations (Fig. 3c R2 = 0.53 compared with Fig. 2c R2 = 0.33). This indicates enhancer activity appears to be generally captured with sequences extending 60 bp beyond divergent TSSs, thus providing a basic unit definition of enhancers. In summary, we validate a boundary definition of individual enhancer units and reveal motif alignments that might help decipher regulatory function34–36.
Enhancers require core promoters for activity
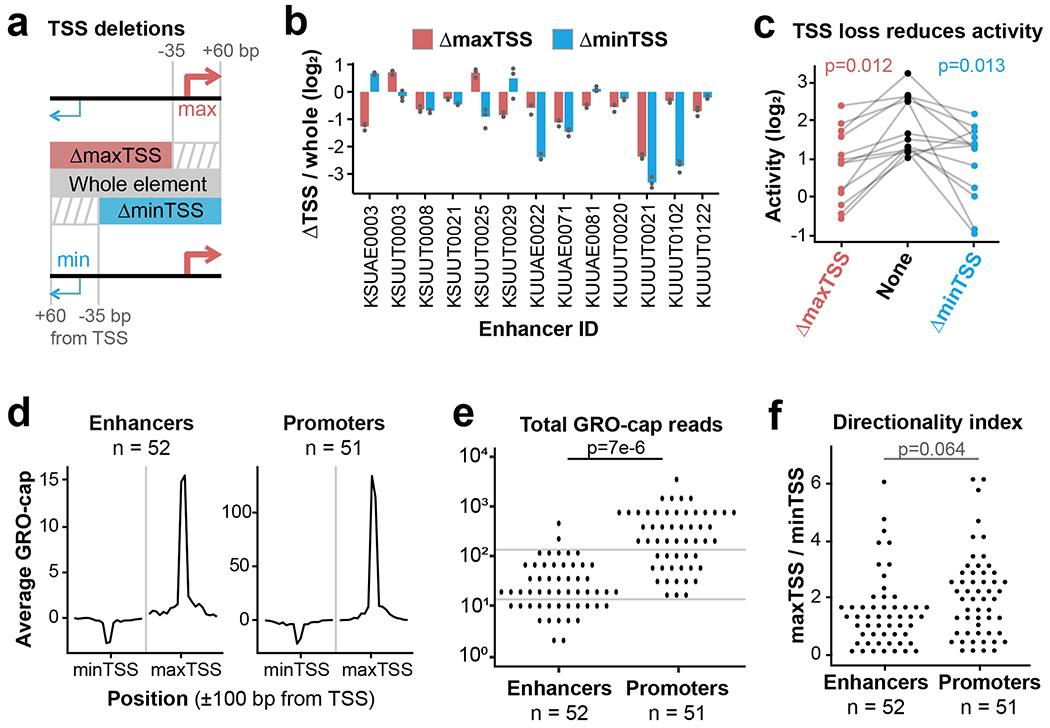
Next, we sought to determine whether all components of the divergent TSS model (Fig. 3a) are necessary to drive distal enhancer activity. Previous studies found significant conservation of core promoter sequences at distal enhancers22, but this conservation could be driven by selection for promoter function15,23. We reasoned that if transcription is spurious or unimportant to enhancer activity, core promoter sequences should be dispensable. To test this hypothesis, we re-cloned 13 eSTARR-seq enhancers to “delete” (by omission) each of their core promoter regions, defined as −35 to +60 bp from the TSS (Fig. 4a). Since each enhancer contains a divergent pair of TSSs, we compared the effect of deleting either the maxTSS (defined from GRO-cap signal) or the weaker “minTSS”. Deletion of a TSS resulted in at least two-fold reduced activity from 9/13 enhancers (Fig. 4b–c). Interestingly, these enhancers could depend on the max or min TSS, or both. These results demonstrate that core promoter regions significantly contribute to enhancer activity.
Fig. 4. Function and features of enhancer TSSs.
a. Boundary definitions for whole elements (gray box) and TSS deletions (red and blue boxes). Stripes indicate “deleted” regions.
b. Change in eSTARR-seq activity after deleting either the maxTSS (red) or minTSS (blue; n = 3 transfections).
c. Plot of element activities after TSS deletion (n = 13 enhancers). P values are from a one-sided paired t test.
d. Average profiles of GRO-cap signal from eSTARR-called enhancers vs. promoters. Note 10-fold difference in y-axis scales.
e-f. Dot plot of TSS signal and directionality index at enhancers vs. promoters. Gray lines emphasize substantial overlap between enhancer and promoter distributions. P values are from a one-sided t test.
Next, we compared enhancer TSSs to the gene-proximal TSSs included in our study. eSTARR-seq enhancer TSSs produce significantly less GRO-cap signal than promoters, but there is not enough separation between the populations for this feature alone to distinguish them (Fig. 4d–e). Additionally, the divergent TSSs within eSTARR-seq enhancers are not significantly less directional than gene promoters, as quantified by the ratio between max- and minTSS signal (Fig. 4f). Together, these results demonstrate that enhancers’ core promoter region contribute to function but are not easily distinguishable from gene promoter TSSs.
Comparison to a genome-scale STARR-seq dataset
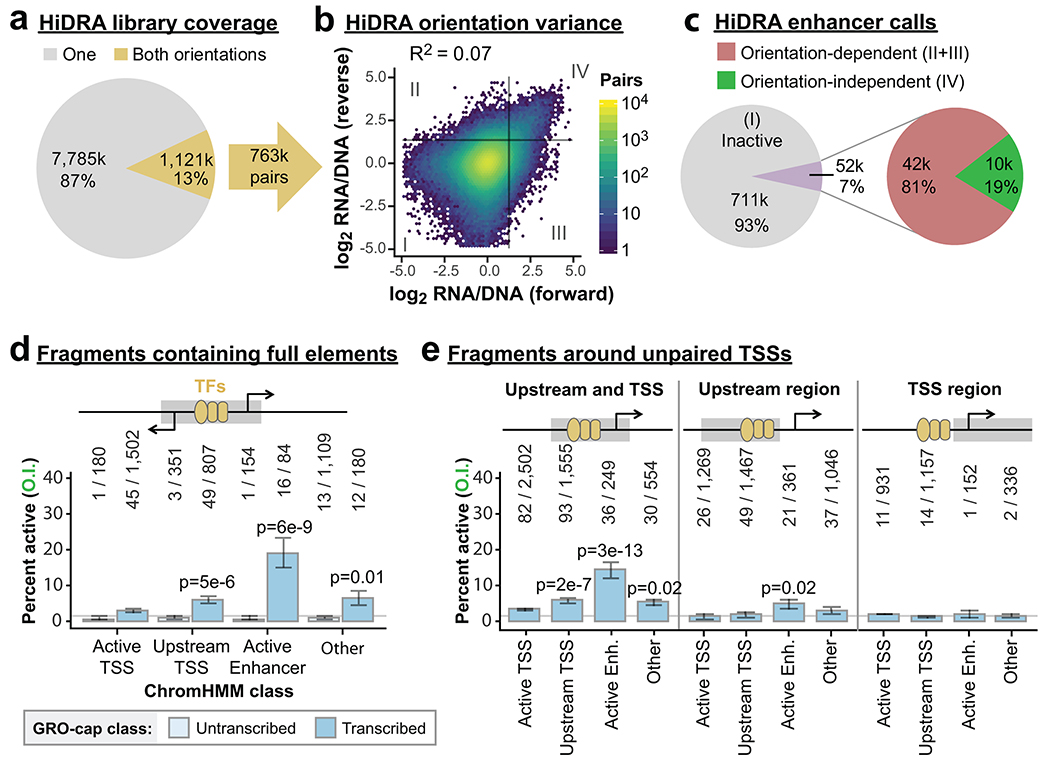
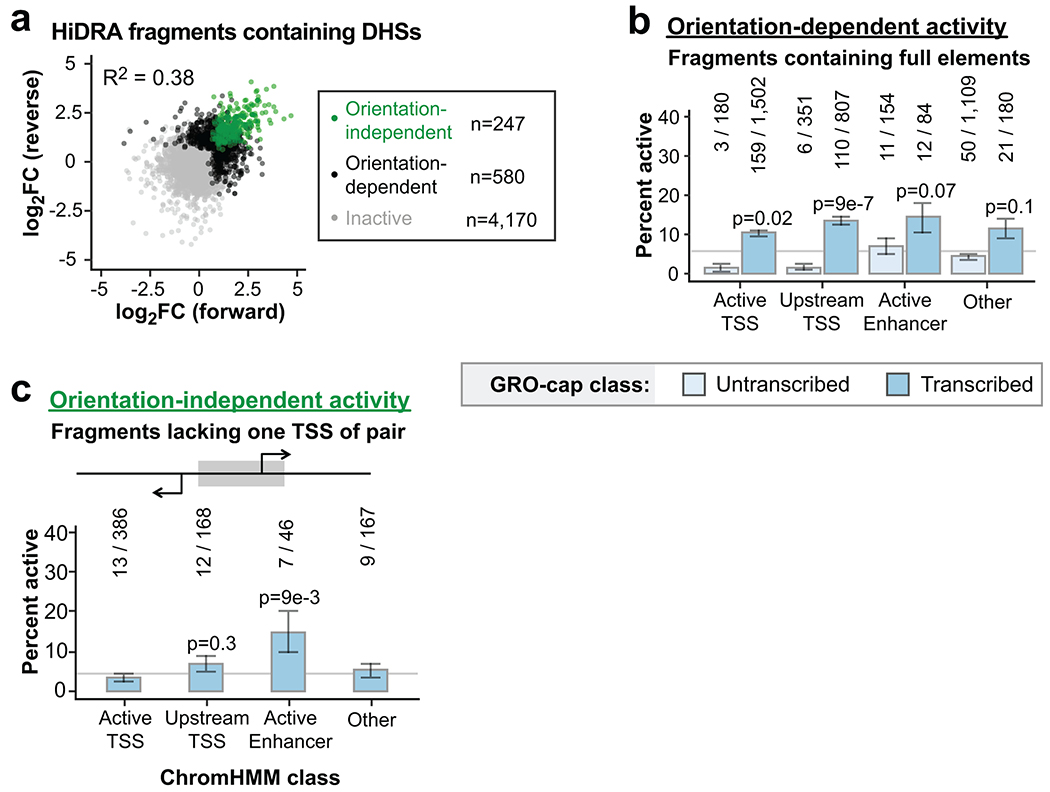
To confirm our findings, we re-analyzed the “High-resolution Dissection of Regulatory Activity” (HiDRA) dataset37, which uses the STARR-seq assay on Analysis of Transposase-Accessible Chromatin (ATAC-seq) fragments. This impressively comprehensive dataset from GM12878 cells quantifies enhancer activity from 100-600 bp fragments enriched within DHSs, thus dissecting potential enhancer elements genome-wide. Given our observations of pronounced orientation effects in STARR-seq assays (Fig. 2c), we attempted to remove this bias wherever possible. Unfortunately, most HiDRA fragments (87%) do not share ≥ 90% overlap with a fragment tested in the opposite orientation (Extended Data Fig. 3a). We assessed orientation bias across all 763,373 fragment pairs tested in both orientations and found very little agreement across orientations (Extended Data Fig. 3b; HiDRA R2 = 0.07). Interestingly, HiDRA fragments that contain a DHS exhibit less orientation bias (Extended Data Fig. 4a; R2 = 0.38), closely matching our eSTARR-seq results (R2 = 0.33; Fig. 2c).
Importantly, accounting for orientation bias in STARR-seq datasets has substantial impact on enhancer identification. While 93% of HiDRA fragment pairs appear inactive (Extended Data Fig. 3b, Quadrant I), the 7% of fragment pairs with elevated RNA/DNA signal (Quadrants II-IV) are dominated by orientation bias (Quadrants II-III): only 19% of these fragment pairs exhibit elevated activity in both cloning orientations (Quadrant IV, Extended Data Fig. 3c). This is true even when only considering fragments that span a DHS, with 71.2% of enhancers exhibiting orientation-dependence (N = 580/827 enhancer fragment pairs; Extended Data Fig. 4a). Interestingly, most transcribed DHSs showed enrichment for orientation-dependent activity (Extended Data Fig. 4b). When using stringent orientation-independent enhancer criterion, HiDRA identifies only 0.22% of tested fragments as enhancers, although this should be greatly improved by selection of larger fragments to increase capture of whole elements.
GM12878 HiDRA fragments containing enhancer units defined by divergent TSSs were most enriched in the Active Enhancer ChromHMM category (Extended Data Fig. 3d), confirming our observations in K562 cells (Fig. 2d). To determine if one or both core promoter sequences are necessary for enhancer activity, we evaluated the fraction of HiDRA enhancers around unpaired GRO-cap TSS. At unpaired TSSs, the upstream and core promoter regions can be easily separated for functional analysis (Extended Data Fig. 3e). Strikingly, we observed little enrichment for orientation-independent enhancers from upstream or TSS regions alone, while activity is enriched within fragments containing both the TSS and upstream regions (Extended Data Fig. 3e). These results demonstrate that core promoter sequences within TSS regions are necessary for distal enhancer activity, and strongly suggest a functional role for RNAPII recruitment to enhancers. Our findings are reminiscent of recent dissections of promoter activity and provide strong support for similar architectures at promoters and enhancers13,30, although they each exhibit clearly distinct functions (Fig. 2e and Extended Data Fig. 3d–e).
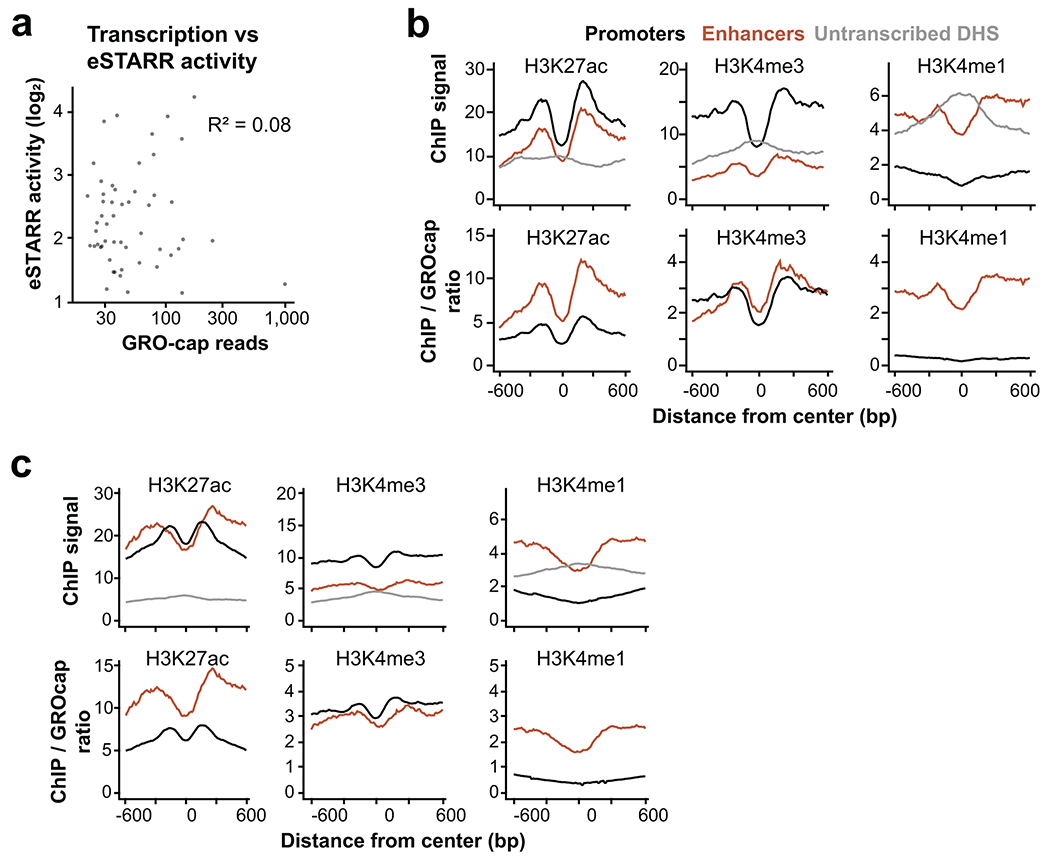
Since TSSs functionally contribute to enhancer activity, we directly compared enhancer activity to transcription levels. We found no correlation between GRO-cap signal and eSTARR-seq activity (Extended Data Fig. 5a), although we caution that this analysis compares different contexts (genomic and episomal). We also compared enhancer TSS histone modifications to those of gene promoters. As expected, enhancers identified from eSTARR or HiDRA datasets exhibit elevated H3K4me1 and H3K27ac, but reduced H3K4me3 levels (Extended Data Fig. 5b–c, top). To estimate if these differences might be explained by transcriptional activity, we computed the ratio between each histone modification and transcription measured by GRO-cap. Interestingly, the H3K4me3/transcription ratio does not differ between promoters and enhancers, whereas H3K27ac and H3K4me1 ratios are higher at enhancers than promoters (Extended Data Fig. 5b–c, bottom). Together, these results suggest a complex relationship between histone modifications, transcription, and enhancer activity.
Dissection of compact enhancer clusters with eSTARR-seq
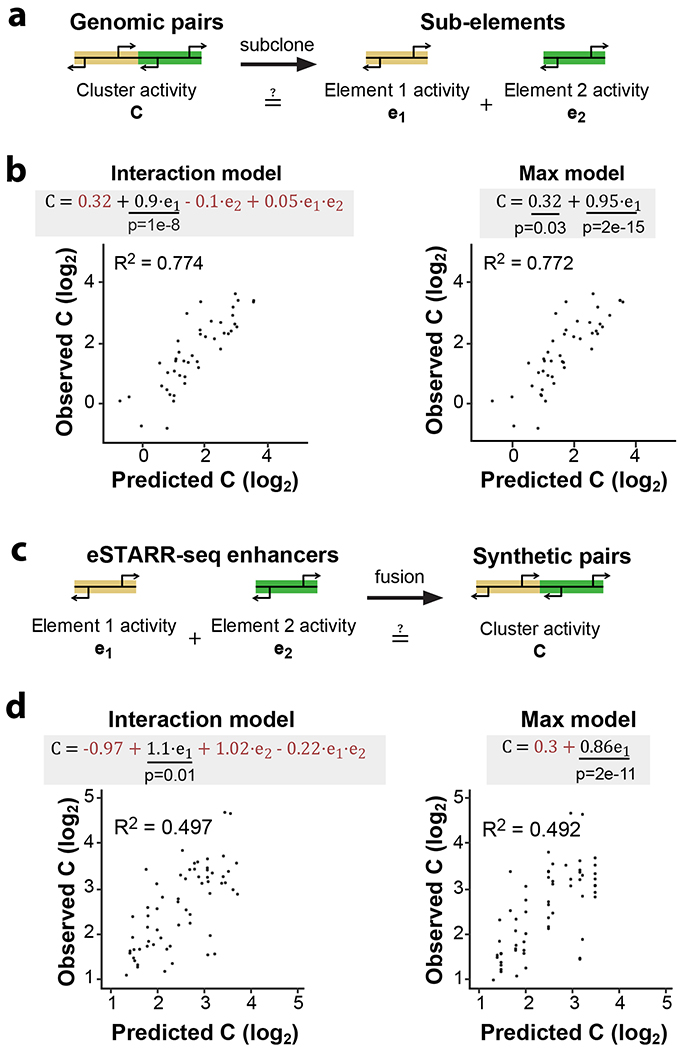
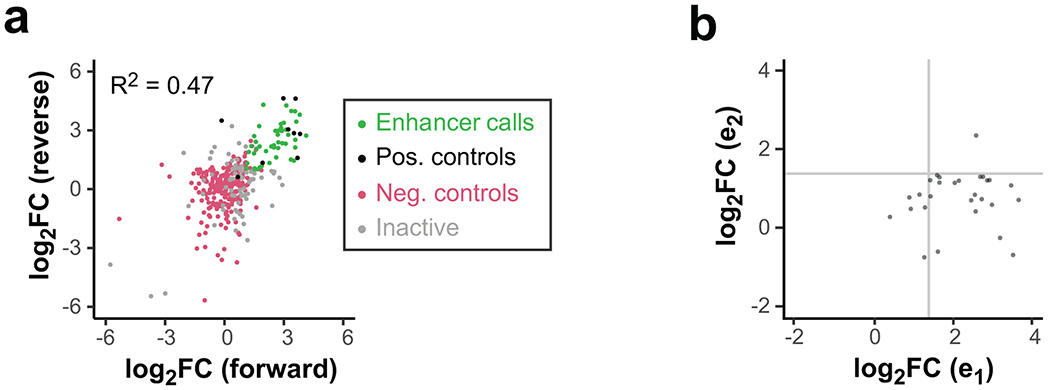
Many gene-distal TSSs are found in dense regulatory clusters that have complex histone modification patterns19, implying widespread clustering of basic enhancer units. To explore how individual enhancer units (subunits) might cooperate within these clusters, we fit a model to predict the enhancer activity of a cluster from its subunits’ activities (Fig. 5a). 100 clusters and associated subunits were successfully cloned so that their enhancer activity could be quantified independently within the same experiment. 45% of clusters showed significant enhancer activity compared with negative controls (Extended Data Fig. 6a), and predominantly contained a single active sub-element (Extended Data Fig. 6b).
Fig. 5. Functional dissection of adjacent enhancers.
a. Dissection of genomic TSS clusters into individual sub-elements to quantify enhancer cooperativity.
b. Two linear models were fit to eSTARR-seq measurements of full clusters (C) and individual enhancers within the cluster (e1 and e2). The interaction model includes both individual enhancers and an interaction term, while the max model only considers the stronger sub-element (chosen to be e1). Fitted equations are shown with significant covariates underlined and non-significant covariates colored red. Interaction model was linear regression with 42 degrees of freedom, F = 40.1. Max was linear regression with 44 degrees of freedom, F = 144. Comparing both models with one-way ANOVA, F = 1.93 and P = 0.158, indicating similar performance.
c. Schematic illustrating fusion of active enhancer sequences into synthetic enhancer pairs.
d. Fitting of same linear models as b to enhancer activities of individual elements and their synthetic fusion (as shown in c). Interaction model was linear regression with 62 degrees of freedom, F = 23. Max was linear regression with 64 degrees of freedom, F = 67. Comparing both models with one-way ANOVA, F = 0.997 and P = 0.375, indicating similar performance.
We fit a linear model to predict cluster activities (Interaction model, Fig. 5b) from the observed subunits’ activities (e1 and e2, where e1 > e2) and an interaction term (e1 × e2). Strikingly, this analysis revealed significant covariance between cluster activity and the subunit with higher activity (e1, P = 0.01), but not the subunit with lower activity (e2). Indeed, including only the subunit with higher activity (“Max model”) explains 77.2% of the observed variance (Fig. 5b), which was not significantly less than the Interaction model (P = 0.31). This suggests that genomic enhancer clusters are predominantly driven by a single active subunit but afforded little insights into cooperativity between multiple active subunits.
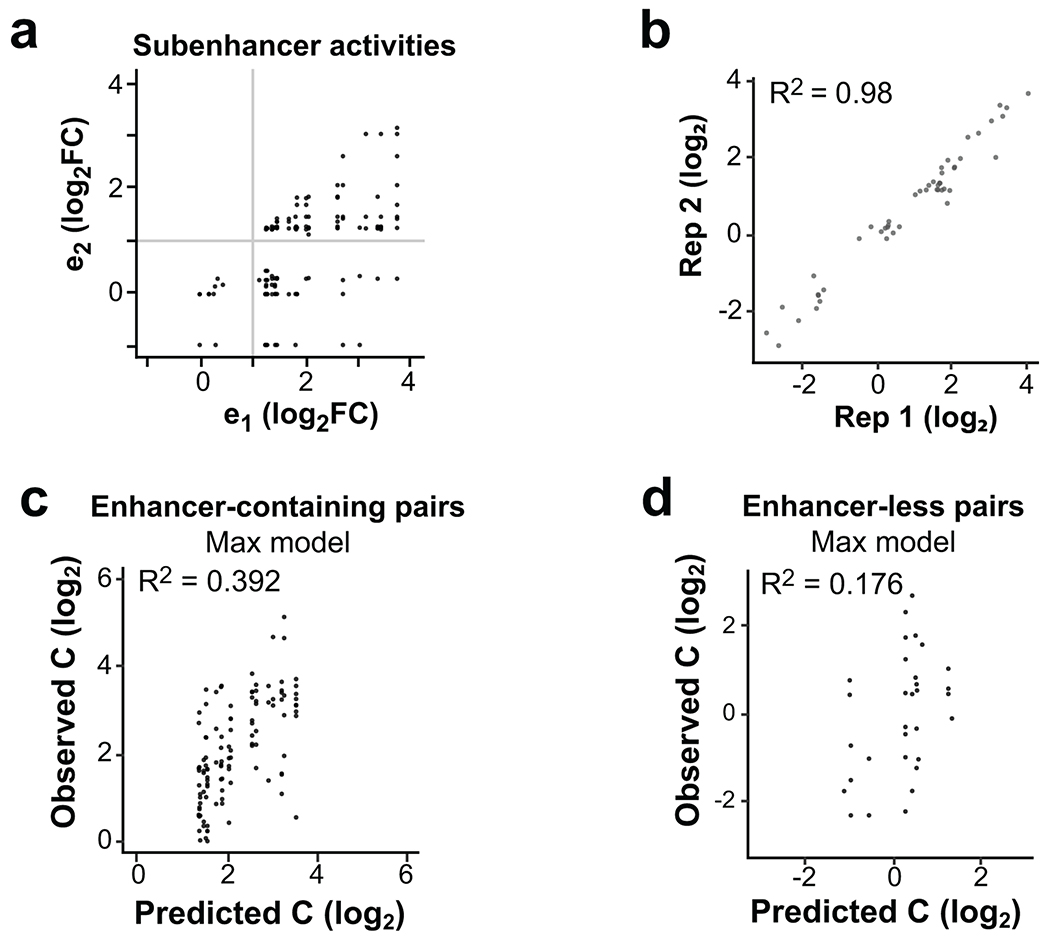
To directly assess cooperativity between active subunits, we generated synthetic pairs made by randomly fusing eSTARR-seq active enhancer units (Fig. 5c). We developed a pooled strand-overlap extension PCR strategy to fuse units into random pairs linked with a constant 25 bp sequence. This method generated 188 fusions, 69 of which were pairs of active enhancer units (Extended Data Fig. 7a). Individual units were re-tested in the same pool as the fused sequences, and their eSTARR-seq activities agreed well with previous measurements (Extended Data Fig. 7b). Surprisingly, the interaction model including both subunits still did not find statistically significant predictive power from the weaker subunit and failed to outperform the Max model (P = 0.28), demonstrating that proximity to a stronger enhancer effectively abolishes weaker enhancers’ activity. The max model explains 49.7% of the variance among active enhancer pairs, and 39.2% of the variance among all enhancer-containing pairs (N = 86; Extended Data Fig. 7c). As expected, the Max model does not perform well for pairs lacking any enhancer activity, explaining only 17.6% of the variance (N = 33; Extended Data Fig. 7d). These results demonstrate that immediate proximity of enhancer units in DNA often allows only the strongest enhancer to function and may therefore be used to select for the maximum activity from neighboring enhancer subunits.
Dissection of the endogenous NMU enhancer cluster
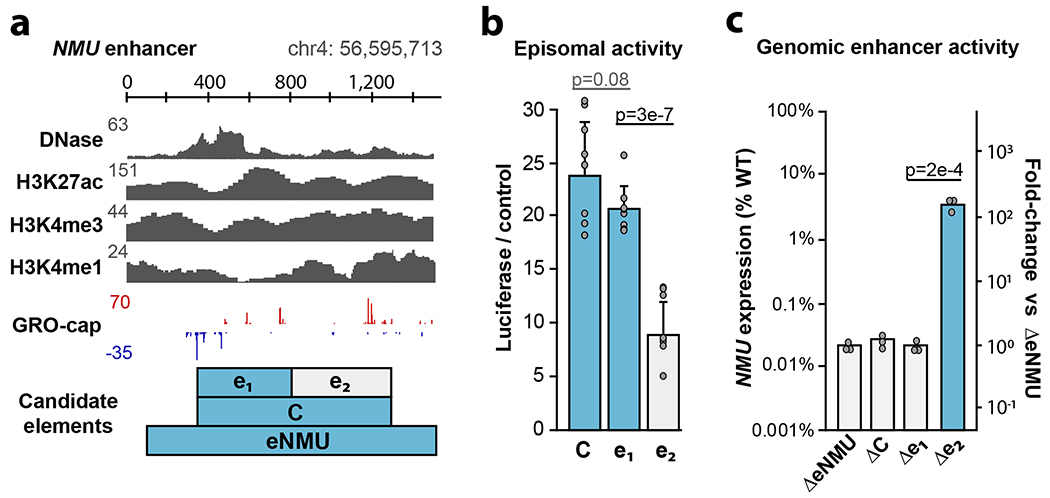
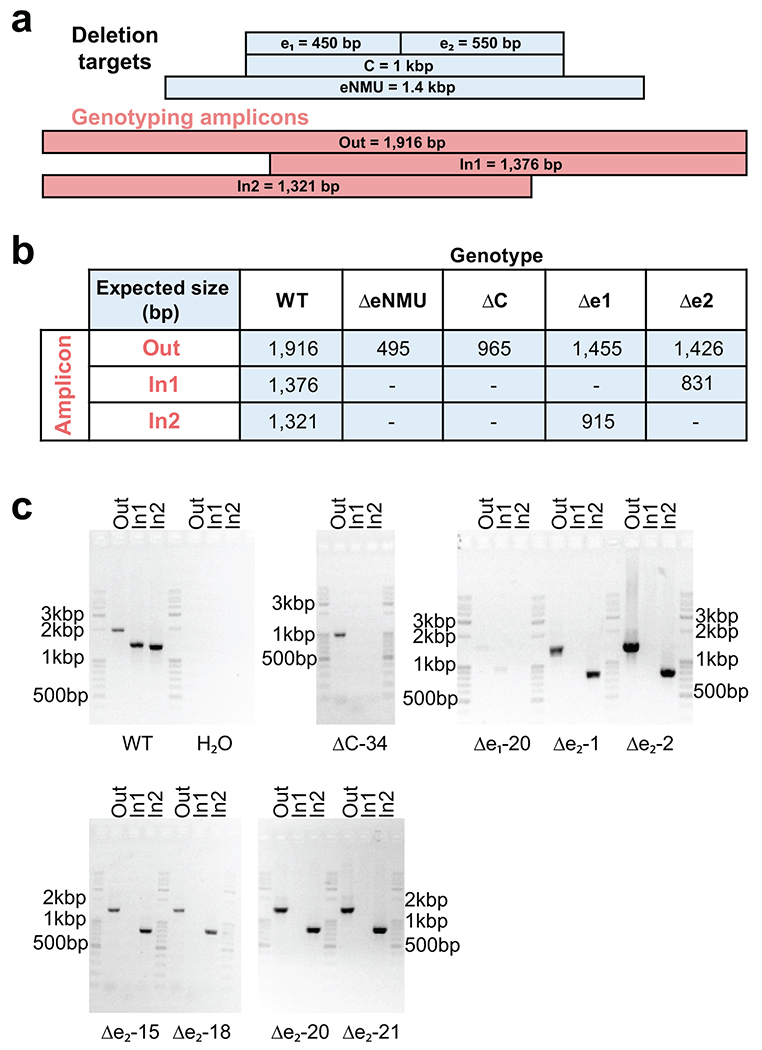
We sought to test our TSS-based definition of enhancer boundaries in the genomic context by targeting the distal enhancer of NMU (“eNMU”), which was reported to exhibit a large effect after homozygous deletion without impeding cell growth38. Published datasets reveal elevated levels of DNase hypersensitivity, H3K27ac, H3K4me3 and H3K4me1 at this element, and we identified two candidate enhancer subunits based on the pattern of GRO-cap TSSs (Fig. 6a). Episomal luciferase assays suggested similar behavior as other genomic clusters we previously dissected with eSTARR-seq (Fig. 5b): a single dominant subunit (e1) driving activity of the cluster (Fig. 6b). To confirm this behavior in the genomic context, we transiently transfected K562 cells with plasmids expressing Cas9 and pairs of guide RNAs (gRNAs) targeting the boundaries of each indicated candidate element. We obtained eNMU deletion lines as controls38 and established new clonal lines for genotyping by genomic PCR to ensure successful homozygous deletions (Extended Data Fig. 8). To estimate effect size from each clone, we performed qRT-PCR and computed NMU expression compared to wild-type cells (Fig. 6c). We also computed NMU expression relative to eNMU deletion (ΔeNMU, Fig. 6c right axis) to directly estimate endogenous enhancer activity. From this perspective, wild-type eNMU drives NMU expression almost 10,000×, as previously reported38. Deletion of the full cluster C (ΔC) or the stronger subunit (Δe1) revealed complete loss of enhancer activity, confirming that TSS boundaries define enhancer subunits within dense TSS clusters. Surprisingly, e2 deletion (Δe2) resulted in 3-5% of wild-type NMU expression, indicating that e1 alone cannot fully recapitulate activity. e1 maintains enhancer function in the absence of e2 (100× over ΔeNMU), confirming its role as the “dominant” enhancer within this cluster, but nevertheless exhibits multiplicative cooperativity39 with e2 not detected by episomal assays. These results validate enhancer unit boundaries defined by TSSs, confirm a dominant subunit often drives activity within dense enhancer clusters40, and identify important differences between episomal and genomic reporter assays.
Fig. 6. Dissection of the NMU enhancer.
a. Dissection of the TSS cluster within the NMU enhancer (”eNMU”). Cluster “C” contains two distinct candidate subelements: e1 and e2. The presence of e1 is indicated with blue throughout the figure.
b. Normalized luciferase activity of the candidate cluster and subelements using the MYC promoter (n = 5 luciferase reactions).
c. Quantification of NMU expression from the indicated homozygous Cas9 deletion clones (n = 3 PCR replicates). Representative ΔeNMU and Δe2 expression clones are shown from n = 5 clonal lines; ΔC and Δe1 are from n = 1 clonal line.
All error bars indicate standard deviation centered on the mean. All P values are from two-sided t test.
Discussion
Although transcription and histone modifications are closely correlated8,11,13, we find that histone marks offer lower resolution for defining active enhancers compared to transcription initiation patterns provided by GRO-cap13,41. We further demonstrate that TSSs are useful anchors in revealing motif positioning within enhancers and enable dissection of regulatory clusters into individual subunits.
Previous analyses of conserved enhancers across species found widespread TF motif rearrangements that did not impact function, leading to a “flexible” sequence model for enhancers that was only evaluated with promoter-proximal MPRAs42,43. Using the distal enhancer design of STARR-seq, we find that enhancer activity requires at least one core promoter in addition to TF binding in the flexible upstream region, suggesting a functional role for RNAPII recruitment at enhancers. Likewise, recent analyses of population variants affecting gene-distal GRO-cap TSSs suggest that core promoter mutations in distal enhancers can disrupt enhancer function28. The requirement for core promoters at enhancers is particularly intriguing given reports that core promoters confer specificity for enhancers and co-activators24,33,34; this suggests enhancers could target promoters by recruiting similar core promoter machinery. Additionally, RNAPII pausing at enhancers10 may facilitate distal interactions through the CTD’s affinity for other CTDs20, resulting in coordinated pause release at promoters and associated enhancers by recruitment of P-TEFb kinase44. Further analysis of regulatory architectures at promoters and enhancers may expand the lexicon for non-coding elements beyond individual TF motifs and clarify enhancer-promoter interaction specificities and mechanisms.
eSTARR-seq resulted in a relatively modest validation rate of ~25% for gene-distal GRO-cap candidate elements. We reason that this might be explained by low reporter sensitivity or the need to screen different promoter types33. Additionally, it is unlikely that all elements exhibiting bidirectional transcription carry enhancer activity: consistent with previous studies2,26,29, we find few human promoters with distal enhancer activity, despite their bidirectional transcription. This observation highlights remaining questions about the distinguishing features of these two regulatory elements. In general, promoters and enhancers have been reported to differ in GC content and TF recruitment preferences, but such rules lack specificity30. Core promoter sequence features might help distinguish enhancers from promoters, particularly if RNAPII itself reads a regulatory code during pausing or early elongation. For example, RNAPII pausing is sequence-dependent19,45, and is substantially longer-lived at promoters than enhancers10. Stable RNAPII pausing at promoters may provide time to recruit distal regulatory complexes by co-localization with the unstable RNAPII pausing seen at enhancers. Finally, transcriptional burst size is thought to be encoded within core promoter sequences46. Promoters may undergo selection for larger burst sizes, whereas enhancers maximize burst frequency to drive distal gene activation47.
Genomic enhancer clusters have recently been dissected resulting in different models of their cooperativity40,48,49. Analysis of these datasets demonstrated that both reports are consistent with multiplicative generalized linear models39 although statistical power was greatly constrained by sample size. While these studies assessed cooperativity over significant distances (2-50 kb), we assayed dozens of adjacent enhancer pairs (≤600 bp apart) and fit a single multiplicative (or log-additive) linear model to explain their cumulative activity. Our episomal dataset surveys a larger number of clusters and indicates a single active subunit often drives cluster activity. We validate this dominant subunit model at the eNMU cluster, where deletion of the e1 subunit abolishes all enhancer activity. Although e2 is unable to enhance NMU expression without e1, it exhibits multiplicative amplification of e1 (20× increase). We speculate that this may be mechanistically explained by a 5’ splice site that can dramatically boost enhancer activity15, or hierarchical behavior40 in which the accessibility and/or transcription of e2 depends on e1. A recent report of TSS “switching” within developmental enhancer clusters50 underscores the need for further TSS-based interrogation of enhancer subunits. If confirmed on a larger scale, TSS-based enhancer definition can reduce complex regulatory programs into simple, modular units.
Methods
Please refer to the Life Sciences Reporting Summary in Supplementary Information for general information.
Dual luciferase assays
The selected TREs were individually cloned into eSTARR-seq assay vectors via LR reactions and the resulting library of plasmids was extracted with the E.Z.N.A. Endo Free Plasmid Mini Kit II (Omega Bio-tek, D6950). The plasmids were electroporated into K562 cells with Ingenio Electroporation Kit (Mirus, MIR 50115). For each electroporation, 0.5 million cells were mixed with 1-2 μg plasmids and 50 μl Ingenio Electroporation Solution and electroporated with a Nucleofector II device using Program T-016. The pGL4.75 vector (Promega, E6931) was co-electroporated (10 ng/electroporation) as the internal control. The electroporated K562 cells were recovered in 2 ml culture medium at 37°C with 5% CO2 until harvest.
The electroporated cells were harvested after 24 hours of recovery for dual luciferase assay. The assay was carried out with Dual-Glo Luciferase Assay System (Promega, E2920) according to the manufacturer’s instruction. An Infinite M1000 Microplate Reader (Tecan, 30034301) was used to quantify the luminescent signals. Cells electroporated with only pGL4.75 vector or with only pDEST-hSTARR-luc-Pmyc vector were used as the background controls for firefly or Renilla luciferase activities, respectively.
Candidate element selection, definition, and primer design
To systematically compare transcribed and untranscribed candidates within each ChromHMM class, we focused on high-confidence Active TSS, Upstream TSS, and Active Enhancer predictions (posterior P > 0.99). This set of regions was then filtered by requiring overlap with ENCODE DHS peaks from K562 cells. Finally, ChromHMM regions were classified as either transcribed or untranscribed by overlapping with GRO-cap divergent peaks (from supplementary files of reference13). 251 untranscribed regions were cloned using DHS peak coordinates as boundaries. Similarly, 305 transcribed regions were cloned using boundaries 60 bp downstream of each divergent TSS (TSS + 60 bp), where the TSS position is the max GRO-cap signal within the peak. See Extended Data Figure 1A for element sizes within each class. TSS + 200 bp elements were cloned using boundaries 200 bp downstream of each divergent GRO-cap TSS.
As negative controls, we selected 250 sequence-verified human ORFs ranging from 600-2,000 bp in size. These coding sequences were screened for any exonic DHS and/or GRO-cap TSSs. As positive controls, we included HS0012, MYC E1-76 and a collection of viral promoters/enhancers (CMV, RSV, and SV40). All primer sequences used in this work can be found in Supplementary Table 1.
Element cloning and input plasmid library preparation
The primers for cloning elements were designed in batch with a webtool51 and synthesized by Eurofins. Each primer contained a 5’-overhang, attB1’ for the forward primers and attB2’ for the reverse primers. Human gDNA was used as template for the PCR reactions. The amplicons were cloned into pDONR223 vector via Gateway BP reactions. The resulting single-colony entry clones were verified by Illumina sequencing as previously described51.
All verified element clones were propagated in LB medium supplemented with spectinomycin. The culture was then pooled together for plasmid extraction with E.Z.N.A. Plasmid Midi Kit (Omega Bio-tek, D6904). The elements were cloned into eSTARR-seq assay vector via en masse Gateway LR reactions to generate the input plasmid library. The input library was propagated in LB medium supplemented with ampicillin and the plasmids were extracted with the E. Z. N. A. Endo-Free Plasmid DNA Maxi Kit (Omega Bio-tek, D6926).
eSTARR-seq assay vector
The eSTARR-seq assay vectors were generated by modifying the original STARR-seq vector2. To engineer the pDEST-hSTARR-luc-Pmyc vector, the Synthetic Core Promoter (SCP) in the STARR-seq vector was replaced with the MYC promoter6 and the truncated sgGFP was replaced with a luciferase reporter gene (luc2). Additionally, the two cloning sites and the DNA fragment between them in the STARR-seq vector were replaced with an attR1-attR2 Gateway cassette. To engineer the pDEST-hSTARR-luc-Pmyc-ccw vector, the attR1-attR2 Gateway cassette in pDEST-hSTARR-luc-Pmyc vector was removed and then re-cloned back to its original position in the reverse orientation. Additionally, we generated a pDEST-hSTARR-luc vector that is almost identical to the pDEST-hSTARR-luc-Pmyc vector except that a SCP1 promoter2 was used instead of the MYC promoter.
Cell culture
The K562 cells (CCL-243) were purchased from American Type Culture Collection (ATCC). The cells were maintained in the culture medium composed of the Iscove’s Modified Dulbecco’s Medium (ATCC, 30-2005) supplemented with 10% fetal bovine serum (ATCC, 30-2020) at 37°C with 5% CO2. Cells used for different biological replicates were cultured separately.
eSTARR-seq library preparation
The input library plasmids were electroporated into the K562 cells with Cell Line Nucleofector Kit V (Lonza, VCA-1003). For each electroporation, one million cells were mixed with 20 μg plasmids and 100 μl supplemented Nucleofector Solution V and electroporated with a Nucleofector II device (Lonza) using Program T-016. The electroporated K562 cells were recovered in 2 ml culture medium at 37°C with 5% CO2 until harvest.
The electroporated K562 cells were harvested after six hours of recovery. Total RNAs were extracted from the cells with TRIzol Reagent (ThermoFisher Scientific, 15596026) according to the manufacturer’s instructions. Reverse transcription was performed with the total RNAs as the template using SuperScript III reverse transcriptase (ThermoFisher Scientific, 18080044). The electroporated plasmids were extracted from the cells as previously described52. The 1st primer extension was performed with the extracted plasmids as the template. In parallel, another primer extension reaction was carried out with the input plasmid library used for transfection as the template. Reactions were treated with exonuclease I to remove excess single-stranded primer, followed by purification on a MinElute purification column (QIAGEN, 28004).
The 2nd primer extension was performed with the products of both the reverse transcription and the 1st primer extension as the templates. In the library preparation for fusion TREs, a low-cycle PCR was performed with the products of the 2nd primer extension as templates to add the Illumina sequencing adaptors and the indexing barcodes, followed by the acquisition of 240 bp + 360 bp reads on a Miseq Illumina sequencer. In all the other library preparations, the products of the 2nd primer extension went through a low-cycle pre-tagmentation PCR amplification before being tagmented with TN5 transposomes53. Another round of low-cycle post-tagmentation PCR was performed to add the sequencing adaptors and the indexing barcodes, followed by the acquisition of 1 × 75 bp reads on a Nextseq 500 Illumina sequencer.
eSTARR-seq data analysis
Cutadapt was used to identify attB1 sequences within each read. Next, a custom python script was used to extract element sequences and remove PCR duplicates (identical PCR barcode + first 15 bp of element). Processed reads were then aligned to candidate elements with bowtie2 (--end-to-end -a). A custom R script was used to extract alignments within 3 bp of the expected cloning boundaries, ensure complete removal of PCR duplicates, and generate orientation-specific read counts for each candidate.
To identify elements with significant enhancer activity, raw read counts were processed using voom from the R Bioconductor limma package. RNA and DNA counts were treated as distinct experimental conditions within each replicate. Active enhancers were defined as having significantly elevated ratio of RNA to DNA counts with FDR-adjusted P < 0.1 in both cloning orientations. Additionally, we required log2 fold-change ≥ 1 in both cloning orientations to ensure significantly higher activity than negative controls (Fig. 2c). These heuristics were validated with a linear model explicitly comparing each element to the negative control distribution. De-duplicated read counts and associated statistics are available through the public ENCODE repository.
HiDRA data analysis
Raw sequencing files were obtained from SRA (accession SRP118092) and aligned to the hg19 genome as described37 (bowtie2 -p 6, -q and --phred33). BAM files were merged within replicates using samtools, then processed with a custom R script to remove multi-mappers (mapq < 30) and apply size selection (100-600 bp). Differential RNA vs. DNA read counts were detected using voom from the R bioconductor limma package. To minimize size bias, voom was applied separately to fragments from 100-150 bp, 150-200 bp, etc. After applying voom, we only considered fragments with ≥ 5 DNA counts (summed from all replicates) to minimize artifacts of low-coverage sites. Alignments with mutual overlap ≥ 90% and mapping to opposite strands were considered as a “forward” and “reverse” alignment pair. We required FDR-adjusted P < 0.1 in both forward and reverse cloning orientations to call active enhancer fragments. HiDRA enhancer fragments were then analyzed relative to published GM12878 GRO-cap peaks13. GRO-cap peaks were collapsed to the single most-used transcription start nucleotide with a custom R script.
For dissection of unpaired GRO-cap TSSs, “Upstream and TSS” fragments were defined as containing at least 200 bp upstream and 30 bp downstream of a GRO-cap TSS (size > 230 bp). “Upstream region” fragments were taken from between 330 and 35 bp upstream of a GRO-cap TSS (size < 295 bp). “Core promoter region” fragments were defined to contain at least 40 bp upstream and 190 bp downstream of a GRO-cap TSS (size > 235 bp).
Motif density analysis
K562 and GM12878 GRO-cap divergent pairs and processed GRO-cap data were obtained from published work13. Peaks were refined to a single nucleotide according to the maximum GRO-cap signal within each TSS. Divergent pairs were required to be at most 300 bp apart for visualization. Genomic sequences from −400 to +100 bp of the max TSS of each divergent pair were scanned for motifs using RTFBSDB with default match settings54. This scan produces a N × 500 count matrix, where N is the number of sites scanned, and 500 bp is the number of scanned positions. Each entry in the matrix is 0 (motif absent) or 1 (motif present). After removing divergent pairs without any matching motifs, loci were sorted by distance between their divergent TSSs and whether they were proximal (within 500 bp) or distal to a GENCODE gene annotation start coordinate. Finally, neighboring rows in the count matrix were averaged into 100 groups to compute motif density at each position for each strand and normalized to the maximum density observed in the matrix. This matrix was plotted at 4 bp resolution for visualization; most motifs are 4-12 bp. All motif density profiles shown in Figure 3 are from K562 GRO-cap TSSs, except for STAT2, which was derived from GM12878 GRO-cap TSSs.
Pooled strand overlap extension PCR
Using a multichannel pipette, PCR reactions were prepared by pairing forward and reverse oligonucleorides appropriately (e.g. A pairs with B, and C pairs with D). 50 μl PCR reactions were carried out using Phusion DNA polymerase for 28 cycles and annealing at 58°C. Amplicons were double purified using Ampure XP beads according to the manufacturer’s protocol and eluted into 40 μl of ddH2O. Each amplicon was quantified in a 96-well plate using the QuBIT dsDNA Broad Range reagents and a flourometric plate reader. A pooled annealing and extension reaction was set up as follows: 10 μl of 5× HF buffer, 10 μl of 5 M Betaine, 1 μl of 12.5 mM dNTP mix, 0.5 μl of Phusion DNA Polymerase (NEB), forward and reverse linker oligonucleotides to 10 nM final concentration, and ddH2O to 50 μl final volume.
Denaturation was performed at 95°C for 3 min. Annealing was performed by rapid cooling to 50°C for 3 min. Extension was performed at 72°C for 5 min. The reaction was then cooled to 4°C for 5 min. A final PCR reaction was performed to specifically amplify stitched products. The SOE-PCR reaction mix from the previous step was used directly without any purification: 20 μl of 5× HF buffer, 20 μl of 5 M Betaine, 2 μl of 12.5 mM dNTP mix, 1 μl of Phusion DNA Polymerase (NEB), forward and reverse primers to 250 nM final concentration, and ddH2O to 100 μl final volume.
Amplification was performed for 8 cycles to minimize bias. Denaturation was 95°C for 3 min, annealing was 65°C for 2 min, and extension was 72°C for 1 min. SOE-PCR amplicons were then size-selected from a non-denaturing 6% polyacrylamide gel.
Establishing homozygous deletion cell lines with Cas9
The gRNA sequences were designed as previously described55. Candidate 20-mer guides upstream of an NGG PAM site and within 50 bp of the desired cutting site were identified and filtered to eliminate potential off-target effects. All candidates were reverse complimented and aligned to the human reference genome (hg19) using Bowtie 1.1.2, with settings -n 2 -l 18 -p 8 -a -y --best -e 90. Guides mapping to more than one location with these settings were not used. The gRNA-coding oligonucleotides were synthesized (Eurofins) and cloned into pSpCas9(BB)-2A-Puro (PX459, Addgene Plasmid #48139)56 and/or lentiCRISPRv2 neo (Addgene Plasmid #98292)57 so that the gRNA-coding sequences targeting the up- and downstream breakpoints of each desired deletion locus were cloned into different CRISPR/Cas9 vectors. Different plasmids for generating the desired pair of breakpoints were mixed (1 μg each) and electroporated into one million K562 cells with Cell Line Nucleofector Kit V (Lonza, VCA-1003) and recovered in 2 ml culture medium for 24 hours. The electroporated cells were then treated with 200 μg/ml G-418 (Roche 04727878001) and 2 μg/ml puromycin (Gibco A1113803) for 72 hours. After the antibiotic treatment, individual surviving cells were sorted into 96-well plates using MA900 Multi-Application Cell Sorter (Sony). Single-cell clones were confirmed with PCR and agarose gel electrophoresis.
Quantification of NMU expression
Single-cell clones with confirmed deletions in eNMU locus were harvested for total RNA extraction with TRIzol Reagent (ThermoFisher Scientific, 15596026) and Direct-zol RNA Miniprep Kit (Zymo Research, R2050). Total RNAs were reverse transcribed into cDNA with Maxima H minus Reverse Transcriptase (EP0753) and Oligo(dT)18 as primer. qPCR reactions were carried out with the yielded cDNA as the template using SsoFast EvaGreen Supermixes (Bio-Rad) in a LightCycler 480 (Roche).
Data availability
eSTARR-seq data are available through the ENCODE data portal (www.encodeproject.org) under accessions ENCSR514FNW, ENCSR729EGU, and ENCSR585AGE. Processed GRO-cap data were obtained from Gene Expression Omnibus expression GSE60456. Raw sequencing files for the HiDRA study were obtained from SRA accession SRP118092. All candidate regulatory element clones generated in this study and used for eSTARR-seq and luciferase assays are available upon request. Please address requests to Haiyuan Yu (haiyuan.yu@cornell.edu).
Code availability
All analysis scripts are available as R Jupyter notebooks on Github (https://github.com/hyulab/eSTARR).
Extended Data
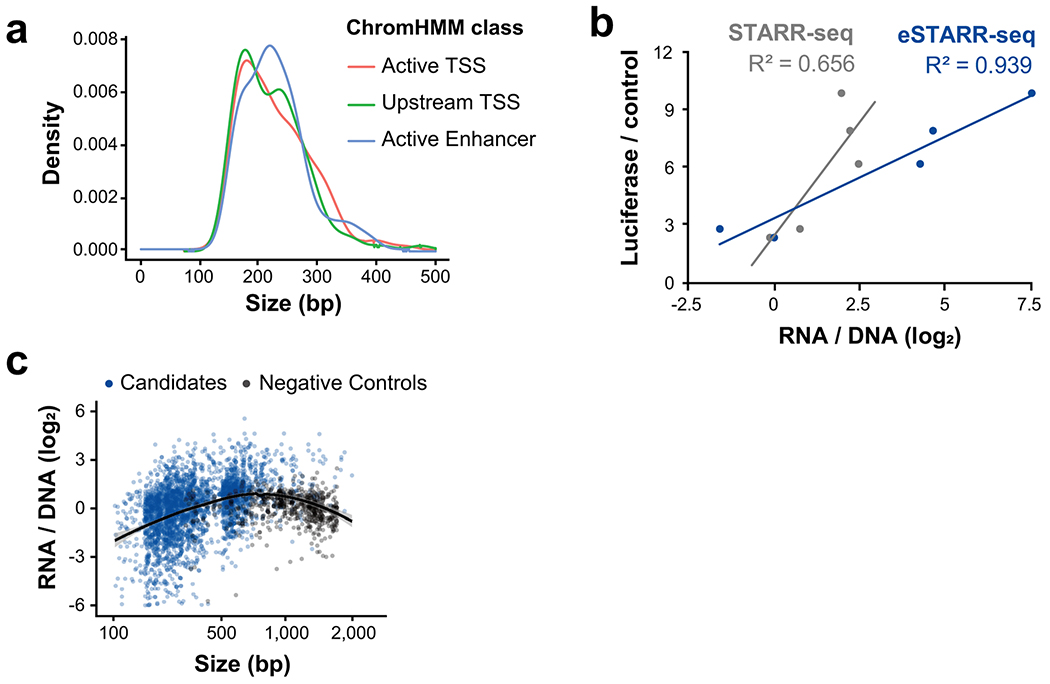
Extended Data Fig. 1. Design and validation of eSTARR-seq and selected candidates.
a. Size distribution of candidates is shown by ChromHMM class.
b. Correlation between luciferase, STARR-seq, and eSTARR-seq reporter activity in HeLa cells. Luciferase and STARR-seq data are from (Arnold et al., 2013).
c. eSTARR-seq activity is shown relative to each elements’ size for both candidate elements (blue) and negative controls (gray). Line indicates a fitted loess curve estimate of size bias for eSTARR-seq and 95% confidence interval in gray.
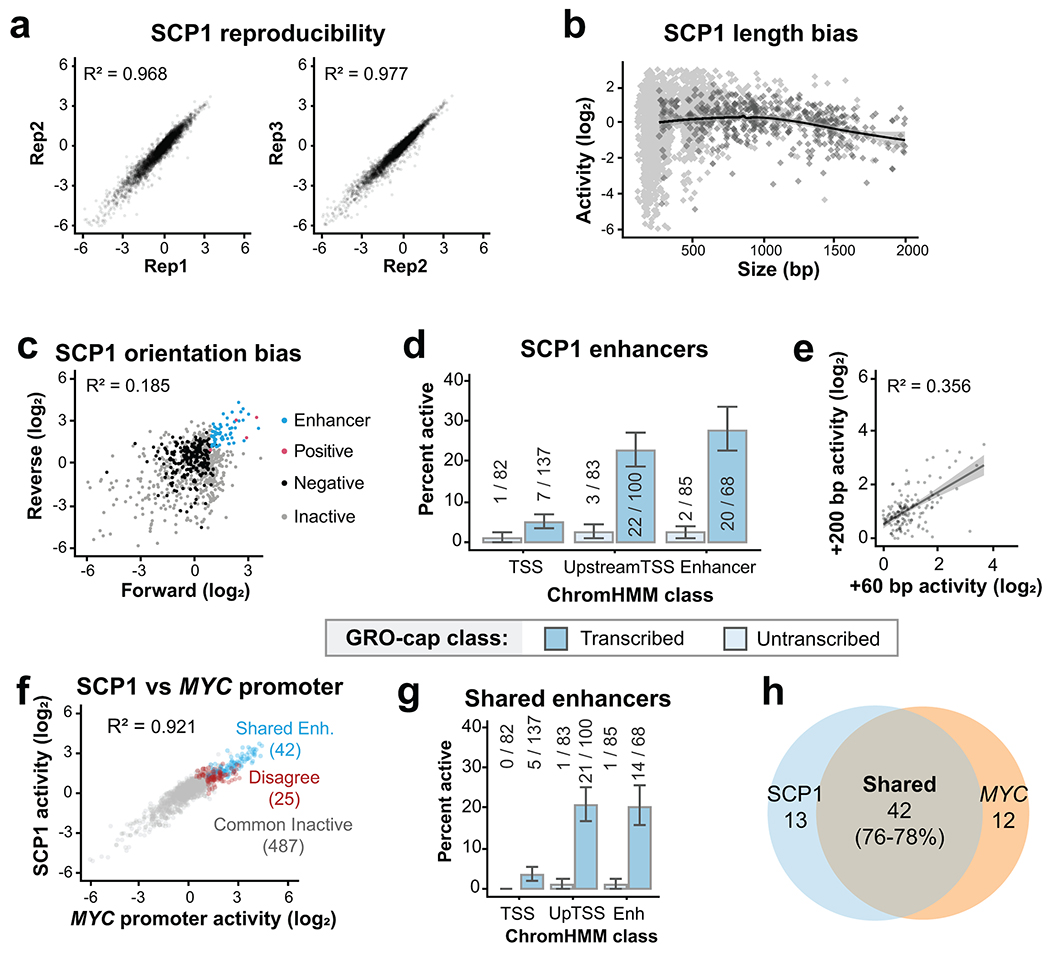
Extended Data Fig. 2. Comparison with the SCP1 promoter.
a. Correlation between replicates using SCP1. b. eSTARR-seq activity vs element length using SCP1, averaged from n=3 transfection replicates. c. eSTARR-seq activity in forward vs reverse cloning orientations using SCP1 (averaged from n=3). d. Percent of elements from each ChromHMM class with significant enhancer activity for SCP1. Error bars indicate standard error calculated for a sample of binary trials, centered on the observed success rate. e. SCP1 eSTARR-seq activity of elements cloned using TSS+60 bp boundaries (x) or TSS+200 boundaries (y). Gray area shows 95% confidence interval of linear regression from n=93 elements. f. eSTARR-seq activity of MYC (x) vs SCP1 (y) as the promoter. Colors indicate enhancers shared by both promoters (blue), active with only one promoter (red), or inactive with both promoters (gray). g. Percent of elements from each ChromHMM class with significant enhancer activity for both MYC promoter and SCP1. Error bars indicate standard error calculated for a sample of binary trials, centered on the observed probability. h. Venn diagram showing overlap of the MYC promoter and SCP1 active enhancer sets.
Extended Data Fig. 3. Validation of strand bias and TSS function from HiDRA.
a. Pie chart indicating the fraction of HiDRA fragments tested in one (gray) or both (gold) orientations. Some fragments have pairings with more than one fragment in the opposing orientation, providing 763,000 distinct pairs.
b. Comparison of HiDRA enhancer activities from opposing orientations of fragment pairs. Color indicates the number of pairs. Gray lines denote approximate statistical cut-off for active enhancers. Quadrants II and III denote orientation-dependent “enhancer” fragment pairs; quadrant IV fragments are active in both orientations.
c. Pie chart indicating the percent of HiDRA fragment pairs classified as inactive, orientation-dependent, and orientation-independent.
d-e. Bar charts indicating the percentage of orientation-independent enhancer calls from HiDRA fragments sample from DHSs within the indicated ChromHMM classes. d, fragments are further classified as untranscribed or transcribed (contains divergent GRO-cap TSSs). P-values are from two-sided Fisher’s exact test between indicated ratio and total enhancer ratio (140/4,367). e, fragments are sampled from different areas around unpaired GRO-cap TSSs (see cartoon and Methods). Raw fragment counts are shown above each bar. Gray line marks the average percent activity of all fragments. P-values are from two-sided Fisher’s exact test between indicated ratio and total enhancer ratio (402/11,579).
All error bars indicate standard error calculated for a sample of binary trials, centered on the observed probability.
Extended Data Fig. 4. Orientation dependence in the HiDRA dataset.
a. Comparison of forward vs reverse cloning orientation for HiDRA fragments overlapping GM12878 DHS peaks. Data points are shown as log2 fold-change of RNA vs DNA read counts. Elements with significantly elevated activity in both orientations are called orientation-independent enhancers (green). Elements with significantly elevated activity in one orientation are called orientation-dependent (black). Remaining fragments are called inactive (gray).
b-c. Percent of orientation-dependent (b) or - independent (c) fragments within each GRO-cap and ChromHMM class. Raw fragment counts are shown above each bar. Gray line marks the percent activity of all fragments judged by the same criteria. P-values are from two-sided Fisher’s exact test between indicated ratio and total enhancer ratio (372/4,367 for b, 41/767 for c). Error bars indicate standard error calculated for a sample of binary trials, centered on the observed probability.
Extended Data Fig. 5. Features of eSTARR-seq enhancers.
a. Scatterplot of activity vs GRO-cap reads from eSTARR enhancers in K562 cells.
b. Metaplots of average H3K27ac, H3K4me3, and H3K4me1 ChIP-seq signal from different element classes defined in K562 cells. Promoters are defined as GRO-cap divergent TSSs within 500 bp of GENCODE gene start, whereas enhancers are defined as GRO-cap divergent TSSs with significant eSTARR activity. Below, ChIP-seq to GRO-cap signal ratio is shown within the window.
c. Metaplots of average H3K27ac, H3K4me3, and H3K4me1 ChIP-seq signal from different element classes defined in GM12878 cells. Promoters are defined as GRO-cap divergent TSSs within 500 bp of GENCODE gene start, whereas enhancers are defined as GRO-cap divergent TSSs with significant HiDRA activity. Below, ChIP-seq to GRO-cap signal ratio is shown within the window. n=860 promoter DHS, 119 transcribed enhancer DHS, 1,100 untranscribed DHS.
Extended Data Fig. 6. Functional dissection of genomic TSS clusters.
a. Comparison of forward vs reverse cloning orientation for all tested TSS clusters. Data points are shown as log2 fold-change vs negative controls (magenta), averaged from three replicates. Positive controls (black) are known MYC or viral enhancers. Clusters with significantly elevated activity in both orientations are called enhancers (green). All other clusters are called inactive (gray).
b. Comparison of sub-element activities within active enhancer clusters. The stronger sub-element is always chosen to be e1, and the weaker sub-element is e2. Gray lines indicate approximate significance cut-offs.
Extended Data Fig. 7. Design and evaluation of synthetic unit pairs.
a. Comparison of sub-element activities within synthetic enhancer clusters. The stronger sub-element is always chosen to be e1, and the weaker sub-element is e2. Gray lines indicate approximate significance cut-offs.
b. Correlation between individual eSTARR-seq activities tested previously and re-tested as controls in the synthetic fusion screen (n=48 elements).
c. Agreement between predicted and observed cluster activities (”C”) for enhancer-containing synthetic pairs.
d. Agreement between predicted and observed cluster activities (”C”) for enhancer-less synthetic pairs.
Extended Data Fig. 8. Genotyping of Cas9 deletion clones.
a. Illustration of genotyping PCR amplicon design and size relative to elements targeted for deletion.
b. Table listing expected amplicon sizes from various genotypes. “-” indicates that no amplification is expected.
c. Gel images from K562 clonal lines used for qRT-PCR experiments in Figure 6. (eNMU clones were generated, genotyped and generously provided by the Shendure lab.) Genotyping PCRs were performed only once, but biological replication was achieved through independent clones.
Supplementary Material
Acknowledgements
The human pSTARR-seq plasmid was a gift from Alexander Stark (Addgene 71509). We thank Drs. Molly Gasperini, Jacob Tome, and Jay Shendure for sharing clonal ΔeNMU K562 cells and helpful advice. We thank Drs. Charles Fulco and Jesse Engreitz for helpful discussions and guidance. This work was supported by grants from the National Institutes of Health (HG009393 to J.T.L. and H.Y., GM25232 to J.T.L., DK115398 and HG008126 to H.Y.). N.D.T. was supported by a Cornell Center for Vertebrate Genomics (CVG) Scholarship and NIH training grant T32HD057854.
Footnotes
Competing interests
None.
References
- 1.Serfling E, Jasin M & Schaffner W Enhancers and eukaryotic gene transcription. Trends in Genetics 1, 224–230 (1985). [Google Scholar]
- 2.Arnold CD et al. Genome-wide quantitative enhancer activity maps identified by STARR-seq. Science 339, 1074–7 (2013). [DOI] [PubMed] [Google Scholar]
- 3.Canver MC et al. BCL11A enhancer dissection by Cas9-mediated in situ saturating mutagenesis. Nature 527, 192–7 (2015). [DOI] [PMC free article] [PubMed] [Google Scholar]
- 4.Tuan D, Solomon W, Li Q & London IM The “beta-like-globin” gene domain in human erythroid cells. Proc Natl Acad Sci U S A 82, 6384–8 (1985). [DOI] [PMC free article] [PubMed] [Google Scholar]
- 5.Orkin SH Regulation of globin gene expression in erythroid cells. Eur J Biochem 231, 271–81 (1995). [DOI] [PubMed] [Google Scholar]
- 6.Fulco CP et al. Systematic mapping of functional enhancer-promoter connections with CRISPR interference. Science 354, 769–773 (2016). [DOI] [PMC free article] [PubMed] [Google Scholar]
- 7.Creyghton MP et al. Histone H3K27ac separates active from poised enhancers and predicts developmental state. Proc Natl Acad Sci U S A 107, 21931–6 (2010). [DOI] [PMC free article] [PubMed] [Google Scholar]
- 8.Heintzman ND et al. Distinct and predictive chromatin signatures of transcriptional promoters and enhancers in the human genome. Nat Genet 39, 311–8 (2007). [DOI] [PubMed] [Google Scholar]
- 9.Dorighi KM et al. Mll3 and Mll4 Facilitate Enhancer RNA Synthesis and Transcription from Promoters Independently of H3K4 Monomethylation. Mol Cell 66, 568–576 e4 (2017). [DOI] [PMC free article] [PubMed] [Google Scholar]
- 10.Henriques T et al. Widespread transcriptional pausing and elongation control at enhancers. Genes & development 32, 26–41 (2018). [DOI] [PMC free article] [PubMed] [Google Scholar]
- 11.Kellis M et al. Defining functional DNA elements in the human genome. Proc Natl Acad Sci U S A 111, 6131–8 (2014). [DOI] [PMC free article] [PubMed] [Google Scholar]
- 12.Ernst J & Kellis M ChromHMM: automating chromatin-state discovery and characterization. Nat Methods 9, 215–6 (2012). [DOI] [PMC free article] [PubMed] [Google Scholar]
- 13.Core LJ et al. Analysis of nascent RNA identifies a unified architecture of initiation regions at mammalian promoters and enhancers. Nature Genetics 46, 1311 (2014). [DOI] [PMC free article] [PubMed] [Google Scholar]
- 14.Kim T-K et al. Widespread transcription at neuronal activity-regulated enhancers. Nature 465, 182 (2010). [DOI] [PMC free article] [PubMed] [Google Scholar]
- 15.Engreitz JM et al. Local regulation of gene expression by lncRNA promoters, transcription and splicing. Nature 539, 452–455 (2016). [DOI] [PMC free article] [PubMed] [Google Scholar]
- 16.Joung J et al. Genome-scale activation screen identifies a lncRNA locus regulating a gene neighbourhood. Nature 548, 343 (2017). [DOI] [PMC free article] [PubMed] [Google Scholar]
- 17.Gu B et al. Transcription-coupled changes in nuclear mobility of mammalian cis-regulatory elements. Science 359, 1050–1055 (2018). [DOI] [PMC free article] [PubMed] [Google Scholar]
- 18.Tippens ND, Vihervaara A & Lis JT Enhancer transcription: what, where, when, and why? Genes & development 32, 1–3 (2018). [DOI] [PMC free article] [PubMed] [Google Scholar]
- 19.Tome JM, Tippens ND & Lis JT Single-molecule nascent RNA sequencing identifies regulatory domain architecture at promoters and enhancers. Nature Genetics 50, 1533 (2018). [DOI] [PMC free article] [PubMed] [Google Scholar]
- 20.Lu F, Portz B & Gilmour DS The C-Terminal Domain of RNA Polymerase II Is a Multivalent Targeting Sequence that Supports Drosophila Development with Only Consensus Heptads. Mol Cell 73, 1232–1242 e4 (2019). [DOI] [PMC free article] [PubMed] [Google Scholar]
- 21.Lu H et al. Phase-separation mechanism for C-terminal hyperphosphorylation of RNA polymerase II. Nature 558, 318–323 (2018). [DOI] [PMC free article] [PubMed] [Google Scholar]
- 22.Andersson R et al. An atlas of active enhancers across human cell types and tissues. Nature 507, 455–461 (2014). [DOI] [PMC free article] [PubMed] [Google Scholar]
- 23.Andersson R Promoter or enhancer, what’s the difference? Deconstruction of established distinctions and presentation of a unifying model. Bioessays 37, 314–23 (2015). [DOI] [PubMed] [Google Scholar]
- 24.Vo Ngoc L, Wang YL, Kassavetis GA & Kadonaga JT The punctilious RNA polymerase II core promoter. Genes Dev 31, 1289–1301 (2017). [DOI] [PMC free article] [PubMed] [Google Scholar]
- 25.Inoue F et al. A systematic comparison reveals substantial differences in chromosomal versus episomal encoding of enhancer activity. Genome Res 27, 38–52 (2017). [DOI] [PMC free article] [PubMed] [Google Scholar]
- 26.Muerdter F et al. Resolving systematic errors in widely used enhancer activity assays in human cells. Nature Methods 15, 141 (2017). [DOI] [PMC free article] [PubMed] [Google Scholar]
- 27.Klein J et al. A systematic evaluation of the design, orientation, and sequence context dependencies of massively parallel reporter assays. bioRxiv, 576405 (2019). [DOI] [PMC free article] [PubMed] [Google Scholar]
- 28.Kristjándsóttir K et al. Population-scale study of eRNA transcription reveals bipartite functional enhancer architecture. bioRxiv, 426908 (2018). [DOI] [PMC free article] [PubMed] [Google Scholar]
- 29.Mikhaylichenko O et al. The degree of enhancer or promoter activity is reflected by the levels and directionality of eRNA transcription. Genes & development 32, 42–57 (2018). [DOI] [PMC free article] [PubMed] [Google Scholar]
- 30.Andersson R, Sandelin A & Danko CG A unified architecture of transcriptional regulatory elements. Trends Genet 31, 426–33 (2015). [DOI] [PubMed] [Google Scholar]
- 31.Scruggs BS et al. Bidirectional Transcription Arises from Two Distinct Hubs of Transcription Factor Binding and Active Chromatin. Mol Cell 58, 1101–12 (2015). [DOI] [PMC free article] [PubMed] [Google Scholar]
- 32.Paulson M, Press C, Smith E, Tanese N & Levy DE IFN-Stimulated transcription through a TBP-free acetyltransferase complex escapes viral shutoff. Nature Cell Biology 4, 140–147 (2002). [DOI] [PubMed] [Google Scholar]
- 33.Zabidi MA et al. Enhancer-core-promoter specificity separates developmental and housekeeping gene regulation. Nature 518, 556–9 (2015). [DOI] [PMC free article] [PubMed] [Google Scholar]
- 34.Haberle V et al. Transcriptional cofactors display specificity for distinct types of core promoters. Nature 570, 122–126 (2019). [DOI] [PMC free article] [PubMed] [Google Scholar]
- 35.Grossman SR et al. Positional specificity of different transcription factor classes within enhancers. Proceedings of the National Academy of Sciences 115, E7222–E7230 (2018). [DOI] [PMC free article] [PubMed] [Google Scholar]
- 36.Yang X & Vingron M Classifying human promoters by occupancy patterns identifies recurring sequence elements, combinatorial binding, and spatial interactions. BMC Biol 16, 138 (2018). [DOI] [PMC free article] [PubMed] [Google Scholar]
- 37.Wang X et al. High-resolution genome-wide functional dissection of transcriptional regulatory regions and nucleotides in human. Nat Commun 9, 5380 (2018). [DOI] [PMC free article] [PubMed] [Google Scholar]
- 38.Gasperini M et al. A Genome-wide Framework for Mapping Gene Regulation via Cellular Genetic Screens. Cell 176, 377–390 e19 (2019). [DOI] [PMC free article] [PubMed] [Google Scholar]
- 39.Dukler N, Gulko B, Huang Y-F & Siepel A Is a super-enhancer greater than the sum of its parts? Nature Genetics 49, 2 (2016). [DOI] [PMC free article] [PubMed] [Google Scholar]
- 40.Shin HY et al. Hierarchy within the mammary STAT5-driven Wap super-enhancer. Nature Genetics 48, 904 (2016). [DOI] [PMC free article] [PubMed] [Google Scholar]
- 41.Kwak H, Fuda NJ, Core LJ & Lis JT Precise maps of RNA polymerase reveal how promoters direct initiation and pausing. Science 339, 950–3 (2013). [DOI] [PMC free article] [PubMed] [Google Scholar]
- 42.Smith RP et al. Massively parallel decoding of mammalian regulatory sequences supports a flexible organizational model. Nat Genet 45, 1021–1028 (2013). [DOI] [PMC free article] [PubMed] [Google Scholar]
- 43.Vierstra J et al. Mouse regulatory DNA landscapes reveal global principles of cis-regulatory evolution. Science 346, 1007–12 (2014). [DOI] [PMC free article] [PubMed] [Google Scholar]
- 44.Boehning M et al. RNA polymerase II clustering through carboxy-terminal domain phase separation. Nat Struct Mol Biol 25, 833–840 (2018). [DOI] [PubMed] [Google Scholar]
- 45.Shao W, Alcantara SG & Zeitlinger J Reporter-ChIP-nexus reveals strong contribution of the Drosophila initiator sequence to RNA polymerase pausing. Elife 8, e41461 (2019). [DOI] [PMC free article] [PubMed] [Google Scholar]
- 46.Larsson AJM et al. Genomic encoding of transcriptional burst kinetics. Nature 565, 251–254 (2019). [DOI] [PMC free article] [PubMed] [Google Scholar]
- 47.Fukaya T, Lim B & Levine M Enhancer Control of Transcriptional Bursting. Cell 166, 358–368 (2016). [DOI] [PMC free article] [PubMed] [Google Scholar]
- 48.Hay D et al. Genetic dissection of the alpha-globin super-enhancer in vivo. Nat Genet 48, 895–903 (2016). [DOI] [PMC free article] [PubMed] [Google Scholar]
- 49.Huang J et al. Dynamic Control of Enhancer Repertoires Drives Lineage and Stage-Specific Transcription during Hematopoiesis. Dev Cell 36, 9–23 (2016). [DOI] [PMC free article] [PubMed] [Google Scholar]
- 50.Kim HS et al. Pluripotency factors functionally premark cell-type-restricted enhancers in ES cells. Nature 556, 510–514 (2018). [DOI] [PMC free article] [PubMed] [Google Scholar]
Methods-only references
- 51.Wei X et al. A massively parallel pipeline to clone DNA variants and examine molecular phenotypes of human disease mutations. PLoS Genet 10, e1004819 (2014). [DOI] [PMC free article] [PubMed] [Google Scholar]
- 52.Arad U Modified Hirt procedure for rapid purification of extrachromosomal DNA from mammalian cells. Biotechniques 24, 760–2 (1998). [DOI] [PubMed] [Google Scholar]
- 53.Picelli S et al. Tn5 transposase and tagmentation procedures for massively scaled sequencing projects. Genome Res 24, 2033–40 (2014). [DOI] [PMC free article] [PubMed] [Google Scholar]
- 54.Wang Z, Martins AL & Danko CG RTFBSDB: an integrated framework for transcription factor binding site analysis. Bioinformatics 32, 3024–6 (2016). [DOI] [PMC free article] [PubMed] [Google Scholar]
- 55.Chow RD et al. In vivo profiling of metastatic double knockouts through CRISPR-Cpf1 screens. Nat Methods 16, 405–408 (2019). [DOI] [PMC free article] [PubMed] [Google Scholar]
- 56.Ran FA et al. Genome engineering using the CRISPR-Cas9 system. Nat Protoc 8, 2281–2308 (2013). [DOI] [PMC free article] [PubMed] [Google Scholar]
- 57.Stringer BW et al. A reference collection of patient-derived cell line and xenograft models of proneural, classical and mesenchymal glioblastoma. Sci Rep 9, 4902 (2019). [DOI] [PMC free article] [PubMed] [Google Scholar]
Associated Data
This section collects any data citations, data availability statements, or supplementary materials included in this article.
Supplementary Materials
Data Availability Statement
eSTARR-seq data are available through the ENCODE data portal (www.encodeproject.org) under accessions ENCSR514FNW, ENCSR729EGU, and ENCSR585AGE. Processed GRO-cap data were obtained from Gene Expression Omnibus expression GSE60456. Raw sequencing files for the HiDRA study were obtained from SRA accession SRP118092. All candidate regulatory element clones generated in this study and used for eSTARR-seq and luciferase assays are available upon request. Please address requests to Haiyuan Yu (haiyuan.yu@cornell.edu).


