

Abstract
Measuring the binding kinetics of single proteins represents one of the most important and challenging tasks in protein analysis. Here we show that this is possible using a surface plasmon resonance (SPR) scattering technique. SPR is a popular label-free detection technology because of its extraordinary sensitivity, but it has never been used for imaging single proteins. We overcome this limitation by imaging scattering of surface plasmonic waves by proteins. This allows us to image single proteins, measure their sizes, and identify them based on their specific binding to antibodies. We further show that it is possible to quantify protein binding kinetics by counting the binding of individual molecules, providing a digital method to measure binding kinetics and analyze heterogeneity of protein behavior. We anticipate that this imaging method will become an important tool for single protein analysis, especially for low volume samples, such as single cells.
Editor’s summary
Plasmonic scattering microscopy (PSM) enables the imaging of single proteins on SPR instruments. The method enables measurement of protein size and binding kinetics and is fully compatible with simultaneous traditional SPR measurements.
Introduction
Determining molecular binding is critical to the screening of drugs, detection of disease biomarkers, and understanding of biological processes at the molecular level1-2. To meet this need, surface plasmon resonance (SPR) has been developed and become an indispensable tool for detecting molecules and quantifying their binding kinetics without labels3-6. The recent development of SPR microscopy (SPRM) has further advanced the field by offering high spatial resolution7, allowing imaging of single cells8-9, sub-cellular organelles10, virions11, nanoparticles12, nanobubbles13, and exosomes14. However, to our knowledge imaging single molecules with SPR has not been achieved. The ability to image single proteins will enable analysis of protein heterogeneity, measurement of intrinsic molecular properties, such as mass, and study of molecular binding processes at a level of detail that is not possible with the current ensemble approach.
Here we show that single proteins can be directly imaged with an SPR imaging system. We describe the imaging setup and principle, calibrate the image contrast using nanoparticles of different sizes, demonstrate imaging of single proteins, and perform various control experiments to validate the results. We also show that single protein molecules can be detected and identified based on their sizes and specific binding to the corresponding antibodies. Additionally, we demonstrate quantification of protein binding kinetics by digitally counting and analyzing the binding and unbinding of individual molecules.
Several label-free optical technologies have been demonstrated to detect single proteins, including two with imaging capability15-19. One is an indirect method, which heats a protein solution with laser and images the heat-induced change in the refractive index of solvent surrounding the protein optically20. Another imaging method is based on interferometric scattering (iSCAT)21-22. Compared to these technologies, SPR has several unique features. First, the evanescent field intensity is localized within ~100 nm from the SPR sensor surface (e.g., gold-coated glass slide), making it immune to interference of molecules and impurities in the bulk solution, thus particularly suitable for studying surface binding. Second, there is a large enhancement (20-30 times) in the field near the sensor surface, which is responsible for the high sensitivity of SPR. Finally, the resonance condition of SPR depends on the refractive index near the sensor surface, such that surface charging23, small molecules or ions24, and biochemical reactions25 that do not scatter light strongly can also be measured with the same setup from the simultaneously recorded traditional SPR images.
Results
Principles of plasmonic scattering imaging
We excite surface plasmonic waves by directing light at an appropriate angle via an oil-immersion objective onto a gold-coated glass slide placed on the objective (Figure 1a). In the SPRM, light reflected from the gold surface is collected to form an SPR image, which is described by26
| (1) |
where Ep is the excited plasmonic wave, Es describes the scattering of the plasmonic wave by a protein on the sensor surface, and Er is the reflection of the incident wave from the backside of the gold surface. The SPRM image contrast is determined by the interference between the planar plasmonic wave and the spherical scattered plasmonic wave, given by 2∣Ep∣∣Es∣cos(θ), where θ is the phase difference between the two waves, which produces a spot at the location of the protein with a parabolic tail. Es is proportional to the optical polarizability of the protein, which scales with the mass of the protein or d3, where d is the diameter.
Figure 1. Setup and principle of plasmonic scattering microscopy (PSM).

(a) Simplified sketch of the optical setup, where surface plasmonic waves (Ep) are excited by light from the bottom of a gold-coated glass slide and scattering of the plasmonic waves by a particle or protein (Es) and by the gold surface (Eb) is collected from the top to form a PSM image. (b) Raw time sequence of PSM images of 26 nm polystyrene nanoparticles (left), and background and drift corrected PSM image (right). A detailed description of the setup and imaging processing can be found in Supplementary Figure 1, Supplementary Note 4 and Supplementary Note 7. The experiment is repeated by 5 times with similar results.
Er in Eq. 1 produces a large background in the SPRM image, which masks the weak scattered wave (Es) from a single protein. To overcome this difficulty, we image plasmonic waves scattered by the protein with a second objective placed on top of the sample, in addition to recording the SPRM images from the bottom (Figure 1a; Supplementary Figure 1 for details). This avoids the collection of the strong reflection, allowing ~30000 times higher incident light intensity than typical SPRM for imaging single proteins (Supplementary Note 1), and also eliminates the parabolic tail, providing a high contrast image (Supplementary Figure 2 and Note 2). At first glance, the image contrast should scale according to ∣Es∣2 ~ d6. This would lead to a rapid drop in the image contrast with decreasing d, making it challenging to detect small proteins. However, the gold surface is not atomically flat. Atomic Force Microscopy has revealed nanometer-scaled gold islands (Supplementary Note 3), which also scatter the surface plasmonic waves to create a background (Eb)27-29. Consequently, the plasmonic image is given by
| (2) |
where β is the phase difference between light scattered by the protein and by the gold surface. The interference term, 2∣Eb∣∣Es∣cos(β), in Eq. 2 produces image contrast that scales with d3, or the protein mass. To differentiate this plasmonic imaging method from SPRM, we refer it to as plasmonic scattering microscopy (PSM). PSM images own two characteristics. First, the pattern of the bright spot created by analyte usually looks significantly more complex than an Airy pattern (Figure 1b), which can also be seen in other kind of evanescent light scattering microscopy30-31. This pattern is difficult to analyze with two-dimensional Gaussian fitting, so we determined the image intensity by integrating the intensities of all pixels within the Airy disk (Supplementary Figure 2 and Note 4). Second, the analyte image intensity is independent of the inhomogeneous background resulting from random distribution of surface roughness (Supplementary Note 5). The missing correlation between analyte induced intensity changes and somewhat random ∣Eb∣2 suggests a comparable homogenous reference field32-33, which may result from the delocalization feature of surface plasmonic waves26,28.
To obtain a high contrast PSM image, it is necessary to remove ∣Eb∣2 in Eq. 2, which is achieved with the following imaging processing algorithm. Starting from the images captured with a high frame rate, we first average the image frames over 50 ms to suppress random noise in the images. We then obtain differential images by subtracting a previous frame from each frame. The subtraction removes background features and captures the binding of a protein to the surface on Nth image frame. To view all the proteins on the surface on Nth frame, we integrate the differential images from 1 to N. Due to thermal and mechanical drift (Supplementary Note 6), we further introduce a drift correction mechanism to ensure effective removal of the background for visualization of cumulative binding events. We describe the imaging processing algorithm in detail in Supplementary Notes 4 and 7.
Detection of nanoparticles
We validated PSM by imaging polystyrene nanoparticles with diameters (d) varying from 26 nm to 194 nm. To avoid saturating the sensor surface, 26 nm, 44 nm, and 65 nm nanoparticles were measured on one gold-coated glass slide, and 99 nm, 145 nm, 194 nm nanoparticles were measured on another slide (Supplementary Note 8). For each diameter, the nanoparticles dissolved in PBS buffer were introduced into a solution well mounted on the gold surface, and the binding of the nanoparticles to the surface was recorded over time with optimal incident light intensity and camera exposure time (Supplementary Table 1 and Note 9). Figure 2a is a PSM image of 26 nm polystyrene nanoparticles showing cumulative binding events at different locations within 60 s, which reveals the individual nanoparticles as bright spots. The number in the color bar represents the grayscale intensity range prior to the pseudo color processing. The dynamic binding of single 26 nm nanoparticles is more clearly shown in Supplementary Video 1. We tracked and counted the individual particle binding events over 5 mins and constructed an image intensity histogram from the multiple nanoparticles. The image intensity histogram of the individual nanoparticles follows a Gaussian distribution (Figure 2a). There is a small second peak, which may be attributed to the formation of dimers or two particles binding to the nearby surface simultaneously with distance smaller than the diffraction limit. Increasing the nanoparticle size, PSM image contrast increases, which is clearly shown by the intensity histograms (Figures 2a-f).
Figure 2. Validation and calibration of PSM with polystyrene nanoparticles of different diameters.

(a)-(f) PSM images and image intensity histograms of polystyrene nanoparticles, where the solid lines are Gaussian fittings. In each histogram, a small second peak (blue line) is attributed to formation of dimers or two particles binding to the nearby surface simultaneously with distance smaller than the diffraction limit. Incident light intensity and camera exposure time are 200 W/cm2 and 5 ms for 26, 44, and 65 nm nanoparticles, 10 W/cm2 and 10 ms for 99 nm, 10 W/cm2 and 5 ms for 145 nm, and 10 W/cm2 and 2 ms for 194 nm, respectively. The image intensity was normalized with incident light intensity of 200 W/cm2 and camera exposure time of 5 ms. The sample sizes are presented in each subfigure. (g) PSM image intensity vs. particle diameter. The image intensity at the center of error bar for each diameter is obtained from the mean value of the corresponding histogram in (a)-(f). The error bars indicate the FWHM of the Gaussian fitting of corresponding histograms. The experiments are repeated by 5 times with similar results.
Plotting the mean image intensity vs. nanoparticle diameter in logarithmic scale reveals two regimes, corresponding to large and small nanoparticles (Figure 2g), where the z-distance dependence of surface plasmonic wave is considered (Supplementary Note 10). In the large nanoparticle regime (diameters > 99 nm), the image contrast follows a power law of d5.6, where the exponent is close to 6. This is expected because light from the nanoparticles dominates, such that measured image contrast scales with ∣Es∣2 according to Eq. 2. However, in the small nanoparticle regime (< 65 nm), the image contrast scales with d3, which is also expected because the interference term, 2∣Eb∣∣Es∣cos(β), in Eq. 2 dominates. Proteins are typically smaller than 30 nm, so the cubic power law of d3 provides a good description of the PSM image contrast for proteins.
Detection of single proteins
To demonstrate the capability of PSM for imaging single proteins, we studied human immunoglobulin M (IgM) and human immunoglobulin A (IgA), and also compared the images with those of 26 nm polystyrene nanoparticles (Figure 3). The study was carried out by flowing each protein solution over the sensor surface while recording the binding of individual protein molecules on the surface. Figure 3a shows a representative image of IgM showing cumulative binding events at different locations within 60 s, where each bright spot is a single IgM molecule, and Supplementary Video 2 shows the binding process over time. We tracked and counted the individual protein binding events over 5 mins and constructed an image intensity histogram from the multiple protein molecules (Figure 3b). By fitting the histogram with a Gaussian distribution, the mean intensity of each protein was extracted, from which the diameter of the protein was determined using the calibration curve shown in Figure 2g (Supplementary Note 11). The diameter of IgM was found to be 21.9 ± 2.2 nm, which is comparable to 23.7 ± 5.6 nm, the hydrodynamic diameter measured by dynamic light scattering (DLS). For IgA, a smaller protein (385 kDa), the diameter was found to be 15.5 ± 2.1 nm, also consistent with the diameter by DLS (14.6 ± 5.1 nm) (Figures 3c and d). The good agreement in protein size between PSM and DLS confirms that the bright spots in the PSM are single protein molecules. We compared the image contrasts of IgM and IgA with that of 26 nm polystyrene nanoparticles (Figures 3e and f), which all fall on the same calibration curve, further supporting the imaging of single proteins with PSM (Figure 3g).
Figure 3. Imaging single proteins with PSM.

(a, c and e) PSM images of immunoglobulin M (IgM) molecules, immunoglobulin A (IgA) molecules, and 26 nm polystyrene nanoparticles. (b, d and f) Corresponding image intensity histograms, where the solid lines are Gaussian fittings. A small secondary peak (blue) in each histogram is attributed to formation of dimers or two particles binding to the nearby surface simultaneously with distance smaller than the diffraction limit. Incident light intensity: 3 kW/cm2 and exposure time: 1 ms. The sample sizes are presented in each subfigure. (g) PSM image intensity vs. particle or molecular diameter. The image intensity at the center of error bar for each diameter is the mean value of the corresponding histogram in (b, d and f). The error bars indicate the FWHM of the Gaussian fitting of corresponding histograms. The experiments are repeated by 4 times with similar results.
Identification of single proteins
To identify single proteins with PSM, we coated the sensor surface with anti-IgA and studied the specific binding of IgA to anti-IgA (Figure 4a). High antibody coverage of ~20000 molecules per Airy disk was employed throughout all experiments to ensure uniform receptor surface coverage and sufficient capture probability to detect the specific binding within a reasonable time. Upon exposure to IgA, the binding of single IgA molecules to anti-IgA took place immediately, which was observed as the bright spots appearing one at a time on the surface. Supplementary Video 3 reveals the entire binding process and Figure 4a shows a few snapshots. We counted the number of the bright spots and constructed a histogram, showing a major peak due to single IgA molecules (Figure 4b). As a control experiment, we flowed IgM over the anti-IgA coated sensor surface. Unlike the case of IgA, where a bright spot appears and stays on the surface, bright spots (IgM molecules) show up on the surface only transiently (Supplementary Video 3 and Figure 4c), which is expected because IgM does not bind specifically to anti-IgA. To further confirm that we are performing single-molecule measurement, the IgA coverage on anti-IgA modified gold surface was measured with ensemble SPR and PSM simultaneously (Supplementary Figure 3). The coverage was determined to be ~115 pg/mm2 by ensemble SPR, and ~93 pg/mm2 by multiplying the molecular weight of 385 kDa with absorbed molecule numbers recognized by PSM. The coverage determined by PSM is consistent with the ensemble SPR measurement result, confirming that the PSM can measure protein mass, which is a direct experimental evidence showing that PSM detects single proteins22, 34.
Figure 4. PSM identification of single proteins using antibodies.
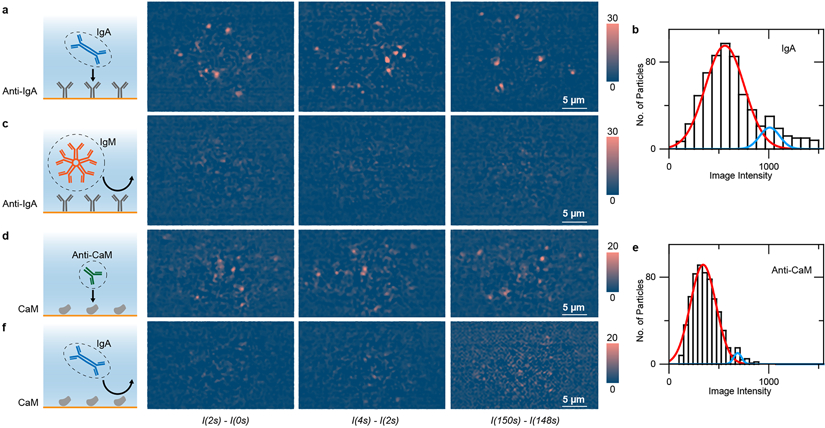
(a) Differential PSM snapshots showing binding of IgA to anti-IgA immobilized on the surface. (b) Intensity histogram of IgA molecules, where the solid lines are Gaussian fitting. (c) Negative control experiment: Exposing of IgM to anti-IgA surface. (d) Binding of anti-CaM to CaM immobilized on the surface. (e) Intensity histogram of anti-CaM molecules on CaM, where the solid lines are Gaussian fitting. (f) Negative control experiment: Exposing of IgA to CaM. Incident light intensity: 2 kW/cm2; camera exposure time: 2 ms. The experiments are repeated by 3 times with similar results.
As an additional example for PSM identification of proteins using antibodies, we measured the binding of anti-calmodulin (anti-CaM, MW=150 kDa) to calmodulin (CaM) coated surface using a similar procedure. A few snapshots of the binding process are shown in Figure 4d, and the full video is presented in Supplementary Video 3. We constructed an image intensity histogram from the PSM images of IgG and obtained the mean intensity by fitting the histogram with a Gaussian function (Figure 4e), from which the diameter of IgG was found to be 12.9 ± 2.5 nm. This value agrees with the hydrodynamic diameter measured by DLS (12.0 ± 2.0 nm) and also with the value reported in literature35. We performed a control experiment by introducing IgA to the CaM coated surface and did not observe binding of IgA to CaM, which confirms the specific binding of anti-CaM to CaM (Supplementary Video 3 and Figure 4f).
Quantification of protein binding kinetics
The most powerful application of SPR is to quantify molecular binding kinetics. We show here that PSM can measure binding kinetics at the single-molecule level by counting the binding and unbinding of single molecules. As a demonstration we studied IgA binding to anti-IgA (Figure 5a). We first flew IgA of different concentrations over an anti-IgA coated sensor surface to study the binding process, then flew PBS buffer over the sensor surface to allow study of unbinding of IgA from anti-IgA. We tracked the binding and unbinding processes by counting the individual IgA molecules in real-time. Plotting the number of bound IgA vs. time produces binding kinetics curves. Fitting of the curves with the first order binding kinetics model determines the association (kon) and dissociation (koff) rate constants, which are 2.3 × 10⁵ M−1 s−1 and 1.6 × 10⁻⁴ s−1, respectively. From kon and koff, the equilibrium dissociation constant (KD=koff/kon) is determined to be 696 pM. These values are in good agreement with the results obtained with the ensemble SPR (Supplementary Note 12). The mean intensity changes associated with the binding and unbinding of events are consistent with the size of an IgA molecule, confirming the detection of single molecules (Figure 5b). We performed a control experiment by introducing 5 nM IgM to the anti-IgA coated surface and observed no obvious binding (Figure 5a).
Figure 5. Single molecule measurement of binding kinetics with PSM.

(a) Kinetics of IgA binding to anti-IgA determined by digitally counting of the binding/unbinding of single molecules. (b) Histograms of intensity changes associated with binding and unbinding of individual IgA molecules, where the solid lines are Gaussian fittings. (c)-(e) Examples of different binding behaviors observed at the single molecule level. Scale bars of the PSM images: 2 μm. The experiments are repeated by 3 times with similar results. (f) Bound and unbound residence time distributions for IgA molecule 3, where the red lines are fittings of the data to exponential decays, from which kon, koff and KD of IgA molecule 3 are determined to be (1.1 ± 0.1) × 109 M−1 s−1, 7.4 ± 0.2 s−1, and 6.7 ± 0.4 nM, respectively. More detailed analysis and discussion are provided in Supplementary Figure 5 and Supplementary Table 2.
In addition to binding kinetic analysis by digital counting, PSM also allows monitoring of individual binding and unbinding events. Differential video (Supplementary Video 4) shows the bright spots as single IgA molecular binding events and dark spots as unbinding events. To more realistically visualize the binding process, we integrate the differential frames to create Supplementary Video 5 (Supplementary Note 7). This capability allows us to monitor the heterogeneity of protein behavior, due to different conformation, orientation and location on the sensor surface. To illustrate this point, Figure 5c-e and Supplementary Video 5 show three different behaviors of binding of individual IgA molecules, including an IgA molecule 1) hits and stays on the surface, 2) hits the surface and stays for several seconds, then leaves the surface, and 3) binds and unbinds rapidly. From the temporal image intensity profile of IgA molecule 3 (Supplementary Figure 4), the distributions of residence times of the bound and unbound states are obtained as shown in Figure 5f, from which the binding kinetics of this single IgA molecule were determined. As listed in Figure 5 caption, the kon, koff, and KD are quite different from those calculated from Figure 5a. This is because Figure 5a measures the kinetics of multiple IgA molecules binding to multiple receptors, but Figure 5e measures the kinetic of a single IgA molecule interacting with multiple receptors on sensor surface. Analyzing the residence times for different proteins reveals a large variability, which indicates heterogeneity of the protein bindings (Supplementary Figure 5 and Table 2). The interaction of IgA with antibody has high affinity (sub-nM KD), which means slow koff and few unbound events can be observed for analyzing the heterogeneity of protein behavior in a reasonable amount of time. Therefore, IgA molecules with very long residence time were underrepresented in Supplementary Table 2 and the mean KD obtained from the measured individual IgA molecules is biased toward the lower affinity end. To more confidently illustrate single molecule binding kinetics measurement capability of PSM, a lower affinity binding pair, the interaction between BSA and IgM was measured by ensemble SPR and PSM simultaneously (Supplementary Figure 6). Analysis of single molecule kinetics with PSM revealed the existence of KD distribution, while the mean value of KD is in good agreement with ensemble SPR measured result, further confirming that the PSM permits the analysis of the heterogeneity of protein behavior.
Discussion
The image contrast of PSM arises from the interference of light scattered from an object and a reference, which is analogous to coherent bright field imaging36, Michelson type techniques37-38, SPRM, iSCAT21-22 and an interference optical imaging method39. However, the mechanism of light scattering and the reference in each technique is different. Both SPRM and PSM detect scattering of surface plasmonic waves, which are localized near the sensor surface with 20-30x intensity enhancement. The fundamental detection limit of these label-free imaging methods is due to shot noise originated from the finite number of photons captured by the camera. In the present PSM setup, we found that the noise was dominated by shot noise, which is demonstrated by analyzing the power dependence of the standard deviation of PSM image intensity (Supplementary Note 6)40. For an integration time of 50 ms, the shot noise limits the signal-to-noise ratio (S/N) of PSM to ~11 for IgA and ~3 for a 10 nm diameter protein (incident light intensity of 2 kW/cm2). One way to improve S/N is to increase the incident light intensity. With the large plasmonic enhancement, one can achieve the same S/N with either lower incident light power or wider field of view compared with non-plasmonic methods. The chip to chip variation of PSM measurement of 26 nm polystyrene particles among 5 different slides is ~10% (Supplementary Note 13).
PSM can quantify protein binding kinetics by counting the binding of individual molecules, which offer several distinct advantages over the ensemble SPR. First, PSM measures molecular binding directly, rather than a shift in the resonant angle measured by the ensemble SPR, which depends on the refractive index of the solution and must be corrected for accurate binding kinetics measurement. Second, the present method is based on digital counting, rather than an analog signal (e.g., resonant angle), making it immune to thermal or mechanical drift, a common issue in the ensemble SPR. Third, the present PSM determines the number and size of molecules independently. In contrast, the resonant angle measured by the ensemble SPR depends on both quantities, making it difficult to determine them independently. This capability can quantify protein expression level and differentiate binding of impurity molecules in the sample from that of the target protein base on the size difference. Finally, the single molecule imaging capability allows monitoring of individual binding and unbinding events for analyzing the heterogeneity of protein behaviors.
We also note that our setup can perform PSM and SPR measurements simultaneously, thus allowing us to retain the capabilities of the ensemble SPR, including detection of surface charging23, small molecules or ions24, and biochemical reactions25. For example, Calcium ions can be easily detected by ensemble SPR on CaM modified surface, because the absorption and dissociation of calcium ions change the charge near the surface, which can lead to ensemble SPR intensity variation25. Meanwhile, the PSM can hardly detect this variation because single ion does not scatter light strongly (Supplementary Figure 7).
We have demonstrated SPR imaging of single proteins by measuring scattering of plasmonic waves. For large particles (>100 nm), the image contrast scales with sixth power of the particle diameter, which is expected for light scattering from isolated particles. However, decreasing the particle size, it transitions to a cubic power dependence of the diameter, due to the interference of light scattered by the particle and by the sensor surface. In addition, we show that single proteins can be imaged and identified based on their specific binding to the corresponding antibodies on the sensor surface. Finally, we show that PSM allows quantification of single protein binding kinetics by digital counting of the individual binding events. Compared to the traditional SPR, PSM provides the protein size and number information in addition to digital counting-based binding kinetic analysis. PSM takes advantage of surface roughness, which is usually considered as a noise source in imaging applications. Future study on the details of the surface roughness generated reference field and its interplay with the scattered field will help fully understand the mechanism, and promote broader applications of this surface phenomenon. We anticipate that PSM, especially when used in combination with SPR, will become a powerful single protein analysis tool for studying various molecular processes, including conformation changes, molecular binding and post-translational modifications of proteins, especially for small volume samples, such as single cells and exosomes.
Online methods
Materials.
Polystyrene nanoparticles were purchased from Bangs Laboratories. Phosphate-buffered saline (PBS) was purchased from Corning and filtered with 0.22 μm filters (Millex). Human plasma IgM and human colostrum IgA were purchased from Athens Research and Technology. Anti-calmodulin (IgG) was purchased from Invitrogen. Calmodulin and bovine serum albumin (BSA) were purchased from Sigma-Aldrich. N-ethyl-N’-(dimethylaminopropyl) carbodiimide (EDC) and N-hydroxysulfosuccinimide (Sulfo-NHS) were purchased from Thermo Fisher Scientific. Dithiolalkanearomatic PEG6-COOH was purchased from Sensopath Technologies. Other chemicals were from Sigma-Aldrich. DI water with resistivity of 18.2 MΩ/cm was filtrated with 0.22 μm filter and used in all experiments.
Experimental setup.
A 25 mW superluminescent light emitting diode (SLED) (SLD-260-UHP, Superlum) with central wavelength at 670 nm is used as light source. Light from the SLED is conditioned by a lens group, and then focused to the back focal plane of a 60x objective (NA = 1.49) by a tube lens with focal length of 400 mm. The incident angle was adjusted by a manual translation stage to reach surface plasmon resonance (Thorlabs, Newton, NJ). Light reflected from the gold-coated glass slide is also collected by a camera (Pike F-032B, Allied Vision) for helping to find the resonance angle. Scattered light from the protein and gold surface is collected by a 50x objective (NA = 0.42) to form a PSM image by a second camera (MQ003MG-CM, XIMEA). More detailed schematic representation of the optics can be found in Supplementary Figure 1. The incident light intensity and camera exposure time were optimized for each measurement (Supplementary Table 1 and Supplementary Note 9).
Surface functionalization.
Gold coated glass slides were fabricated by coating a BK7 glass cover slides with 1 nm Cr followed by 47 nm gold via thermal evaporation (PVD75 E-beam/Thermal Evaporator, Kurt J. Lesker Company). Prior to coating, the gold surface was rinsed by ethanol and deionized water twice, and then annealed with hydrogen flame to remove surface contaminants. The gold surface of each glass slide was modified with carboxyl groups by incubation with 1 mM dithiolalkanearomatic PEG6-COOH for 1 hour. Then the surface was incubated in 0.05 M NHS/0.2 M EDC for 30 min to activate the carboxyl groups. After rinsing with PBS, 20 nM anti-IgA or calmodulin was applied to the surface and incubated for 30 min to allow immobilization. At last, the surface was incubated in 1 mg/ml BSA for 10 min to block non-specific binding sites.
Data processing.
The raw image sequence captured at high frame rate (200 ~ 1000 fps) was converted to a 20 fps averaged image sequence, by averaging images over every 50 ms using MATLAB program as shown in Supplementary Note 14 or the real time averaging function of the camera recording software (XIMEA CamTool), in order to suppress random noise in the images and to reduce the data size. To remove the background, a 20-fps differential image sequence was obtained by subtracting the previous frame from the present frame of the averaged image sequence using Image Calculator Plugin in ImageJ (Fiji). To minimize digital noise of the differential image sequence, a low-pass spatial filter was applied, which is realized by ImageJ (Fiji)41, and the source code was shown in Supplementary Note 15. The TrackMate plugin in ImageJ was employed to find and count particles or molecules42. The PSM intensity of a particle or molecule was determined by integrating the intensities of all pixels within the Airy disk (red circles in Supplementary Figure 2). For wavelength of 670 nm and objective numerical aperture of 0.42, the diameter of Airy disk was estimated to be 0.67/0.42 ~ 1.60 μm, corresponding to ~10 pixels in diameter in the image. Origin 2019 was used to create data plots and histograms. We describe the data processing algorithm in detail in Supplementary Note 4 and Supplementary Note 7. Scrubber 2.0a was used to determine the association and dissociation rate constants by fitting the curves in Figure 5a with the first order binding kinetics model.
Reporting Summary
Additional information on materials and research design is provided in Life Sciences Reporting Summary linked to this article.
Data availability Statement
The data that support the findings of this study are available from the corresponding author upon request. Statistical source data are provided with this paper.
Code availability Statement
MATLAB and ImageJ (Fiji) codes used for image processing are provided in Supplementary Notes 14 - 19.
Supplementary Material
Acknowledgements
We thank financial support from Gordon and Betty Moore Foundation (N.T.) and the National Institute of General Medical Sciences of the National Institutes of Health R01GM107165 (S.W.). We acknowledge the use of facilities within the ASU NanoFab supported in part by NSF program NNCI-ECCS-1542160. The content is solely the responsibility of the authors and does not necessarily represent the official views of the sponsors.
Footnotes
Competing interests
A US provisional patent application (62/975,473) has been filed by Arizona Board of Regents on behalf of Arizona State University for single molecule imaging based on an early draft of this article. Inventors: N.T., S.W. and P.Z.
References
- 1.Santos R et al. A comprehensive map of molecular drug targets. Nat. Rev. Drug Discov 16, 19–34 (2017). [DOI] [PMC free article] [PubMed] [Google Scholar]
- 2.Polanski M & Anderson NL A list of candidate cancer biomarkers for targeted proteomics. Biomark. Insights 1, 1–48 (2007). [PMC free article] [PubMed] [Google Scholar]
- 3.Homola J Present and future of surface plasmon resonance biosensors. Anal. Bioanal. Chem 377, 528–539 (2003). [DOI] [PubMed] [Google Scholar]
- 4.Phillips KS & Cheng Q Recent advances in surface plasmon resonance based techniques for bioanalysis. Anal. Bioanal. Chem 387, 1831–1840 (2007). [DOI] [PubMed] [Google Scholar]
- 5.Masson J-F Surface plasmon resonance clinical biosensors for medical diagnostics. ACS Sens. 2, 16–30 (2017). [DOI] [PubMed] [Google Scholar]
- 6.Fang Y et al. Plasmonic imaging of electrochemical reactions of single nanoparticles. Acc. Chem. Res 49, 2614–2624 (2016). [DOI] [PubMed] [Google Scholar]
- 7.Huang B, Yu F, & Zare RN Surface plasmon resonance imaging using a high numerical aperture microscope objective. Anal. Chem 79, 2979–2983 (2007). [DOI] [PubMed] [Google Scholar]
- 8.Wang W et al. Single cells and intracellular processes studied by a plasmonic-based electrochemical impedance microscopy. Nat. Chem 3, 249–255 (2011). [DOI] [PMC free article] [PubMed] [Google Scholar]
- 9.Wang W et al. Label-free measuring and mapping of binding kinetics of membrane proteins in single living cells. Nat. Chem 4, 846–853 (2012). [DOI] [PMC free article] [PubMed] [Google Scholar]
- 10.Yang YZ et al. Label-free tracking of single organelle transportation in cells with nanometer precision using a plasmonic imaging technique. Small 24, 2878–2884 (2015). [DOI] [PMC free article] [PubMed] [Google Scholar]
- 11.Wang SP et al. Label-free imaging, detection, and mass measurement of single viruses by surface plasmon resonance. Proc. Natl Acad. Sci. USA 107, 16028–16032 (2010). [DOI] [PMC free article] [PubMed] [Google Scholar]
- 12.Shan XN et al. Imaging the electrocatalytic activity of single nanoparticles. Nat. Nanotechnol 7, 668–672 (2012). [DOI] [PubMed] [Google Scholar]
- 13.Fang YM et al. Intermittent photocatalytic activity of single CdS nanoparticles. Proc. Natl Acad. Sci. USA 114, 10566–10571 (2017). [DOI] [PMC free article] [PubMed] [Google Scholar]
- 14.Yang YT et al. Interferometric plasmonic imaging and detection of single exosomes. Proc. Natl Acad. Sci. USA 115, 10275–10280 (2018). [DOI] [PMC free article] [PubMed] [Google Scholar]
- 15.Vollmer F & Arnold S Whispering-gallery-mode biosensing: label-free detection down to single molecules. Nat. Methods 5, 591–596 (2008). [DOI] [PubMed] [Google Scholar]
- 16.Zijlstra P, Paulo PMR & Orrit M Optical detection of single non-absorbing molecules using the surface plasmon resonance of a gold nanorod. Nat. Nanotechnol 7, 379–382 (2012). [DOI] [PubMed] [Google Scholar]
- 17.Baaske MD, Foreman MR & Vollmer F Single-molecule nucleic acid interactions monitored on a label-free microcavity biosensor platform. Nat. Nanotechnol 9, 933–939 (2014). [DOI] [PubMed] [Google Scholar]
- 18.Mauranyapin NP, Madsen LS, Taylor MA, Waleed M & Bowen WP Evanescent single-molecule biosensing with quantum-limited precision. Nat. Photonics 11, 477–481 (2017). [Google Scholar]
- 19.Zheng YH et al. , Reversible gating of smart plasmonic molecular traps using thermoresponsive polymers for single-molecule detection. Nat. Commun 6, 8797 (2015). [DOI] [PMC free article] [PubMed] [Google Scholar]
- 20.Gaiduk A, Yorulmaz M, Ruijgrok PV & Orrit M Room-temperaturedetection of a single molecule’s absorption by photothermal contrast. Science 330, 353–356 (2010). [DOI] [PubMed] [Google Scholar]
- 21.Arroyo JO, Cole D & Kukura P Interferometric scattering microscopy and its combination with single-molecule fluorescence imaging. Nat. Protoc 11, 617–633 (2016). [DOI] [PubMed] [Google Scholar]
- 22.Young G et al. Quantitative mass imaging of single biological macromolecules. Science 360, 423–427 (2018). [DOI] [PMC free article] [PubMed] [Google Scholar]
- 23.Liu XW et al. Plasmonic-based electrochemical impedance imaging of electrical activities in single cells. Angew. Chem 56, 8855–8859 (2017). [DOI] [PMC free article] [PubMed] [Google Scholar]
- 24.Lu J & Li JH Label-free imaging of dynamic and transient calcium signaling in single cells. Angew. Chem 54, 13576–13580 (2015). [DOI] [PubMed] [Google Scholar]
- 25.Shan XN, Patel U, Wang SP, Iglesias R & Tao NJ Imaging local electrochemical current via surface plasmon resonance. Science 327, 1363–1366 (2010). [DOI] [PubMed] [Google Scholar]
- 26.Yu H, Shan XN, Wang SP, Chen HY & Tao NJ Molecular scale origin of surface plasmon resonance biosensors. Anal. Chem 86, 8992–8997 (2014). [DOI] [PubMed] [Google Scholar]
- 27.Kretschmann M Decay of non radiative surface plasmons into light on rough silver films. Comparison of experimental and theoretical results. Opt. Commun 6, 185–187 (1972). [Google Scholar]
- 28.Bozhevolnyi SI & Coello V Elastic scattering of surface plasmon polaritons: Modeling and experiment. Phys. Rev. B 58, 10899–10910 (1998). [Google Scholar]
- 29.Shchegrov AV, Novikov IV & Maradudin AA Scattering of surface plasmon polaritions by a circularly symmetric surface defect. Phys. Rev. Lett 78, 4269–4272 (1997). [Google Scholar]
- 30.Sirbuly DJ, Tao A, Law M, Fan R & Yang PD Multifunctional nanowire evanescent wave optical sensors. Adv. Mater 19, 61–66 (2007). [Google Scholar]
- 31.Agnarsson B et al. Evanescent light-scattering microscopy for label-free interfacial imaging: from single sub-100 nm vesicles to live cells. ACS nano 9, 11849–11862 (2015). [DOI] [PubMed] [Google Scholar]
- 32.Cole D, Young G, Weigel A, Sebesta A & Kukura P Label-free single-molecule imaging with numerical-aperture-shaped interferometric scattering microscopy. ACS Photonics 4, 211–216 (2017). [DOI] [PMC free article] [PubMed] [Google Scholar]
- 33.Liebel M, Hugall JT & Hulst NF Ultrasensitive label-free nanosensing and high-speed tracking of single proteins. Nano Lett. 17, 1277–1281 (2017). [DOI] [PubMed] [Google Scholar]
- 34.Rita S Weighing single proteins with light. Nat. Methods 15, 477 (2018). [DOI] [PubMed] [Google Scholar]
- 35.Simpson WD & Volkmar H Modulation of the drag forceexerted by microfluidic flow on laser-trapped particles: A new method to assess surface-binding kinetics, analyte size, and solution viscosity. Biophys. J 114, 692a (2018). [Google Scholar]
- 36.Huang Y et al. Coherent brightfield microscopy provides the spatiotemporal resolution to study early stage viral infection in live cells. ACS Nano 11, 2575–2585 (2017). [DOI] [PubMed] [Google Scholar]
- 37.Ignatovich FV & Novotny L Real-time and background-free detection of nanoscale particles. Phys. Rev. Lett 96, 013901 (2006). [DOI] [PubMed] [Google Scholar]
- 38.Deutsch B, Beams R, & Novotny L Nanoparticle detection using dual-phase interferometry. Appl. Opt 49, 4921–4925 (2010). [DOI] [PMC free article] [PubMed] [Google Scholar]
- 39.Özkumur E et al. Label-free and dynamic detection of biomolecular interactions for high-throughput microarray applications. Proc. Natl Acad. Sci. USA 105, 7988–7992 (2008). [DOI] [PMC free article] [PubMed] [Google Scholar]
- 40.Piliarik M & Sandoghdar V Direct optical sensing of single unlabelled proteins and super-resolution imaging of their binding sites. Nat. Commun 5, 4495 (2014). [DOI] [PubMed] [Google Scholar]
- 41.S Abramoff MD, Magalhaes PJ & Ram SJ Image processing with imageJ. Biophotonics Int. 11, 36–42 (2004). [Google Scholar]
- 42.Tinevez J-Y et al. TrackMate: An open and extensible platform for single-particle tracking. Methods 115, 80–90 (2017). [DOI] [PubMed] [Google Scholar]
Associated Data
This section collects any data citations, data availability statements, or supplementary materials included in this article.
Supplementary Materials
Data Availability Statement
The data that support the findings of this study are available from the corresponding author upon request. Statistical source data are provided with this paper.