

Abstract
MassIVE.quant is a repository infrastructure and data resource for reproducible quantitative mass spectrometry-based proteomics, which is compatible with all mass spectrometry data acquisition types and computational analysis tools. A branch structure enables MassIVE.quant to systematically store raw experimental data, metadata of the experimental design, scripts of the quantitative analysis workflow, intermediate input and output files, as well as alternative reanalyses of the same dataset.
Quantitative mass spectrometry data analysis currently has multiple unmet reproducibility goals1. At the minimum, the mass spectrometry–based workflows must provide enough information to enable its full independent replication2. Beyond that, conclusions of data analysis should not be dependent on particular tuning parameters or software tools. Data analysis should demonstrate that alternative and equally appropriate parameter settings or software lead to qualitatively similar conclusions.
In mass spectrometry-based proteomics, data analysis is broadly categorized into peptide ion identification and quantification. Much progress in identification has been made in terms of open availability of tools and transparency of their algorithms. Archival resources MassIVE, PRIDE3, Panorama4,5, PASSEL6 component of Peptide Atlas, and jPOST in ProteomeXchange7,8 store raw data, peak lists, search engine output, identification results, and corresponding mass spectra.
Unfortunately, reproducibility and transparency of data analysis for relative protein quantification is less satisfactory. First, given the great diversity of biological objectives and experiments, quantitative analyses require richer metadata describing experimental design and biological samples. Second, quantitative experiments require many data processing steps, which are distinct from similar steps in quantitative transcriptomic investigations. These include detection and identification of chromatographic peaks and reporter ions, and propagating those identities across multiple runs. Finally, existing analysis tools (such as Skyline9, MaxQuant10, OpenMS11, OpenSWATH12, DIA-Umpire13, Proteome Discoverer, or Spectronaut14) integrate, in their own unique ways, diverse functionalities for identification and quantification. These tools offer various parameters and options, and output different details in various storage formats. Many tools also offer graphical user interfaces, for which analyses are difficult to document.
Benchmarking of individual analysis strategies and tools for quantitative proteomics workflows has become increasingly prevalent15, but lack infrastructure to store, document, annotate and reanalyze the full diversity of analyses.
To meet these reproducibility needs, we implemented MassIVE.quant, an infrastructure that supports quantitative mass spectrometry–based proteomics experiments. MassIVE.quant is integrated with an existing repository, the mass spectrometry interactive virtual environment (MassIVE).
MassIVE.quant systematically stores the intermediate output files of every tool and workflow in a way that allows the user to easily inspect, reproduce or modify any component of the workflow, beginning with well-defined intermediate files. To accomplish this, we first developed a series of steps which represent a quantitative proteomics experiment with any experimental design, data acquisition, and data analysis tools (Figure 1). These steps consist of (1) annotations of experimental design; in particular, descriptors of biological samples and conditions; (2) strategies of sample preparation and data acquisition; (3) peptide ions identification; (4) quantification; and (5) statistical analysis. At each step, MassIVE.quant provides the infrastructure to store all intermediate descriptions, annotations, analysis scripts, and results.
Figure 1 : Outline of MassIVE.quant repository structure, and reanalysis of three DDA-based experiments.

Each step can be performed with multiple algorithms and software tools, generating tool-specific files in diverse formats. For the experiments in the figure, MassIVE.quant stores the intermediate outputs from combinations of algorithms and tools for peptide ion identification and quantification. For example, DDA:Choi2017 was processed with eight combinations of parameter settings in Skyline. Each reanalysis is saved with a unique reanalysis ID, prefixed by RMSV, under the experiment repository prefixed by MSV in MassIVE.quant.
MassIVE.quant does not prescribe a standard format, but meets scientists where they are by directly accommodating the diverse nature of existing workflows. Each dataset contains links to the original publications or to metadata, which can be used to gain deeper insight into the biological context of the experiment. While analyte identification is represented by existing standard formats (such as mzTab, thousands of examples available for MassIVE datasets) and some of these can represent some quantitative information (such as the quant section in mzTab files, e.g., the mzTab file for RMSV000000249.18), the output files produced by quantitative analyses tools can be of any nature. None of the formats mentioned before support reporting of the results of statistical analyses of quantitative data. We chose a tabular format (i.e., csv) as a common representation of the output of quantitative and statistical analyses for all tools. This format emphasizes biologically relevant aspects of the output, such as the identity of differentially abundant peptides or proteins, the magnitudes of fold changes, and the associated variation.
Next, at each step, a branch structure enables the user to view reanalyses of each experiment. The reanalyses can be performed by the user offline with any combination of software tools and settings. MassIVE.quant stores the intermediate files and allows the user to check for the presence of script files, accuracy of parameters and completeness of documentation.
To scale the submission procedure and to ensure the reproducibility of a quantitative workflow, MassIVE.quant maintains datasets with four levels of curation (Bronze, Silver, Gold, and Platinum), reflecting the documentation and the reproducibility of the quantitative workflow. During the submission, the infrastructure checks whether the submission of the dataset or reanalysis meets the minimal requirements for the entry-level of curation. The submitter can then request the advanced review to level up.
MassIVE.quant further automates the statistical analysis of quantified proteins with an online MSstats workflow accessible with a user-friendly interface. This workflow can be used to reproduce the statistical analysis steps in MassIVE.quant reanalyses, as well as to analyze new private or public datasets. The MSstats Comparison workflow in MassIVE.quant automatically compares MSstats outputs across alternative reanalyses, and produces figures such as Figure 2(o). This enables the user to evaluate the implications of alternative reanalyses on conclusions regarding differential protein abundance.
Figure 2 : Re-analyses of DIA:Selevsek2015, profiling changes in proteome abundance of S. cerevisiae over six time points: T0(0 min), T1(15 min), T2(30 min), T3(60 min), T4(90 min), T5 (120 min), n=3 biologically independent samples per each time points, in response to osmotic stress (RMSV000000251).
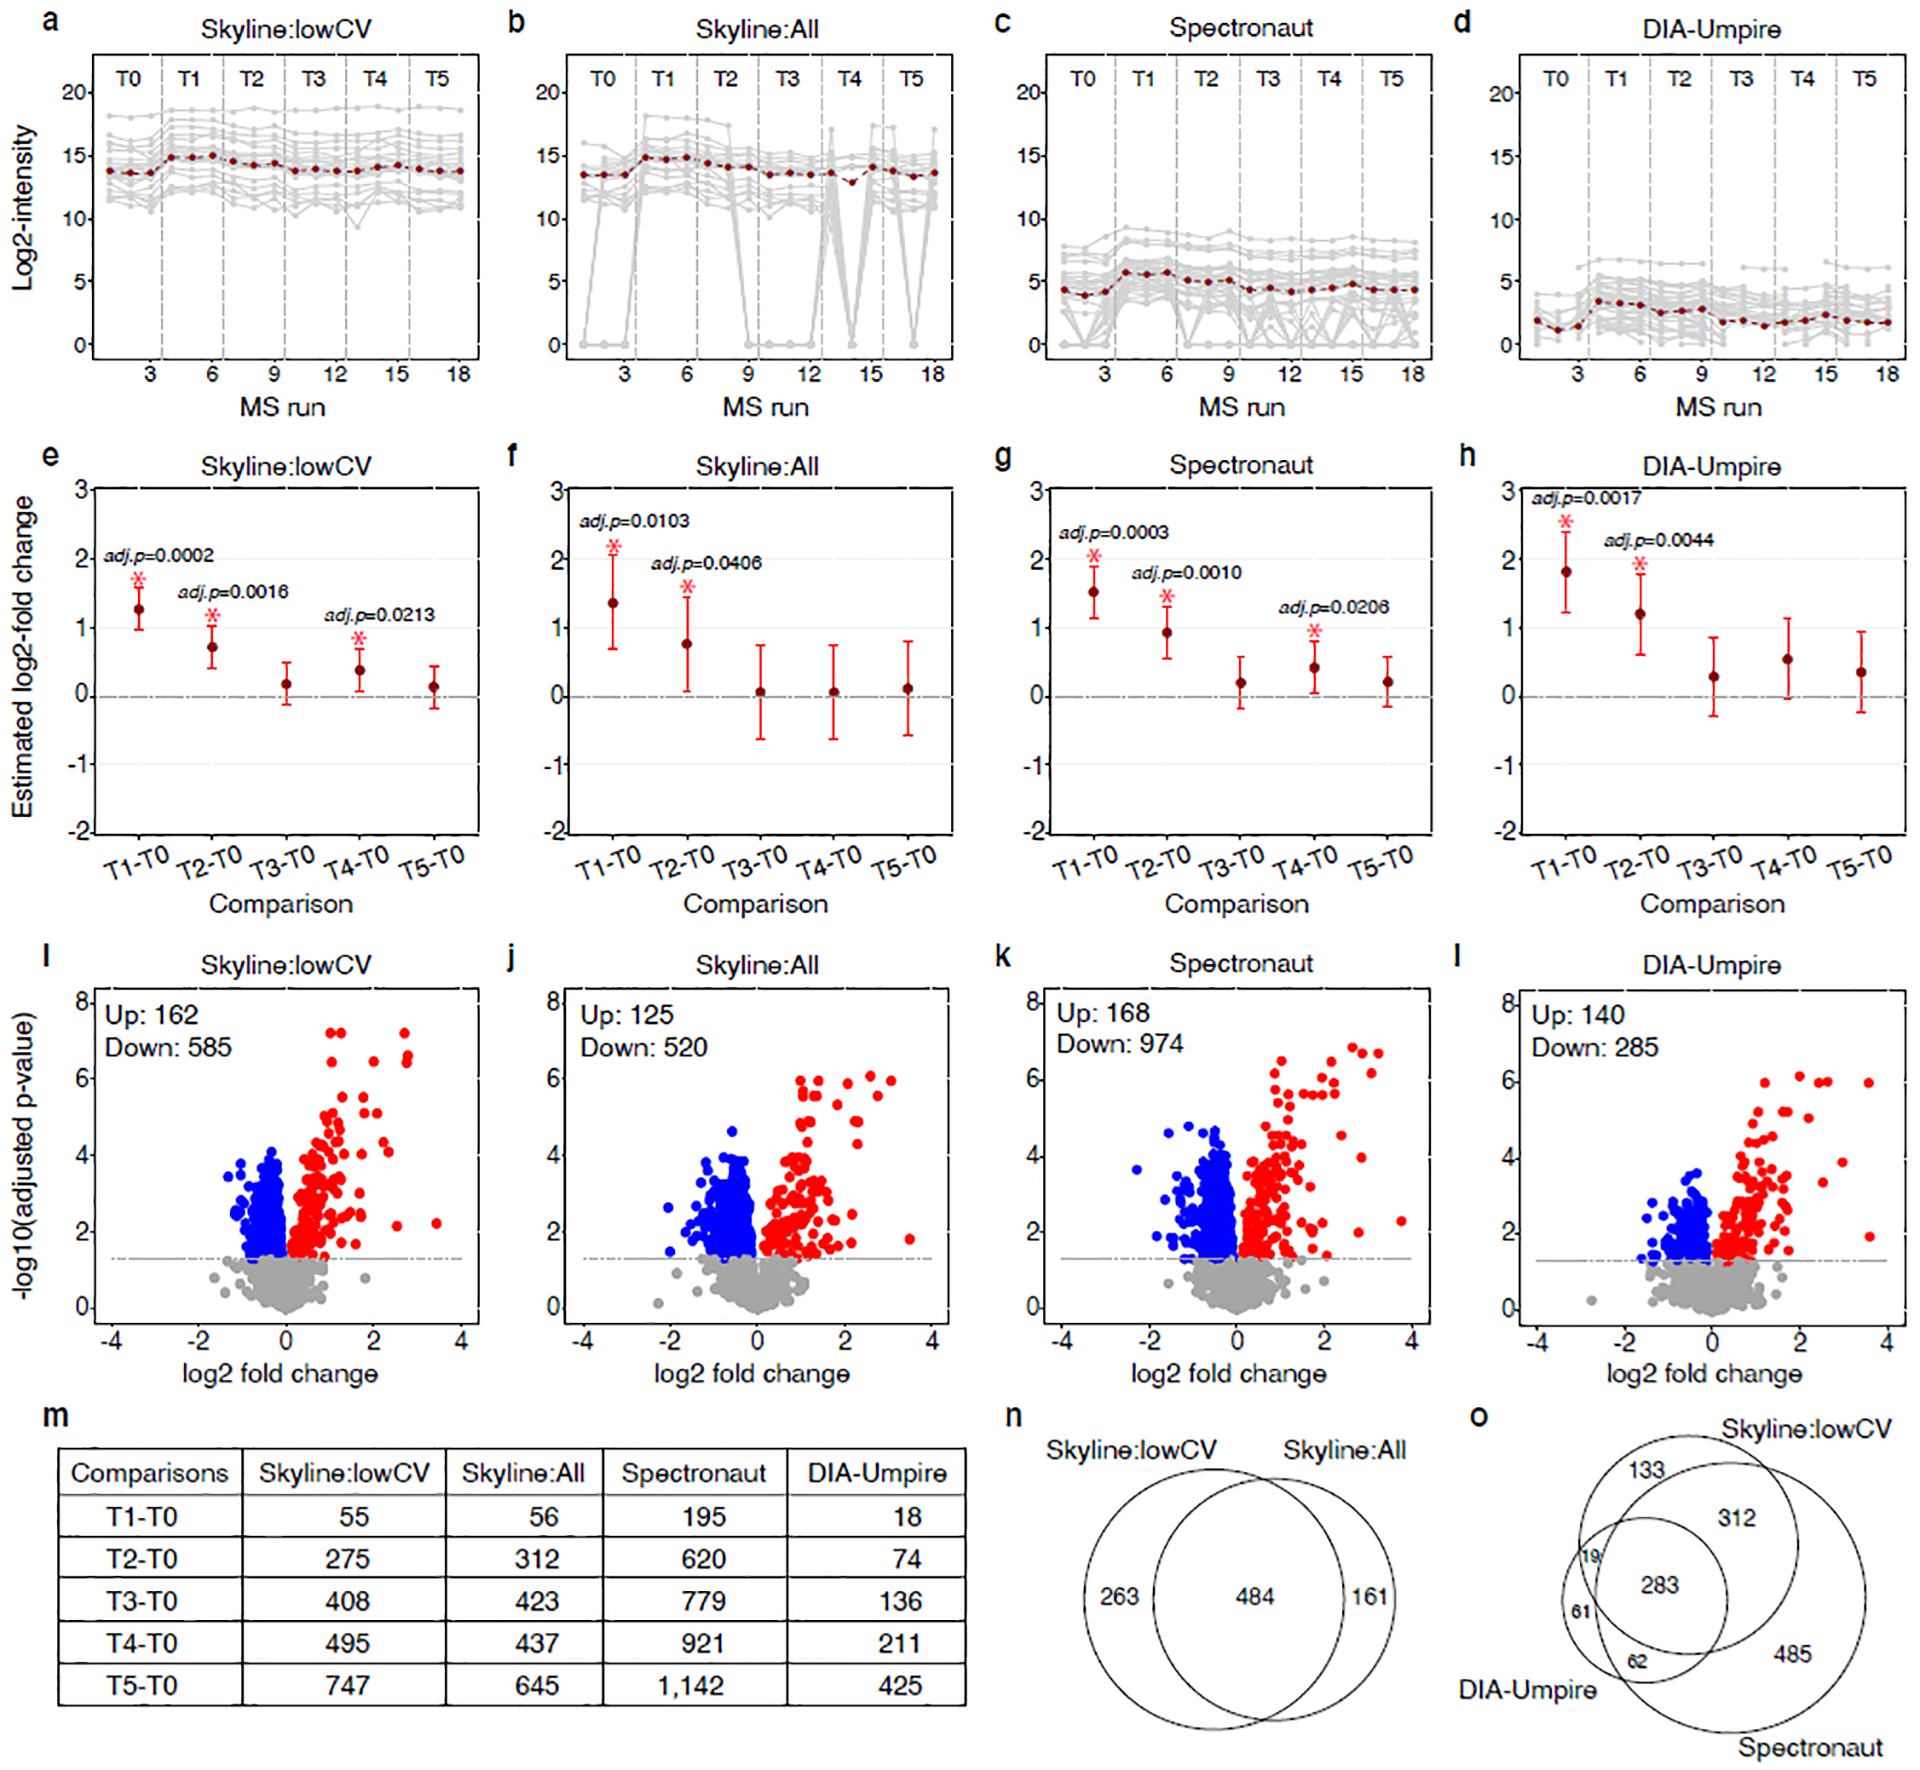
(a)-(d) Discrepancies of quantification of protein YKL096W across data processing tools. Gray lines: fragments reported by each tool. Red lines: protein quantification summarized by MSstats. (a) Skyline:lowCV used Skyline to quantify a subset of the fragments with low coefficient of variation. (b) Skyline:All used Skyline to quantify all detectable peptides, with a maximum of six fragments each; (c) data processed by Spectronaut; (d) data processed by DIA-Umpire. (e)–(h), Discrepancies in detecting differential abundance for protein YKL096W across data processing tools, with statistical analysis by MSstats: Skyline:lowCV (e), Skyline:all (f), Spectronaut (g) and DIA-Umpire (h). Dark red dot, center for error bars, model-based estimates of log2(fold change) of protein abundance, as determined by MSstats. Error bars, 95% confidence intervals for the log2(fold change), as determined by MSstats. *Adjusted P < 0.05. (i)–(l), Volcano plots, summarizing differential abundance between T5 and T0: Skyline:lowCV (i), Skyline:all (j), Spectronaut (k) and DIA-Umpire (l). Dashed line, FDR = 0.05; blue dots, significantly down-regulated proteins; red dots, significantly up-regulated proteins (counts are shown at the top left corner; other time points are shown in Supplementary Figure. 3). (m) Number of differentially abundant proteins across all time points and all tools, FDR = 0.05. (n) Venn diagram of differentially abundant proteins between two processing approaches by Skyline, comparing T5 versus T0. (o) Venn diagram of differentially abundant proteins across all tools, comparing T5 versus T0 (other time points are shown in Supplementary Figure. 4).
The online user documentation clearly describes the structure and the vocabulary used by MassIVE.quant, and provides detailed instructions for contributing data, reanalyses and comparisons (Supplementary Note 1). Supplementary Figure 1 and 2 and Supplementary Table 1 describes the infrastructure of MassIVE.quant and give an example of the reanalysis submission workflow.
The impact of the choice between various analysis options is best understood in the presence of some notion of ground truth. Therefore, we populated MassIVE.quant with a collection of ten datasets with controlled mixtures with known changes in protein abundance. These include three datasets collected using label-free data-dependent acquisition (DDA), four datasets collected using data-independent acquisition (DIA), one dataset collected using selective reaction monitoring (SRM) with heavy labeled isotope peptides and two DDA dataset collected using chemical labeling (TMT) (Supplementary Table 2). These datasets vary in background proteomes, number of conditions and replicates, and type and number of differentially abundant proteins.
We also populated MassIVE.quant with 95 reanalyses of these ten controlled datasets using multiple software tools, performed by the developers of the tools or by expert users. All the DDA experiments in Figure 1 were processed with up to six tools for identification and four tools for quantification. For example, data from Choi et al.16 (DDA:Choi2017) were processed with eight different combinations of parameter settings in Skyline. The combinations of algorithms, tools, and settings generated ten distinct quantification reports. Finally, up to five different types of downstream statistical analysis per dataset using MSstats17 generated 22 distinct tests for differential protein abundance for DDA:Choi2017.
To demonstrate the use of documentation, reanalysis, and curation in basic biology investigations, we further populated MassIVE.quant with a collection of biological datasets, at the time of publication, including eight DIA/SWATH, seven SRM, 12 DDA, and six experiments with DDA-TMT acquisition, analyzed with multiple tools; 25 datasets with platinum level of curation, 18 datasets with gold (Supplementary Table 3). For example, the DIA experiment by Selevsek et al.18 (DIA:Selevsek2015) was reanalyzed four times using different analysis strategies and different processing tools and parameter settings. Figure 2, Supplmentary Table 4 and Supplementary Figure 3 and 4 illustrate how changes in data processing propagated themselves into discrepancies in the number of quantified proteins, frequency of missing values, and lists of differentially abundant proteins. Figure 2(a–d) illustrate these discrepancies in the special case of one protein. The analysis strategies and processing tools affected protein-level summaries in terms of scale, variation, and patterns of missing values. This in turn affected the estimates of fold changes (Figure 2(e–h)) and tests for differential abundance (Figure 2(i–l)). Analysis with filtering in Skyline, applied to limit the DIA features to those known to be informative a priori (Skyline:lowCV, RMSV000000251.1) detected a smoother, and therefore more biologically plausible, pattern of differential abundance in time (Figure 2(m)). While the true differential abundance is unknown, changes identified by most tools are more likely to be real (Figure 2(n–o)). Such comparisons help curate the results of biological investigations.
To summarize, MassIVE.quant provides an opportunity for large-scale deposition of heterogeneous experimental datasets and facilitates a community-wide conversation about the benefits of its use. We hope that the community will find the resource useful and welcome user-driven submissions of both new datasets and documented reanalyses of the existing datasets.
Online Methods
Manual and tutorials
MassIVE.quant user manuals and video tutorials explain how to 1) create an account in MassIVE.quant, 2) upload files to MassIVE account via FTP, 3) submit quantification reanalysis to MassIVE.quant, 4) access reanalyses, 5) run MSstats workflow in MassIVE.quant, and 6) compare the results of statistical analysis by MSstats. User manuals are available at MassIVE.quant section in https://ccms-ucsd.github.io/MassIVEDocumentation/. The video tutorial is available in https://www.youtube.com/channel/UCPeNhYFItiabsoOITPZBc5Q
Data analysis and statistical analysis for DIA:Selevsek2015
R package MSstats v3.10.6 was used to pre-process the output from Skyline, Spectronaut, and DIA-Umpire before statistical analysis, to have protein quantification, and to perform differential abundance analysis. MSstats estimated log2(fold change) and the standard error by linear mixed effect model for each protein. To test two-sided null hypothesis of no changes in abundance, the model-based test statistics were compared to the Student t-test distribution with the degrees of freedom appropriate for each protein and each dataset. The resulting P values were adjusted to control the FDR with the method by Benjamini–Hochberg. Parameter settings as well as the R code used to analyze DIA:Selevsek2015 are available in reanalysis container, RMSV000000251 in MassIVE.quant.
Data Availability
All the datasets that support this study are publicly available in MassIVE.quant (https://massive.ucsd.edu/ProteoSAFe/static/massive-quant.jsp) with MassIVE and ProteomeXchange identifiers. Additionally, identifiers for all the datasets are listed in Supplementary Tables 2, 3 and 5.
Supplementary Material
Acknowledgements
This work was supported in part by NSF CAREER award DBI-1054826, NSF DBI-1759736 and the Chan-Zuckerberg foundation to O.V., NIH-NLM 1R01LM013115 to N.B. and O.V., NSF award ABI 1759980, NIH awards P41GM103484, and R24GM127667 to N.B., and the Personalized Health and Related Technologies (PHRT 0-21411-18) strategic focus area of ETH to B.W. The CRG/UPF Proteomics Unit is part of the Spanish Infrastructure for Omics Technologies (ICTS OmicsTech) and it is a member of the ProteoRed PRB3 consortium which is supported by grant PT17/0019 of the PE I+D+i 2013-2016 from the Instituto de Salud Carlos III (ISCIII) and ERDF. We acknowledge support from the Spanish Ministry of Science, Innovation and Universities, “Centro de Excelencia Severo Ochoa 2013-2017”, SEV-2012-0208, and “Secretaria d’Universitats i Recerca del Departament d’Economia i Coneixement de la Generalitat de Catalunya” (2017SGR595). This project has received funding from the European Union’s Horizon 2020 research and innovation program under grant agreement No 823839 (EPIC-XS). Y.P-R. acknowledges the Wellcome Trust (grant number 208391/Z/17/Z). We thank the MacCoss lab (Department of Genome Sciences, University of Washington) for the Skyline analyses and contributing the processed data, the Slavov lab (College of Engineering, Northeastern University) for providing the data, and the Guo lab (School of Life Sciences, Westlake University, China) for providing the data.
Footnotes
Competing financial interests
O.M.B., J.M. and L.R. are employees of Biognosys AG. Spectronaut is a trademark of Biognosys AG. M.T. and T.D. are employees of Hoffmann-La Roche Ltd. All other authors declare no competing financial interests.
References
- 1.Peng RD Reproducible research in computational science. Science 334, 1226–1227, doi: 10.1126/science.1213847 (2011). [DOI] [PMC free article] [PubMed] [Google Scholar]
- 2.Wilkinson MD et al. The FAIR Guiding Principles for scientific data management and stewardship. Sci Data 3, 160018, doi: 10.1038/sdata.2016.18 (2016). [DOI] [PMC free article] [PubMed] [Google Scholar]
- 3.Perez-Riverol Y et al. The PRIDE database and related tools and resources in 2019: improving support for quantification data. Nucleic Acids Res 47, D442–D450, doi: 10.1093/nar/gky1106 (2019). [DOI] [PMC free article] [PubMed] [Google Scholar]
- 4.Sharma V et al. Panorama: a targeted proteomics knowledge base. J Proteome Res 13, 4205–4210, doi: 10.1021/pr5006636 (2014). [DOI] [PMC free article] [PubMed] [Google Scholar]
- 5.Sharma V et al. Panorama Public: A Public Repository for Quantitative Data Sets Processed in Skyline. Mol Cell Proteomics 17, 1239–1244, doi: 10.1074/mcp.RA117.000543 (2018). [DOI] [PMC free article] [PubMed] [Google Scholar]
- 6.Farrah T et al. PASSEL: the PeptideAtlas SRMexperiment library. Proteomics 12, 1170–1175, doi: 10.1002/pmic.201100515 (2012). [DOI] [PMC free article] [PubMed] [Google Scholar]
- 7.Vizcaino JA et al. ProteomeXchange provides globally coordinated proteomics data submission and dissemination. Nat Biotechnol 32, 223–226, doi: 10.1038/nbt.2839 (2014). [DOI] [PMC free article] [PubMed] [Google Scholar]
- 8.Deutsch EW et al. The ProteomeXchange consortium in 2017: supporting the cultural change in proteomics public data deposition. Nucleic Acids Res 45, D1100–D1106, doi: 10.1093/nar/gkw936 (2017). [DOI] [PMC free article] [PubMed] [Google Scholar]
- 9.MacLean B et al. Skyline: an open source document editor for creating and analyzing targeted proteomics experiments. Bioinformatics 26, 966–968, doi: 10.1093/bioinformatics/btq054 (2010). [DOI] [PMC free article] [PubMed] [Google Scholar]
- 10.Cox J & Mann M MaxQuant enables high peptide identification rates, individualized p.p.b.-range mass accuracies and proteome-wide protein quantification. Nat Biotechnol 26, 1367–1372, doi: 10.1038/nbt.1511 (2008). [DOI] [PubMed] [Google Scholar]
- 11.Rost HL et al. OpenMS: a flexible open-source software platform for mass spectrometry data analysis. Nat Methods 13, 741–748, doi: 10.1038/nmeth.3959 (2016). [DOI] [PubMed] [Google Scholar]
- 12.Rost HL et al. OpenSWATH enables automated, targeted analysis of data-independent acquisition MS data. Nat Biotechnol 32, 219–223, doi: 10.1038/nbt.2841 (2014). [DOI] [PubMed] [Google Scholar]
- 13.Tsou CC et al. DIA-Umpire: comprehensive computational framework for data-independent acquisition proteomics. Nat Methods 12, 258–264, 257 p following 264, doi: 10.1038/nmeth.3255 (2015). [DOI] [PMC free article] [PubMed] [Google Scholar]
- 14.Bruderer R et al. Extending the limits of quantitative proteome profiling with data-independent acquisition and application to acetaminophen-treated three-dimensional liver microtissues. Mol Cell Proteomics 14, 1400–1410, doi: 10.1074/mcp.M114.044305 (2015). [DOI] [PMC free article] [PubMed] [Google Scholar]
- 15.Navarro P et al. A multicenter study benchmarks software tools for label-free proteome quantification. Nat Biotechnol 34, 1130–1136, doi: 10.1038/nbt.3685 (2016). [DOI] [PMC free article] [PubMed] [Google Scholar]
- 16.Choi M et al. ABRF Proteome Informatics Research Group (iPRG) 2015 Study: Detection of Differentially Abundant Proteins in Label-Free Quantitative LC-MS/MS Experiments. J Proteome Res 16, 945–957, doi: 10.1021/acs.jproteome.6b00881 (2017). [DOI] [PubMed] [Google Scholar]
- 17.Choi M et al. MSstats: an R package for statistical analysis of quantitative mass spectrometry-based proteomic experiments. Bioinformatics 30, 2524–2526, doi: 10.1093/bioinformatics/btu305 (2014). [DOI] [PubMed] [Google Scholar]
- 18.Selevsek N et al. Reproducible and consistent quantification of the Saccharomyces cerevisiae proteome by SWATH-mass spectrometry. Mol Cell Proteomics 14, 739–749, doi: 10.1074/mcp.M113.035550 (2015). [DOI] [PMC free article] [PubMed] [Google Scholar]
Associated Data
This section collects any data citations, data availability statements, or supplementary materials included in this article.
Supplementary Materials
Data Availability Statement
All the datasets that support this study are publicly available in MassIVE.quant (https://massive.ucsd.edu/ProteoSAFe/static/massive-quant.jsp) with MassIVE and ProteomeXchange identifiers. Additionally, identifiers for all the datasets are listed in Supplementary Tables 2, 3 and 5.