Abstract
Objective
Evaluate the association between carbon dioxide (pCO2), cerebral blood flow (CBF), and cerebral autoregulation (CA) in preterm infants.
Study design
Cerebral saturations (rScO2, surrogate for CBF using NIRS) and mean arterial blood pressure (MAP) monitored for 96 h in infants <29 weeks gestation. Relationship between rScO2, the rScO2-MAP correlation (CA analysis) and pCO2 category assessed by mixed effects modeling.
Results
Median pCO2 differed by postnatal day (p < 0.0001)—pCO2 increased between day 1 and 2, and low variability seen on day 4. A 5% increase in rScO2 was noted when pCO2 was >55 mmHg on each postnatal day (p < 0.001). No association observed between the overall rScO2-MAP correlation and pCO2. On day 1 only, the correlation coefficient decreased from 0.26 to −0.09 as pCO2 category increased (p = 0.02).
Conclusions
CBF increased above a pCO2 threshold of 55 mmHg, but overall, no association between pCO2 and CA was noted.
Subject terms: Medical research, Neurophysiology
Introduction
Premature infants are likely to require respiratory support and are at risk of fluctuations in partial pressure of carbon dioxide (pCO2) levels. Given that pCO2 is a known mediator of cerebral blood flow, these ventilatory driven fluctuations may have significant effects on cerebral hemodynamics. pCO2 reactivity defined as the increase in cerebral blood flow in relation to an increase in pCO2 has been previously demonstrated in premature infants. An increase in 1 KPa (7.5 mmHg) has been shown to increase cerebral blood flow by ~11% [1]. pCO2 reactivity may be attenuated by day of life with cerebral blood flow increasing in response to a rise in pCO2, but only after the first day of life [2, 3]. In addition, a pCO2 greater than 50 mmHg may represent a threshold above which cerebral blood flow is increased [2].
Cerebral autoregulation (CA), the protective mechanism that maintains stable cerebral blood flow despite fluctuating cerebral perfusion pressures, is often impaired in preterm infants [4, 5] in association with both brain injury and death [4, 6, 7]. Though there is no direct means to assess cerebral blood flow in preterm infants, near infrared spectroscopy (NIRS) has been used as a surrogate marker assuming stable oxygenation and metabolic demand [8]. A high level of cerebral oxygenation (rScO2) and mean arterial blood pressure (MAP) correlation is suggestive of impaired CA [8–10]. Although pCO2 reactivity has been observed in premature infants, the relationship between pCO2 reactivity and CA is less clear. A positive correlation between cerebral blood flow and blood pressure has been demonstrated in preterm infants as pCO2 increased, with a cut point greater than a pCO2 of 45–50 mmHg [2, 11]. It also has been noted that during periods of low blood pressure, pCO2 reactivity may be attenuated [1], suggesting a complex relationship that has not been fully elucidated in this population.
Given the limited information regarding pCO2, cerebral blood flow, and CA, our aim was to further describe these relationships in a larger cohort of premature infants with serial pCO2 measurements over the first 4 days of life. The goal of this study is to help guide ventilatory management and allow clinicians to target pCO2 levels that will result in optimal cerebral hemodynamics.
Methods
Population and data collection
This is a secondary exploratory analysis of a prospectively enrolled cohort study of subjects 240–296 weeks gestation admitted to the University of Maryland Medical Center level IV neonatal intensive care unit (NICU) between June 2013 and September 2016 who had continuous intra-arterial blood pressure monitoring within the first 12 h of life [4]. Exclusion criteria including major congenital anomalies, or less than 12 h of monitoring. The University of Maryland Medical Center Institutional Review Board approved the study, and parental consent was obtained. Demographic and clinical data were obtained from the medical record for each patient.
Continuous data monitoring and processing
Cerebral saturations were evaluated with the NIRS device (INVOS 5100C, Covidien, Mansfield, MA) within 12 h of life and continued for a maximum of 96 h or until the intra-arterial line was removed. MAP was continuously monitored by the use of an indwelling umbilical or peripheral arterial catheter. Data were continuously recorded and time-synchronized every 30 s using a data aggregation device (Vital Sync, Covidien, Mansfield, MA). The data were retrospectively reviewed and artifacts in MAP and rScO2 such as those due to blood sampling and movement were removed manually prior to analysis. Time periods with significant hypoxemia, SpO2 < 80%, were removed from analysis according with previous methodology [4, 6].
Carbon dioxide measurements
pCO2 measured in mmHg were sampled from the indwelling arterial line and obtained at a minimum of every 12 h and as clinically indicated. Each measurement was time stamped and recorded with the above physiologic data. pCO2 measurements were evaluated as both continuous and categorical variables. The categories included <35 mmHg, 35–45 mmHg, 46–55 mmHg, and >55 mmHg, corresponding to values generally considered low, normal, permissive hypercapnia, and high respectively.
Statistical analysis
Statistical analysis was performed using SAS V.9.4 software (SAS Institute). Continuous data are presented as mean ± standard deviation or median (range) depending on the distribution. Categorical data are presented as number (%). Univariate analysis determined the distribution of pCO2 for the overall cohort and then further stratified by postnatal day. Median pCO2 values between postnatal day were compared using Kruskal–Wallis testing.
CA was assessed by dividing the study period into 10-min contiguous epochs with time of birth as time zero. For each epoch, the Pearson’s correlation coefficient between MAP and rScO2 was calculated (r). Only epochs with concurrent recorded pCO2 measurements were evaluated. Generally, a higher correlation, r > 0.3–0.5, signifies a more impaired autoregulatory state.
To determine the effect of pCO2 on cerebral blood flow and CA, linear mixed effect modeling was used to account for repeated measures and within patient clustering. Separately, rScO2 (a surrogate marker of cerebral blood flow) was compared with the correlation coefficient between MAP and rScO2 (r) for pCO2 categories and a priori controlling for day of life, gestational age, ventilator mode, and mean airway pressure at the time of sampling. Clustering by subject with random intercept and an unstructured covariance model was used. Additional confounders (presence of a patent ductus arteriosis, vasopressor support, intraventricular hemorrhage, gender, etc.) were assessed in the model based on biologic plausibility and if p < 0.1 in bivariate analysis and were retained if the estimates were affected by more than 10%.
Results
All sixty-one subjects from the original cohort were included in the analysis. Demographic and clinical data of this cohort is shown in Table 1. The median hour of life of enrollment was 8 h (range 4–12 h). Twenty-six percent of subjects were enrolled within 6 h of life. The mean birth weight was 849 ± 234 g, the mean gestational age was 26.3 ± 1.6 weeks, and 32 (52%) were male. For the overall cohort, 6 subjects (10%) never received invasive respiratory support, 22 (36%) were supported on conventional mechanical ventilation, and 33 (54%) received high frequency ventilation.
Table 1.
Demographic and clinical variables.
| Population characteristic | Study population (n = 61) |
|---|---|
| Gestational age (weeks), mean ± SD | 26.3 ± 1.6 |
| Birth weight (g), mean ± SD | 849 ± 234 |
| Male gender, n (%) | 32 (52%) |
| Apgar 5 min, median (range) | 7 (1–10) |
| Chorioamnionitis, n (%) | 6 (10) |
| Type of ventilation support, n (%) | |
| None/LFNC | 0 (0) |
| HFNC/CPAP | 6 (10) |
| Conventional ventilator | 22 (36) |
| High-frequency venitlation | 33 (54) |
| Vasopressor use, n (%) | 22 (36) |
| IVH, n (%) | 25 (41) |
| Grade 3 or 4 IVH, n (%) | 7 (11) |
| NEC, n (%) | 6 (10) |
| Death, n (%) | 10 (16) |
| BPD n = 54, n (%) | 43 (72) |
| ROP n = 51, n (%) | 35 (58) |
pCO2 data
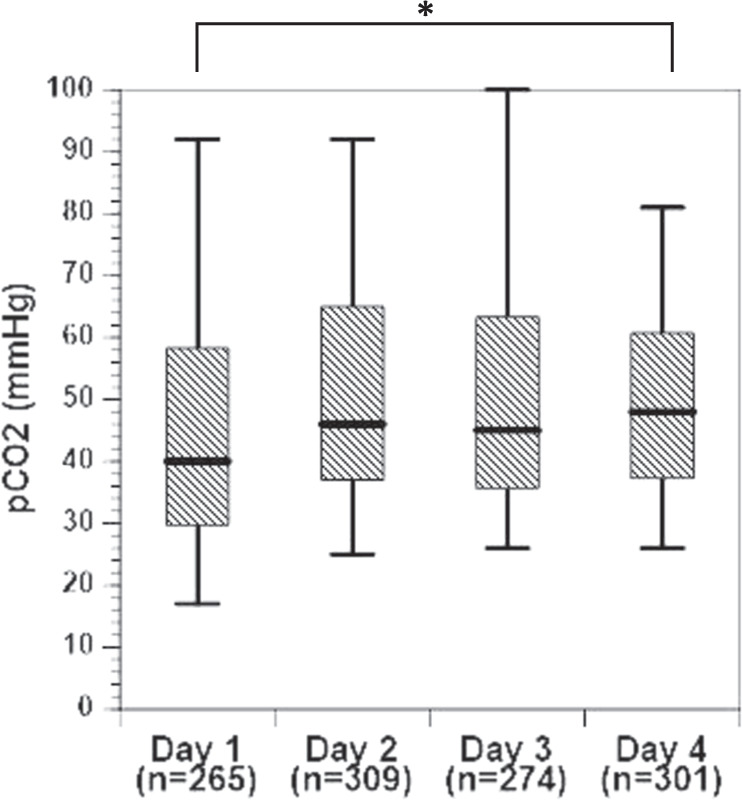
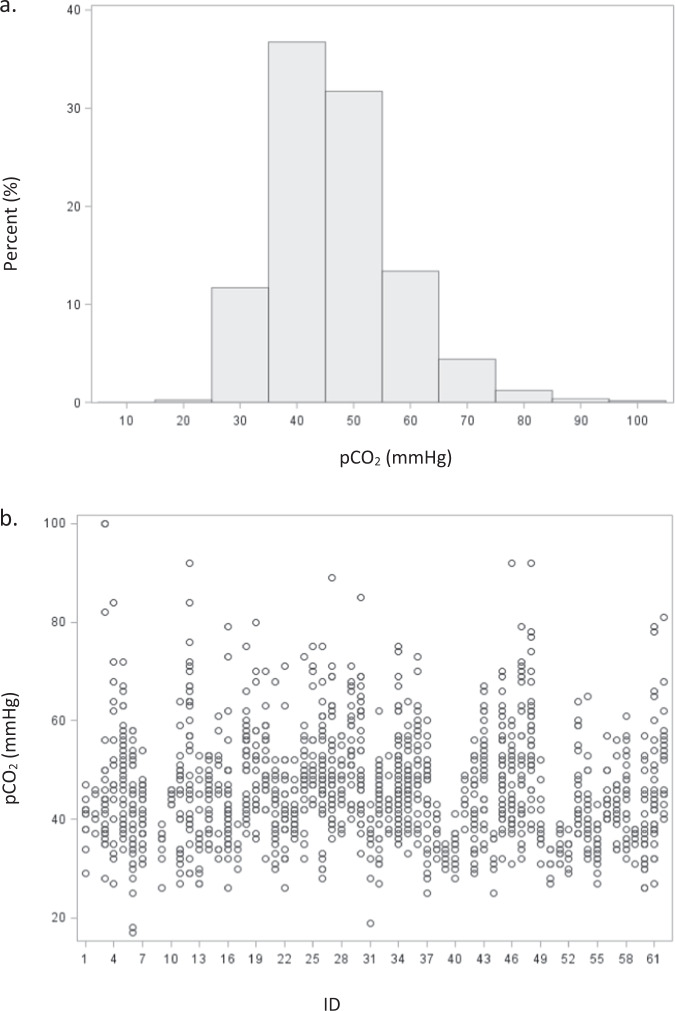
During the study timeframe, 1149 arterial blood gas measurements were obtained with corresponding autoregulation data, ranging from 3–43 measurements per subject. Carbon dioxide measurements ranged from 17 to 100 mmHg. There were 265 observations on day of life 1, 309 on day 2, 274 on day 3, and 301 observations on day of life 4. A histogram of pCO2 distribution shown in Fig. 1a is notable for a rightward skew and a peak between 40 and 50 mmHg. The range and number of pCO2 values for each subject is shown in Fig. 1b. There was a significant difference in the median pCO2 by postnatal day (p < 0.0001, Fig. 2) with the largest increase noted between day 1 (median 40 mmHg, range 17–92 mmHg) and day 2 (median 46 mmHg, range 25–92 mmHg) of life, and the least variability on day 4 (median 48 mmHg, range 26–81 mmHg).
Fig. 1.
Distribution of pCO2 during the entire monitoring period (a) and the number and range of pCO2 measurements for each subject (b).
Fig. 2. Boxplot of the median, IQR, and range (black line, hashed box, and wiskers) CO2 by postnatal day.

Asterisk (*) denotes a significant difference between postnatal days 1 and 4, p < 0.0001.
pCO2 reactivity and CA by pCO2 category
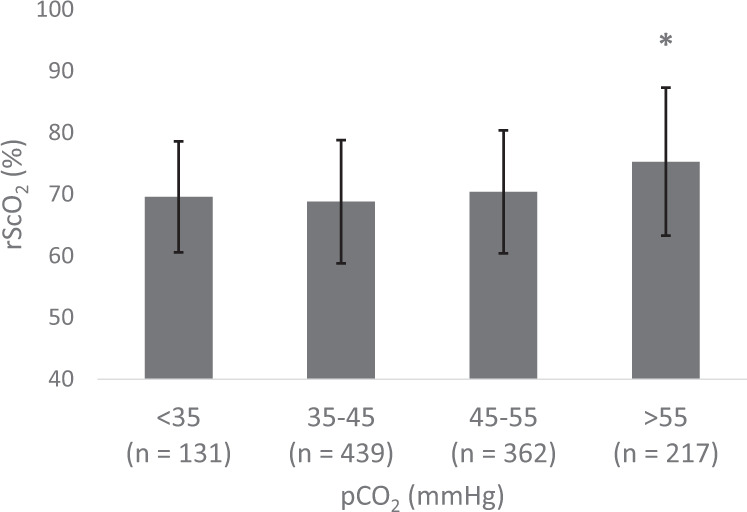
Using cerebral saturations as a surrogate marker of cerebral blood flow, generally rScO2 remained stable at 70% until pCO2 exceeded 55 mmHg, and after which an rScO2 increased by 5%. This increase was significant (p < 0.001) when compared to all other pCO2 categories, and controlling for postnatal day, gestational age, vasopressor use, respiratory support, and mean airway pressure at the time of sampling using mixed effects modeling (Fig. 3). Postnatal day, gestational age, and mean airway pressure were significant confounders in the model (p < 0.05). When stratifying by day of life, a significant increase in rScO2 when pCO2 was greater than 55 mmHg was observed on each of the first 4 days of life.
Fig. 3. Mean rScO2 ± SD by pCO2 category.

Asterisk (*) denotes p < 0.001 when the pCO2 > 55 mmHg group was compared to each other pCO2 category controlling for postnatal day, gestational age, respiratory support, and mean airway pressure at the time of sampling.
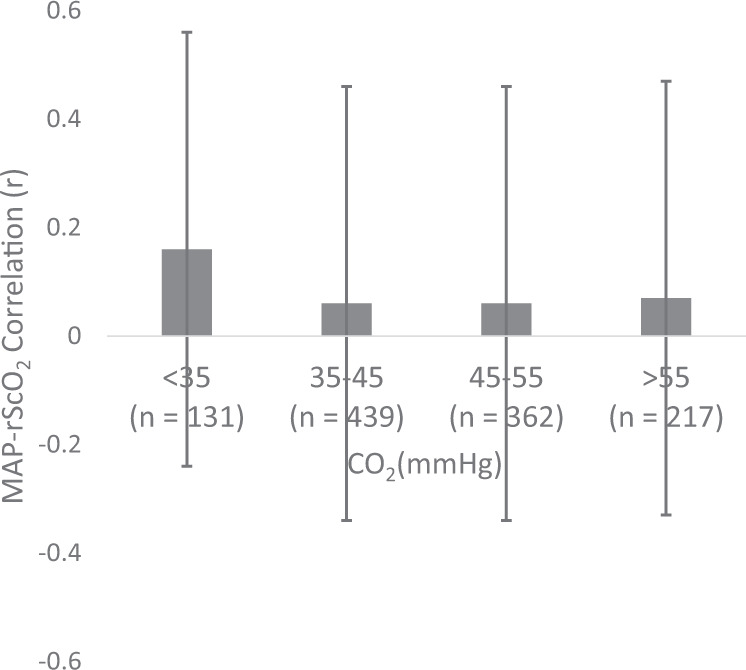
Examining the effect of CA and pCO2 we noted that the lowest pCO2 category had the highest correlation coefficient (r) between MAP-rScO2 of 0.16 ± 0.4, followed by a decrease to 0.06 in the higher CO2 categories (Fig. 4). None of these differences was statistically significant after controlling for potential covariates. When stratifying by day of life, there was a decrease in the MAP-rScO2 correlation from 0.26 ± 0.36 in the lowest CO2 category to −0.09 ± 0.38 in the highest CO2 category on day of life 1. This difference was significant, p = 0.02, when controlling for gestational age, vasopressor exposure, respiratory support and mean airway pressure at the time of sampling. There was no significant effect of CO2 on the MAP-rScO2 correlation on any subsequent day.
Fig. 4. Mean correlation between mean arterial blood pressure and rScO2 (r) ± SD by pCO2 category.

There were no significant differences between groups.
Discussion
In this study of premature infants born less than 29 weeks gestation, we evaluated the association of carbon dioxide measurements and CA and blood flow. We found that cerebral saturations, a surrogate marker for cerebral blood flow, increased significantly when pCO2 was greater than 55 mmHg on each day in the first 4 days of life. However, we noted no significant association between pCO2 levels and CA except on day of life 1, where low pCO2 values were more likely to be associated with a higher MAP–rScO2 correlation. To our knowledge, this is the first study to assess the association of pCO2 and CA in this population using correlation analysis in the time domain. This type of analysis targets slow frequency waves thought to be associated with autoregulatory activity [12].
Similar to previous studies, we noted that rScO2 was positively associated with pCO2, especially above values of 55 mmHg [2, 3]. In contrast to these previous studies, we noted this association on all postnatal days evaluated, including day 1. This may be secondary to our larger numbers allowing for increased power to detect these changes. These data underscore the need for tight control of pCO2 levels, especially in the first days of life of infants are more prone to brain injury [13–15]. In this study, we demonstrate significant variability in pCO2 levels in this timeframe when premature infants are at the highest risk for ischemic-reperfusion injury. Permissive hypercapnia, a lung-sparing practice allowing higher pCO2 concentrations [16–19], is often utilized in the care of preterm infants. Generally, during permissive hypercapnia, pCO2 is maintained between 40 and 55 mmHg and has not been associated with increased incidence of brain injury at these levels [18, 19]. Caution should be taken to avoid extremes of pCO2 as pCO2 levels higher than 55 mmHg in conjunction with a high variability in pCO2 may lead to reperfusion injury.
The observations of an overall lack of association between autoregulation and pCO2 concentrations and an inverse association between pCO2 and impaired CA on day of life differ from previous studies. Previously, two studies have shown impaired CA or a trend toward impaired CA once pCO2 concentrations were greater than 45–50 mmHg [2, 11]. Both studies were relatively small in number and utilized regression analysis to evaluate the autoregulatory relationship over a longer period of time. This methodology may be less sensitive in detecting activity in the low-frequency bandwidth. In addition, these studies had fewer measurements on the first day of life than the current study. During this time, premature infants are more likely to have decreased cardiac output leading to decreased cerebral blood flow, potentially secondary to immature myocardium working against increased vascular resistance and high mean airway pressures used to support their respiratory status. In addition, we speculate that the mechanisms regulating vascular reactivity may be underdeveloped. These differences between our study and the previous studies may explain the differences in the results.
An overall lack of correlation between pCO2 mediated cerebrovascular reactivity and CA underscore that the vasoreactive effects of blood pressure and pCO2 changes are not well understood and may be mediated by distinct mechanisms [20]. A decreased pH due to increased pCO2 leads to blood vessel smooth muscle relaxation, while changes in the cerebrovasculature in response to blood pressure are mediated by myogenic mechanisms [21–23]. The relationship between these two regulatory mechanisms has been shown to be incredibly complex with one signal attenuating the other [24]. We speculate that this relationship would be even more complex in the setting of a premature infant undergoing transition from intrauterine to extrauterine life.
Even less well studied is the relationship between hypocapnia and CA. Hypocapnia is known to cause cerebral blood vessel vasoconstriction leading to decreased cerebral blood flow. In premature infants, hypocapnia has been associated with brain injury, decreased brain activity, and decreased cerebral oxygen saturation [25, 26]. Based on the current, though very limited, data, it has been hypothesized that hypocapnia may result in the CA plateau shifting downward to a lower cerebral blood flow without affecting the lower blood pressure threshold [24]. This, however, may not be the case in premature infants. In a study using complex mathematical modeling to estimate cerebral blood flow, the predicted CA curve noted pressure passive flow at low partial pressures of pCO2 [27], similar to what we noted on day 1 of life. We speculate that this could be secondary to the vasoconstrictive effects of low pCO2 in conjunction with a low cardiac output and cerebral blood flow on the first day of life leading to more pressure passive circulation when the pCO2 is low.
There are several limitations of this study that should be noted. A single center design may limit generalizability. Autoregulation analysis was on the lower bandwidth with a 0.03 Hz sampling rate and was dependent on the presence of an indwelling arterial line to continuously measure blood pressure. Given that the general practice in the NICU is to limit the use of invasive lines, this may self-select for a more critical population. In addition, respiratory management was provider dependent, though generally permissive hypercapnia (pCO2 40–55 mmHg) is allowed. Subjects with a higher severity of illness would have more blood gas measurements which may skew the data, although this was controlled for with mixed effects modeling that clustered at the subject level. In addition, we controlled for multiple potential confounders to address these potential concerns. We acknowledge that there are potential factors that may affect the pCO2–blood pressure–cerebrovascular reactivity relationship that may not have been accounted for. A lack of continuous pCO2 measurements limit the ability to determine a more sensitive temporal relationship and potential effects of pCO2 fluctuations on CA.
In conclusion, we have demonstrated that in premature neonates less than 29 weeks gestational age cerebral blood flow may be increased when pCO2 is greater than 55 mmHg in the first 4 days of life, and autoregulation may be impaired at low levels of pCO2 on day of life one. This underscores the need for vigilant respiratory control especially on the first few days of life until the complex relationship between carbon dioxide, cerebral blood flow, and CA are better understood.
Acknowledgments
Funding
This study is funded by the Mentored Population and Clinical Research Program of the American Heart Association, Award #14CRP18140003 to SBH.
Compliance with ethical standards
Conflict of interest
The authors declare that they have no conflict of interest.
Footnotes
Publisher’s note Springer Nature remains neutral with regard to jurisdictional claims in published maps and institutional affiliations.
References
- 1.Jayasinghe D, Gill AB, Levene MI. CBF reactivity in hypotensive and normotensive preterm infants. Pediatr Res. 2003;54:848–53. doi: 10.1203/01.PDR.0000088071.30873.DA. [DOI] [PubMed] [Google Scholar]
- 2.Noori S, Anderson M, Soleymani S, Seri I. Effect of carbon dioxide on cerebral blood flow velocity in preterm infants during postnatal transition. Acta Paediatr. 2014;103:e334–9. doi: 10.1111/apa.12646. [DOI] [PubMed] [Google Scholar]
- 3.Pryds O, Greisen G, Skov LL, Friis-Hansen B. Carbon dioxide-related changes in cerebral blood volume and cerebral blood flow in mechanically ventilated preterm neonates: comparison of near infrared spectrophotometry and 133Xenon clearance. Pediatr Res. 1990;27:445–9. doi: 10.1203/00006450-199005000-00006. [DOI] [PubMed] [Google Scholar]
- 4.Hoffman SB, Cheng YJ, Magder LS, Shet N, Viscardi RM. Cerebral autoregulation in premature infants during the first 96 h of life and relationship to adverse outcomes. Arch Dis Child Fetal Neonatal Ed. 2018. http://www.ncbi.nlm.nih.gov/pubmed/30385514. [DOI] [PubMed]
- 5.Soul JS, Hammer PE, Tsuji M, et al. Fluctuating pressure-passivity is common in the cerebral circulation of sick premature infants. Pediatr Res. 2007;61:467–73. doi: 10.1203/pdr.0b013e31803237f6. [DOI] [PubMed] [Google Scholar]
- 6.Alderliesten T, Lemmers PM, Smarius JJ, van de Vosse RE, Baerts W, van Bel F. Cerebral oxygenation, extraction, and autoregulation in very preterm infants who develop peri-intraventricular hemorrhage. J Pediatr. 2012. http://www.ncbi.nlm.nih.gov/pubmed/23140883. [DOI] [PubMed]
- 7.O’Leary H, Gregas MC, Limperopoulos C, et al. Elevated cerebral pressure passivity is associated with prematurity-related intracranial hemorrhage. Pediatrics. 2009;124:302–9. doi: 10.1542/peds.2008-2004. [DOI] [PMC free article] [PubMed] [Google Scholar]
- 8.Tsuji M, Saul JP, du Plessis A, et al. Cerebral intravascular oxygenation correlates with mean arterial pressure in critically ill premature infants. Pediatrics. 2000;106:625–32. doi: 10.1542/peds.106.4.625. [DOI] [PubMed] [Google Scholar]
- 9.Gilmore MM, Stone BS, Shepard JA, Czosnyka M, Easley RB, Brady KM. Relationship between cerebrovascular dysautoregulation and arterial blood pressure in the premature infant. J Perinatol. 2011;31:722–9. doi: 10.1038/jp.2011.17. [DOI] [PubMed] [Google Scholar]
- 10.Brady KM, Lee JK, Kibler KK, et al. Continuous time-domain analysis of cerebrovascular autoregulation using near-infrared spectroscopy. Stroke. 2007;38:2818–25. doi: 10.1161/STROKEAHA.107.485706. [DOI] [PMC free article] [PubMed] [Google Scholar]
- 11.Kaiser JR, Gauss CH, Williams DK. The effects of hypercapnia on cerebral autoregulation in ventilated very low birth weight infants. Pediatr Res. 2005;58:931–5. doi: 10.1203/01.pdr.0000182180.80645.0c. [DOI] [PMC free article] [PubMed] [Google Scholar]
- 12.Vesoulis ZA, Mathur AM. Cerebral autoregulation, brain injury, and the transitioning premature infant. Front Pediatr. 2017;5:64. doi: 10.3389/fped.2017.00064. [DOI] [PMC free article] [PubMed] [Google Scholar]
- 13.Levene MI, Fawer CL, Lamont RF. Risk factors in the development of intraventricular haemorrhage in the preterm neonate. Arch Dis Child. 1982;57:410–7. doi: 10.1136/adc.57.6.410. [DOI] [PMC free article] [PubMed] [Google Scholar]
- 14.Dolfin T, Skidmore MB, Fong KW, Hoskins EM, Shennan AT. Incidence, severity, and timing of subependymal and intraventricular hemorrhages in preterm infants born in a perinatal unit as detected by serial real-time ultrasound. Pediatrics. 1983;71:541–6. [PubMed] [Google Scholar]
- 15.Ballabh P. Intraventricular hemorrhage in premature infants: mechanism of disease. Pediatr Res. 2010;67:1–8. doi: 10.1203/PDR.0b013e3181c1b176. [DOI] [PMC free article] [PubMed] [Google Scholar]
- 16.Thome UH, Ambalavanan N. Permissive hypercapnia to decrease lung injury in ventilated preterm neonates. Semin Fetal Neonatal Med. 2009;14:21–7. doi: 10.1016/j.siny.2008.08.005. [DOI] [PubMed] [Google Scholar]
- 17.Carlo WA, Stark AR, Wright LL, et al. Minimal ventilation to prevent bronchopulmonary dysplasia in extremely-low-birth-weight infants. J Pediatr. 2002;141:370–5. doi: 10.1067/mpd.2002.127507. [DOI] [PubMed] [Google Scholar]
- 18.Mariani G, Cifuentes J, Carlo WA. Randomized trial of permissive hypercapnia in preterm infants. Pediatrics. 1999;104:1082–8. doi: 10.1542/peds.104.5.1082. [DOI] [PubMed] [Google Scholar]
- 19.Ryu J, Haddad G, Carlo WA. Clinical effectiveness and safety of permissive hypercapnia. Clin Perinatol. 2012;39:603–12. doi: 10.1016/j.clp.2012.06.001. [DOI] [PubMed] [Google Scholar]
- 20.Jeong SM, Kim SO, DeLorey DS, Babb TG, Levine BD, Zhang R. Lack of correlation between cerebral vasomotor reactivity and dynamic cerebral autoregulation during stepwise increases in inspired CO2 concentration. J Appl Physiol. 2016;120:1434–41. doi: 10.1152/japplphysiol.00390.2015. [DOI] [PubMed] [Google Scholar]
- 21.Ainslie PN, Duffin J. Integration of cerebrovascular CO2 reactivity and chemoreflex control of breathing: mechanisms of regulation, measurement, and interpretation. Am J Physiol Regul Integr Comp Physiol. 2009;296:R1473–95. doi: 10.1152/ajpregu.91008.2008. [DOI] [PubMed] [Google Scholar]
- 22.Paulson OB, Strandgaard S, Edvinsson L. Cerebral autoregulation. Cerebrovasc Brain Metab Rev. 1990;2:161–92. [PubMed] [Google Scholar]
- 23.Zhang R, Zuckerman JH, Giller CA, Levine BD. Transfer function analysis of dynamic cerebral autoregulation in humans. Am J Physiol. 1998;274:H233–41. doi: 10.1152/ajpheart.1998.274.1.h233. [DOI] [PubMed] [Google Scholar]
- 24.Meng L, Gelb AW. Regulation of cerebral autoregulation by carbon dioxide. Anesthesiology. 2015;122:196–205. doi: 10.1097/ALN.0000000000000506. [DOI] [PubMed] [Google Scholar]
- 25.Dix LML, Weeke LC, de Vries LS, et al. Carbon dioxide fluctuations are associated with changes in cerebral oxygenation and electrical activity in infants born preterm. J Pediatr. 2017;187:66–72 e1. doi: 10.1016/j.jpeds.2017.04.043. [DOI] [PubMed] [Google Scholar]
- 26.Greisen G, Vannucci RC. Is periventricular leucomalacia a result of hypoxic-ischaemic injury? Hypocapnia and the preterm brain. Biol Neonate. 2001;79:194–200. doi: 10.1159/000047090. [DOI] [PubMed] [Google Scholar]
- 27.Sidorenko I, Turova V, Botkin N, et al. Modeling cerebral blood flow dependence on carbon dioxide and mean arterial blood pressure in the immature brain with accounting for the germinal matrix. Front Neurol. 2018;9:812. doi: 10.3389/fneur.2018.00812. [DOI] [PMC free article] [PubMed] [Google Scholar]


