Abstract
Three hexacoordinated octahedral nickel (II) complexes, [Ni (Trp-sal) (phen) (CH3OH)] (1), [Ni (Trp-o-van) (phen) (CH3OH)]•2CH3OH (2), and [Ni (Trp-naph) (phen) (CH3OH)] (3) (where Trp-sal = Schiff base derived from tryptophan and salicylaldehyde, Trp-o-van = Schiff base derived from tryptophan and o-vanillin, Trp-naph = Schiff base derived from tryptophan and 2-hydroxy-1-naphthaldehyde, phen = 1, 10-phenanthroline), have been synthesized and characterized as potential anticancer agents. Details of structural study of these complexes using single-crystal X-ray crystallography showed that distorted octahedral environment around nickel (II) ion has been satisfied by three nitrogen atoms and three oxygen atoms. All these complexes displayed moderate cytotoxicity toward esophageal cancer cell line Eca-109 with the IC50 values of 23.95 ± 2.54 μM for 1, 18.14 ± 2.39 μM for 2, and 21.89 ± 3.19 μM for 3. Antitumor mechanism studies showed that complex 2 can increase the autophagy, reactive oxygen species (ROS) levels, and decrease the mitochondrial membrane potential remarkably in a dose-dependent manner in the Eca-109 cells. Complex 2 can cause cell cycle arrest in the G2/M phase. Additionally, complex 2 can regulate the Bcl-2 family and autophagy-related proteins.
1. Introduction
The significant findings that cisplatin serves as a chemotherapeutic agent quickly promoted significant breakthroughs in metal-based anticancer complexes [1]. Recently, cisplatin and its analogs such as carboplatin and oxaliplatin are still used worldwide for the treatment of different cancers [2, 3]. However, these drugs exhibit serious side effects including severe toxicity and acquired drug resistance which have limited its clinical applications [4–6]. Therefore, exploring new metal drugs to overcome these limitations is crucial for the treatment of cancer. With this aim, various classes of metal compounds have been synthesized, and their anticancer activity has been successfully evaluated both in vitro and in vivo [7–9].
Amino acid Schiff base is usually a compound formed by the condensation of amino acid and different active carbonyl groups. In fact, Schiff base compounds and their metal complexes are outstanding in the field of metal-based drugs [10–13]. The Schiff base complexes have been extensively studied in this perspective due to their wide applications in medicine [14–17]. Nickel, as an essential trace element for human beings, animals, microorganisms, and plants, has been known as a component in many enzymes, playing a crucial role in important metabolic reactions [18–23]. In addition to this, various nickel (II) complexes have been synthesized and evaluated as metal-based drugs which demonstrated many bioactivities such as anticonvulsant, antibacterial, antifungal, antimicrobial, antioxidant, and anticancer [24–30].
In our previous work, we investigated the DNA interaction and SOD activity of nickel (II) complexes containing L-phenylalanine Schiff base and 1, 10-phenanthroline [31]. The results showed that three synthesized complexes have the ability to interact with DNA, mainly in the binding and cleaving. Moreover, these complexes also demonstrated promising superoxide scavenging activities which indicate that the nickel (II) complexes could be employed as antiaging agents. In this paper, a series of tryptophan Schiff base nickel (II) complexes have been synthesized and characterized as potential anticancer agents. The in vitro antiproliferative activity of complexes 1–3 was investigated by cytotoxicity against four cancer cell lines (MCF-7, SGC-7901, Eca-109, and HepG2), as well as a nontumorigenic cell line HSF. To elucidate the possible anticancer mechanisms, the impacts of complex 2 toward Eca-109 were evaluated for cell morphology (AO/EB, and Hoechst 33342 staining), apoptosis, autophagy, reactive oxygen species, mitochondrial membrane potential, cell cycle arrest, and related protein expression level.
2. Results and Discussion
2.1. Syntheses of the Complexes and Ligands
The complexes 1, 2, and 3 were synthesized in a one-pot method as depicted in Scheme 1. Schiff base L1 (Trp-sal), L2 (Trp-o-van), and L3 (Trp-naph) were synthesized according to the procedure reported in the literature [32–34]. Complexes 1, 2, and 3 were characterized using single-crystal X-ray crystallography, element analysis, and IR spectrum. The detailed synthesis procedure is shown in Scheme 1.
Scheme 1.
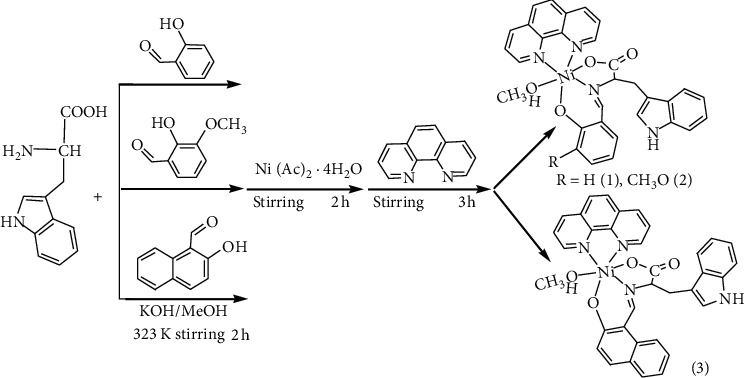
Synthetic routes for the preparation of the complexes [Ni (Trp-sal) (phen) (CH3OH)] (1), [Ni (Trp-(o)-van) (phen) (CH3OH)]•2CH3OH (2), and [Ni (Trp-naph) (phen) (CH3OH)] (3).
2.2. Crystal Structure of Three Nickel (II) Complexes
As shown in Figure 1, complexes 1 and 2 both have one independent molecular monomer in their asymmetric units, respectively, and two independent molecules in complex 3 in their asymmetric units. Their selected bond distances and angles are listed in Table 1.
Figure 1.
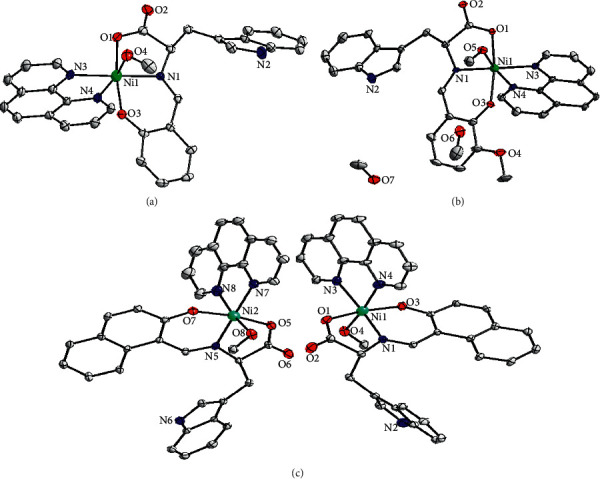
Molecular structures of complexes 1 (a), 2 (b), and 3 (c) with some atoms labeled. Hydrogen atoms on the ligands are omitted for clarity.
Table 1.
Selected bond lengths (Å) and bond angles (°) for complexes 1, 2, and 3.
| Complex 1 | |||||
|---|---|---|---|---|---|
| Ni1-N1 | 2.008 (4) | Ni1-O3 | 2.009 (4) | Ni1–O1 | 2.066 (4) |
| Ni1–N3 | 2.082 (4) | Ni1–N4 | 2.129 (4) | Ni1–O4 | 2.132 (4) |
| N1-Ni1-O3 | 90.71 (17) | N1-Ni1-O1 | 81.23 (16) | O3-Ni1-O1 | 171.92 (16) |
| N1-Ni1-N3 | 176.51 (19) | O3-Ni1-N3 | 91.93 (17) | O1-Ni1-N3 | 96.15 (16) |
| N1-Ni1-N4 | 98.65 (17) | O3-Ni1-N4 | 91.28 (17) | O1-Ni1-N4 | 90.50 (16) |
| N3-Ni1-N4 | 79.02 (17) | N1-Ni1-O4 | 91.44 (17) | O3-Ni1-O4 | 86.55 (18) |
| O1-Ni1-O4 | 93.05 (18) | N3-Ni1-O4 | 90.99 (19) | N4-Ni1-O4 | 169.71 (18) |
|
| |||||
| Complex 2 | |||||
|
| |||||
| Ni1-N1 | 2.007 (6) | Ni1-O3 | 2.025 (5) | Ni1-O1 | 2.075 (5) |
| Ni1-N3 | 2.092 (6) | Ni1-N4 | 2.125 (5) | Ni1-O5 | 2.130 (4) |
| N1-Ni1-O3 | 90.4 (2) | N1-Ni1-O1 | 81.2 (2) | O3-Ni1-O1 | 171.42 (19) |
| N1-Ni1-N3 | 175.3 (2) | O3-Ni1-N3 | 92.2 (2) | O1-Ni1-N3 | 96.3 (2) |
| N1-Ni1-N4 | 97.0 (2) | O3-Ni1-N4 | 87.1 (2) | O1-Ni1-N4 | 95.74 (19) |
| N3-Ni1-N4 | 79.3 (2) | N1-Ni1-O5 | 92.4 (2) | O3-Ni1-O5 | 90.99 (19) |
| O1-Ni1-O5 | 87.46 (18) | N3-Ni1-O5 | 91.5 (2) | N4-Ni1-O5 | 170.5 (2) |
|
| |||||
| Complex 3 | |||||
|
| |||||
| Ni1–N1 | 1.979 (6) | Ni1–O3 | 2.005 (5) | Ni1–O1 | 2.043 (5) |
| Ni1-N3 | 2.080 (7) | Ni1-N4 | 2.110 (6) | Ni1-O4 | 2.126 (5) |
| Ni2-N5 | 1.988 (6) | Ni2-O7 | 1.997 (5) | Ni2-O5 | 2.033 (5) |
| Ni2-N (7) | 2.087 (7) | Ni2-N8 | 2.093 (8) | Ni2-O8 | 2.121 (5) |
| N1–Ni1–O3 | 89.0 (2) | N1–Ni1–O1 | 81.4 (2) | O3–Ni1–O1 | 170.3 (2) |
| N1-Ni1-N3 | 172.3 (2) | O3-Ni1-N3 | 98.1 (2) | O1-Ni1-N3 | 91.3 (2) |
| N1-Ni1-N4 | 97.8 (2) | O3-Ni1-N4 | 89.2 (2) | O1-Ni1-N4 | 90.3 (2) |
| N3-Ni1-N4 | 79.4 (3) | N1-Ni1-O4 | 93.3 (2) | O3-Ni1-O4 | 86.3 (2) |
| O1-Ni1-O4 | 96.1 (2) | N3-Ni1-O4 | 90.2 (3) | N4-Ni1-O4 | 168.0 (2) |
| N5-Ni2-O7 | 89.1 (2) | N5-Ni2-O5 | 80.9 (2) | O7-Ni2-O5 | 169.8 (2) |
| N5-Ni2-N7 | 177.7 (2) | O7-Ni2-N7 | 92.7 (2) | O5-Ni2-N7 | 97.3 (2) |
| N5-Ni2-N8 | 99.2 (3) | O7-Ni2-N8 | 88.0 (3) | O5-Ni2-N8 | 91.7 (2) |
| N (7)-Ni2-N8 | 79.3 (3) | N5-Ni2-O8 | 93.0 (2) | O7-Ni2-O8 | 87.7 (2) |
| O5-Ni2-O8 | 94.7 (2) | N (7)-Ni2-O8 | 88.6 (3) | N8-Ni2-O8 | 167.0 (3) |
Single-crystal X-ray diffraction reveals that Ni (II) atom is six-coordinated by two N atoms from phen ligand, one N atom and two O atoms from Schiff base ligand, and one O atom from coordinated CH3OH ligand, forming a distorted octahedral geometric configuration in the structure of complex 1. The equatorial coordination to Ni (II) ion is provided by N3 atom from phen ligand and O1, N1, and O3 atoms from Schiff base ligand (Figure 1(a)). The Ni1 ion lies 0.0168 (22) Å above the equatorial plane. The dihedral angle formed by the equatorial plane and phen ligand is 89.86 (12)°, indicating that they are almost in a vertical position. The two axial sites of the octahedron are occupied by N4 atom from the phen ligand and one O4 atom from the methanol molecule. The N4–Ni–O4 bond angle is less than 180° and is equal to 169.71 (18)°. The Ni–O bond distances vary from 2.009 (4) to 2.132 (4) Å and Ni–N bond lengths range from 2.008 (4) to 2.129 (4) Å. Similar to complex 1, the coordination environment of the Ni1 ion in complex 2 is also a distorted octahedral geometric configuration (Figure 1(b)). The Ni1 ion lies 0.0225 (31) Å above the equatorial plane formed by O1, O3, N1, and N3 atoms. The dihedral angle formed by the equatorial plane and phen ligand is 84.21 (16)°. The bond angle O5–Ni1–N4 = 170.5 (2)° is not close to 180° with the deviation from linearity of 9.5°, which is consistent with the data obtained for the complex 1. Complex 3 crystallized in the monoclinic system, P21 space group, contains two molecules in the asymmetric unit. As shown in Figure 1(c), the coordination geometry of the Ni1 and Ni2 is a slightly distorted octahedron with the small differences in the structure parameters. In the coordination sphere for the Ni1 ion, the equatorial positions are occupied by N1, O1, O3, and N3 atoms from Schiff base ligand and phen ligand, while the two axial sites are occupied by the O4 and N4 atoms. The Ni1 ion lies 0.0438 (31) Å above the equatorial plane with Ni1–N4 = 2.110 (6) Å and Ni1–O4 = 2.126 (5) Å. The phenanthroline ligand coordinated to Ni1 in the direction almost vertical to the equatorial plane with the dihedral angle 88.94 (19)°. Around the Ni2 ion, N8 and O8 atoms occupy the axial positions of the octahedral geometry with the bond angle O8–Ni1–N8 = 167.0 (3)°. The equatorial plane of the octahedron is formed by O5, O7, N5, and N7 atoms. The Ni2 ion is situated 0.0315 (33) Å above the equatorial plane with bond lengths Ni2–N8 = 2.093 (8) Å and Ni2–O8 = 2.121 (5) Å, respectively. The dihedral angle formed by the equatorial plane and the phenanthroline ligand is 85.68 (17)°, which is markedly less than the above dihedral angle, indicating the obviously distorted coordination geometry.
2.3. Cytotoxicity Assay In Vitro
The cytotoxic activities of the ligands (L1, L2, and L3) and three hexacoordinated octahedral nickel (II) complexes 1–3 and Ni (CH3COO)2 were evaluated against four human cancer cell lines (including breast cancer MCF-7, gastric cancer SGC-7901, esophageal cancer Eca-109, and hepatocellular carcinoma HepG2) as well as normal human cells HSF using MTT assay method. The cytotoxicity of cisplatin was also evaluated for comparison. As shown in Table 2, Schiff base ligands L1 and L2 showed no toxicity with IC50 values being higher than 80 μM to four human cancer cell lines. L3 and Ni (CH3COO)2 had weak cytotoxic effects toward SGC-7901 and Eca-109 cells with IC50 values of 42.70 ± 1.13, 48.36 ± 4.99, and 41.35 ± 0.87, 43.51 ± 1.34, respectively. In contrast, complexes showed moderate cytotoxic toward Eca-109 cells with the IC50 values of 23.95 ± 2.54, 18.14 ± 2.39, and 21.89 ± 3.19 μM, respectively. Since the complexes displayed sensitive cytotoxicity toward Eca-109 cells, this cell line was employed for further investigation to explain the anticancer mechanism.
Table 2.
IC50 values (μM) of complexes 1, 2, and 3 against human cell lines.a
| Complex | MCF-7 | SGC-7901 | Eca-109 | HepG2 | HSF |
|---|---|---|---|---|---|
| Trp + sal + Ni + phen (1) | 75.75 ± 0.41 | 33.99 ± 2.50 | 23.95 ± 2.54 | >80.00 | 60.94 ± 1.76 |
| Trp + o-van + Ni + phen (2) | 16.09 ± 1.32 | 15.69 ± 1.46 | 18.14 ± 2.39 | 47.29 ± 0.35 | 23.91 ± 0.74 |
| Trp + naph + Ni + phen (3) | 23.74 ± 0.55 | 24.29 ± 0.95 | 21.89 ± 3.19 | 28.11 ± 1.34 | 32.54 ± 1.98 |
| L1 | >80.00 | >80.00 | >80.00 | >80.00 | —— |
| L2 | >80.00 | >80.00 | >80.00 | >80.00 | —— |
| L3 | >80.00 | 42.70 ± 1.13 | 48.36 ± 4.99 | >80.00 | —— |
| Ni (CH3COO)2 | >80.00 | 41.35 ± 0.87 | 43.51 ± 1.34 | >80.00 | —— |
| Cisplatin | 12.34 ± 0.75 | 11.73 ± 1.45 | 11.87 ± 0.19 | 13.94 ± 0.58 | 17.13 ± 1.31 |
aCell viability was determined by MTT assay after treatment for 48 h.
Annexin V-PE/7-AAD staining assay was performed to analyze the cell death induced by complex 2 for 24 h using flow cytometry. Figure 2 showed that the percentage of apoptotic cells, which were 7.30% for control, 8.78% for 20 μM, and 29.40% for 40 μM, had increased remarkably in a dosage-dependent manner.
Figure 2.
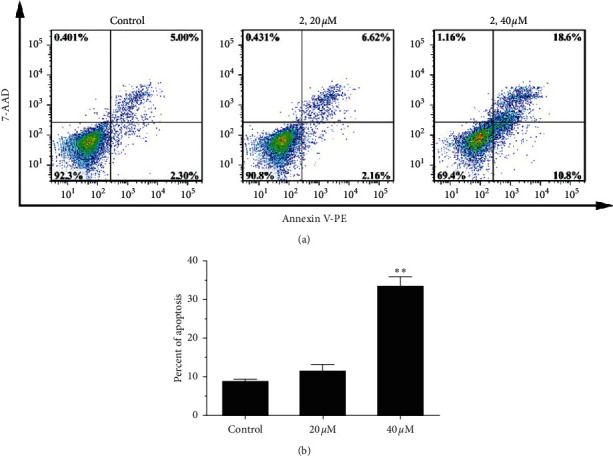
(a) Apoptosis of Eca-109 cells was detected by Annexin V-PE/7-AAD staining assay after coincubation with different concentrations (0, 20, and 40 μM) of complex 2 for 24 h. (b) Quantitative data analysis for the number of cells (% of total) in apoptosis for different treatment groups. Data were presented as mean ± SD (n = 3), Student's t-test, ∗∗P < 0.01.
2.4. Morphological Analysis of Cells by AO/EB and Hoechst 33342 Staining
Apoptosis and necrosis, as the common cellular responses of anticancer complexes toward cancer cells, always induced the morphological changes of cells [35]. Acridine orange (AO)/ethidium bromide (EB) are used together to differentiate between viable, apoptotic, and necrotic cells, where live cells display bright green fluorescence with normal cytoplasm and nuclei morphology and early apoptotic cells display green fluorescence with nuclear shrinkage and chromatin condensation. Meanwhile, necrotic cells show red fluorescing without chromatin fragmentation, and late apoptotic cells stain red fluorescence with nuclear shrinkage and chromatin condensation [36]. As shown in Figure 3(a), the untreated Eca-109 cells were stained with uniform green fluorescence. After the treatment with 20 μM and 40 μM complex 2 for 24 h, the obvious morphological changes such as nuclear shrinkage, chromatin condensation, and late apoptotic cells containing red apoptotic bodies as the arrow pointed were observed. The apoptosis was also investigated with the Hoechst 33342 staining method. Hoechst 33342 is a specific stain for nuclei in living cells that had a light green fluorescent cytoplasm and apoptotic cells had bright, fragmented nuclei containing condensed chromatin. As indicated in Figure 3(b), after the treatment with 20 μM and 40 μM complex 2 for 24 h, the apoptotic characteristics were also observed, especially for 40 μM. These results demonstrated that complex 2 can induce the apoptosis of Eca-190 cells in a concentration-dependent manner.
Figure 3.
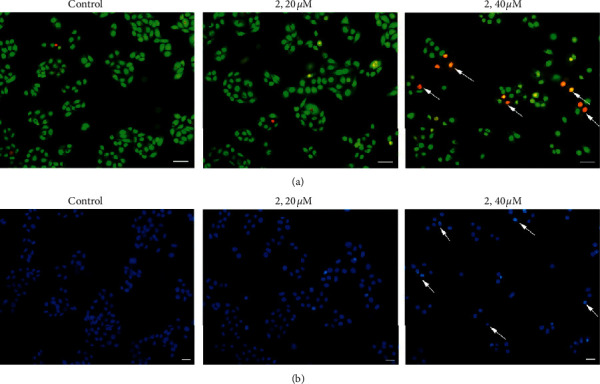
Eca-109 cells were stained with AO/EB (a) and Hoechst 33342 (b) after being exposed to complex 2 (0, 20, and 40 μM) for 24 h under a fluorescence microscope. Representative photomicrographs from three independent experiments. Arrows indicate apoptotic bodies. Scale bars: 20 µm.
2.5. Intracellular Reactive Oxygen Species (ROS) Levels' Determination
It has been reported that the increasing intracellular ROS levels could result in mitochondrial dysfunction, enter the nucleus to cause DNA damage, and finally induce cell apoptosis [37]. In order to elucidate the association between cytotoxicity and the generation of ROS, the Eca-109 cells were exposed to 20 μM and 40 μM complex 2 for 24 h, and then the ROS levels were evaluated using a 2',7'-dichlorodihydrofluorescein diacetate (DCFH-DA) as a fluorescent probe. The DCFH-DA dye can be cleaved by intracellular esterases into its nonfluorescent form 2',7'-dichloro-3,6-fluorandiol (DCFH). Then, the no-fluorescent substrate is oxidized by intracellular free radicals to produce a fluorescent product, dichlorofluorescein (DCF) [38]. As shown in Figure 4(a), in the control group, low intracellular fluorescence intensity can be observed due to the low ROS level, which is difficult for DCHF-DA to be transferred into the fluorescent product DCF. After the treatment of Eac-109 cells with 20 μM and 40 μM complex 2 for 24 h, numerous green fluorescent points can be found in the cells, and with the increasing concentration of complex 2, a more bright green fluorescent point can be observed, which means the increase of ROS level. These results demonstrated that complex 2 could increase the intracellular ROS level in a dosage-dependent manner.
Figure 4.
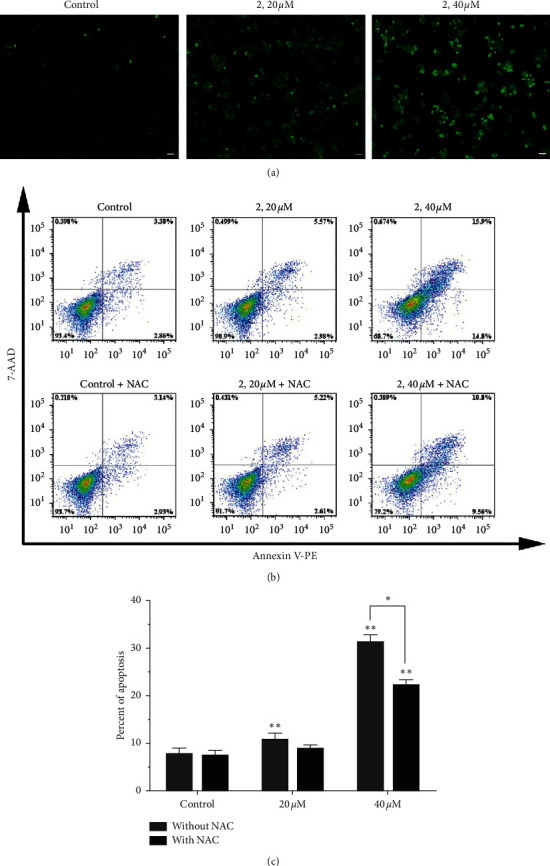
(a) Intracellular ROS was detected in Eca-190 cells after exposure to complex 2 (0, 20, and 40 μM) for 24 h under a fluorescence microscope. Representative photomicrographs from three independent experiments. Scale bars: 20 µm. (b) Apoptosis of Eca-109 cells was detected by flow cytometry after treated with different concentrations (0, 20, and 40 μM) of complex 2 for 24 h with or without NAC pretreatment. (c) Quantitative data analysis for the number of cells (% of total) in apoptosis for different treatment groups. Data were presented as mean ± SD (n = 3), Student's t-test, ∗P < 0.05, ∗∗P < 0.01.
N-acetyl-L-cysteine (NAC), as a ROS scavenger, was used to examine the role of ROS generation in complex 2 induced apoptotic cell death. The percentage of apoptotic cells was detected by Annexin V-PE/7-AAD staining assay after complex 2 treatment with or without NAC. With the NAC pretreatment, the percentage of apoptosis cells induced by complex 2 was reduced as shown in Figures 4(b) and 4(c). Those results suggested that ROS generated by complex 2 plays an important role in inducing apoptotic in Eca-109 cells.
2.6. Autophagy Induced by Complex 2
Autophagy, as a life phenomenon and lysosomal degradation pathway, exists widely in the cell, and it is crucial for homeostasis under normal conditions [39]. Autophagy has been considered to be a survival response to growth factor or nutrient deprivation and also reported to play a critical role in tumor cell suppression [40]. Monodansylcadaverine (MDC), a fluorescent compound, is incorporated into multilamellar bodies by both an ion trapping mechanism and the interaction with membrane lipids, as a probe for the detection of autophagic vacuoles in cultured cells. In order to determine the autophagic effect of the complex 2 on Eca-190 cells, the cells were treated with complex 2 for 24 h and then stained with MDC. As shown in Figures 5(a) and 5(b), the MDR staining intensity increased significantly after treatment with 20 μM and 40 μM complex 2 compared to the control group. These results indicated that complex 2 could increase the autophagy level of Eca-190 cells in a dosage-dependent manner.
Figure 5.
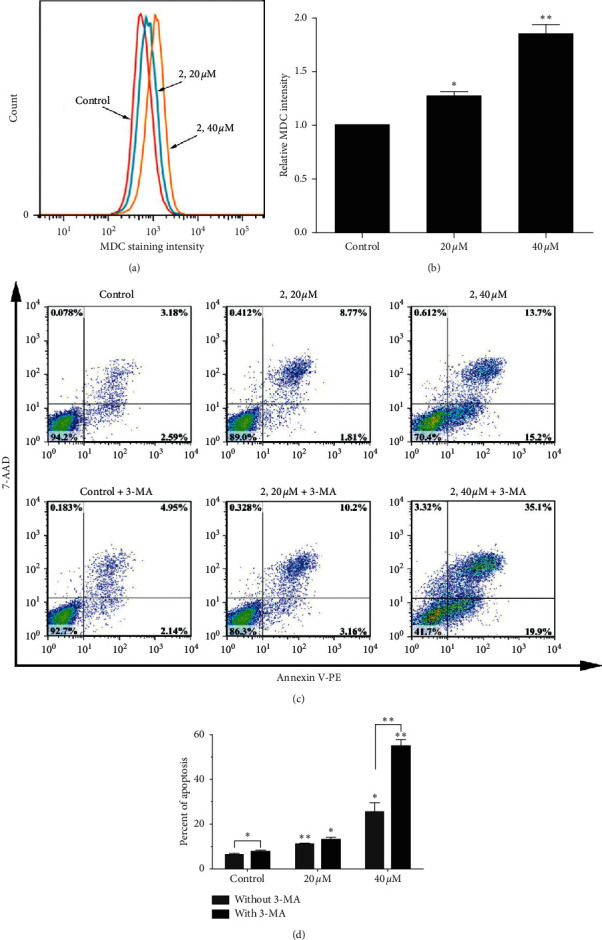
(a) Autophagy was detected in Eca-190 cells after exposure to complex 2 (0, 20, and 40 μM) for 24 h using MDC staining assay. (b) Relative quantitative data analysis of MDC fluorescence intensity for different treatment groups. (c) Apoptosis of Eca-109 cells was detected by flow cytometry after treated with complex 2 (0, 20, and 40 μM) for 24 h with or without pretreatment of 3-MA. (d) Quantitative data analysis for the number of cells (% of total) in apoptosis for different treatment groups. Data were presented as mean ± SD (n = 3), Student's t-test, ∗P < 0.05, ∗∗P < 0.01.
To investigate whether the autophagy affects the cell viability, Eca-109 cells were treated by different concentrations of the complex 2 with or without autophagic inhibitor 3-methyladenine (3-MA). As shown in Figures 5(c) and 5(d), 3-MA had nontoxicity toward cells, but 3-MA decreased the cell viability caused by complex 2 in various degrees, which indicates that the autophagy inhibits the cell death.
2.7. Mitochondrial Dysfunction Induced by Complex 2
As an important role in apoptosis, mitochondria can release proapoptotic factors such as cytochrome c and other apoptosis-inducing factors [41]. The mitochondrial dysfunction associated with apoptosis was assayed using 5,5′,6, 6′-tetrachloro-1,1′, 3,3′-tetraethylbenzimidalylcarbo cyanine iodide (JC-1) as a fluorescent probe. JC-1 forms aggregates and emits a red fluorescence corresponding to high mitochondrial membrane potential [42, 43]. After mitochondrial dysfunction, the mitochondrial membrane potential (MMP) will be decreased, and JC-1 forms monomer and emits green fluorescence. As shown in Figure 6, after 24 h of incubation with complex 2, the green fluorescence of the JC-1 monomers increases from 4.69% (control) to 6.86% (20 μM) and 49.5% (40 μM), indicating loss of MMP.
Figure 6.
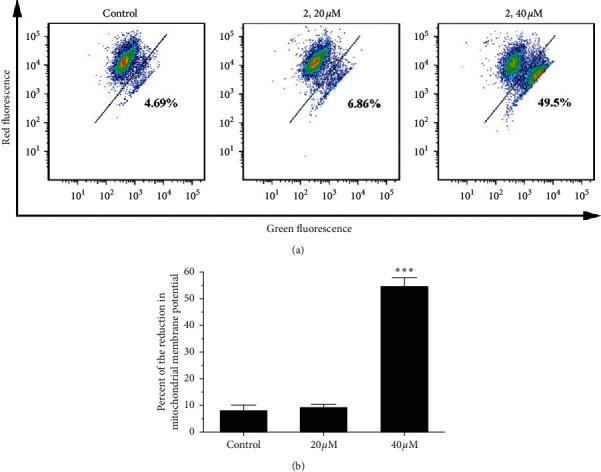
(a) Eca-109 cells' mitochondrial membrane potential was detected by JC-1 staining assay after coincubation with different concentrations (0, 20, and 40 μM) of complex 2 for 24 h. (b) Quantitative data analysis for the number of cells (% of total) in the reduction of mitochondrial membrane potential for different treatment groups. Data were presented as mean ± SD (n = 3), Student's t-test, ∗∗P < 0.01.
2.8. Cell Cycle Arrest Assay
It is reported that inhibition of cancer cell proliferation by cytotoxic drugs could be the result of cell cycle arrest, apoptosis, or their combination. To investigate whether the antiproliferative effect of complex 2 on Eca-109 cells was triggered by cell cycle arrest, the cell cycle phase ratio was measured by flow cytometry with propidium iodide (PI) staining. As shown in Figure 7, in the control, the percentage in the cell at the G2/M phase is 6.35%. After the cells were coincubated with different concentrations of complex 2, the percentage in the cell at the G2/M phase is 7.21% for 20 μM and 19.84% for 40 μM. Meanwhile, the percentage in the cell at the G0/G1 phase is 63.82% for control, 59.51% for 20 μM, and 48.84% for 40 μM, respectively. Obviously, these results demonstrate that complex 2 inhibits cell growth in Eca-109 at the G2/M phase.
Figure 7.
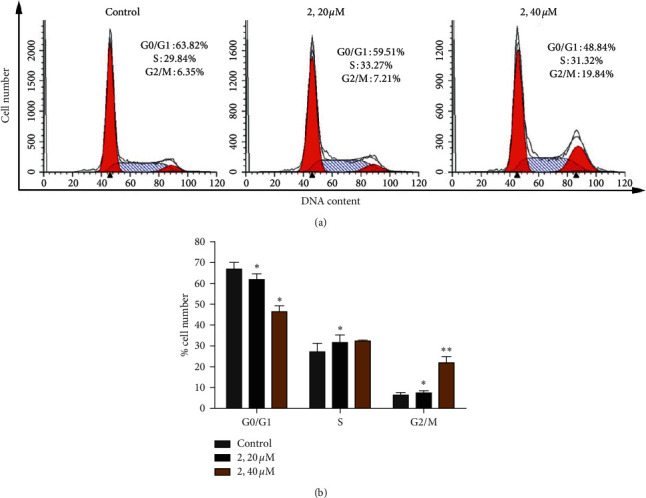
(a) Cell cycle distribution was performed by PI staining after being coincubated with complex 2 (0, 20, and 40 μM) for 24 h. (b) Quantitative data analysis for the number of cells (% of total) in each cell phase for different treatment groups. Data were presented as mean ± SD (n = 3), Student's t-test, ∗P < 0.05, ∗∗P < 0.01.
2.9. The Expression of Bcl-2 Family and Autophagy-Related Proteins
Bcl-2 family proteins, known as one important regulatory factor of apoptosis, were investigated in this study by Western blot assay [35, 44]. As shown in Figures 8(a) and 8(b), the expression levels of antiapoptotic proteins Bcl-2 and Bcl-xL were significantly decreased, whereas proapoptotic proteins Bax and Bad were significantly increased in a concentration-dependent manner after Eca-109 cells being exposed to the complex 2 for 24 h. These results suggested that complex 2 can induce apoptotic in the mitochondrial pathways.
Figure 8.
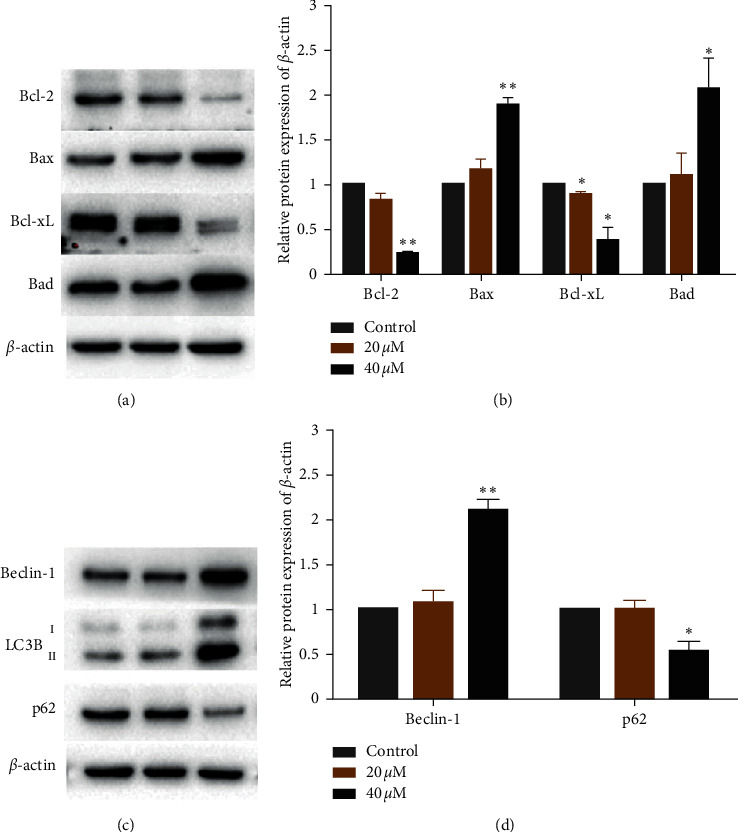
The expression of (a) Bcl-2 family and (c) autophagy-related proteins in Eca-109 cells treated with complex 2 for 24 h. (b, d) Quantitative analysis of Western blotting from (a) and (c) by Image Lab program with β-actin as the internal control. Data were presented as mean ± SD (n = 3), Student's t-test, ∗P < 0.05, ∗∗P < 0.01.
Autophagy, as a cellular degradation process, can be activated in tumor cells during anticancer drugs action. With the initiation of autophagy and the formation of autophagosome, Beclin-1 binds LC3B and interacts with the ubiquitin-binding protein p62. As shown in Figures 8(c) and 8(d), the expression levels Beclin-1 and LC3B-II increased, whereas p62 decreased in a concentration-dependent manner after Eca-109 cells being exposed to the complex 2 for 24 h. These results suggested autophagy can be activated during complex 2 anticancer actions.
3. Conclusions
Three hexacoordinated octahedral nickel (II) complexes were synthesized and characterized as potential anticancer agents in this study. These complexes showed moderate cytotoxicity toward Eca-109 cells and complex 2 was selected for further investigation to explain the mechanism of apoptosis. The percentage of apoptotic cells was increased remarkably in a dose-dependent manner after coincubation with complex 2 for 24 h. AO/EB and Hoechst 33342 staining showed that complex 2 can change the morphological of cells and induce apoptosis in a concentration-dependent manner. Complex 2 can increase the intracellular ROS level and induce a decrease in the mitochondrial membrane potential, which plays an important role in inducing apoptotic. The cell cycle arrest studies demonstrate that complex 2 inhibits cell growth in Eca-109 cells at the G2/M phase. The autophagy level could be also increased by complex 2, and autophagy, playing a protective role, inhibits cell death. Additionally, complex 2 can regulate the Bcl-2 family and autophagy-related proteins in a concentration-dependent manner. In summary, we found that amino acid Schiff base nickel complexes can effectively inhibit cancer cell growth mainly through mitochondrial dysfunction, intracellular ROS accumulation, and ROS- mediated DNA damage, and this work will be helpful for the design and synthesis of new amino acid Schiff base nickel complexes as promising antitumor agents.
4. Experimental
4.1. Materials and Methods
Salicylaldehyde, o-vanillin, and 2-hydroxy-1-naphthaldehyde were purchased from Alfa Aesar. D-tryptophan was obtained from Beijing Jingke Company. The other chemicals were obtained from commercial sources and used without further purification unless otherwise noted. All reagents were AR grade or biochemical quality. Ultrapure Milli-Q water was used in all experiments.
Elemental analyses (C, H, N) were performed on a Perkin-Elmer 2400 II analyzer, and IR spectra were recorded as KBr pellets on a Nicolet 5700 FT-IR instrument in the frequency range 400–4000 cm−1.
4.2. Syntheses of the Complexes
4.2.1. Synthesis of Complex [Ni (Trp-sal) (phen) (CH3OH)] (1)
For complex 1, D-tryptophan (1 mmol, 204.2 mg) and potassium hydroxide (1 mmol, 56.1 mg) were dissolved in methanol (15 mL) at 50°C. A methanol solution (3 mL) of salicylaldehyde (1 mmol, 0.11 mL) was added and stirred for 2 h. Subsequently, an aqueous solution (3 mL) of nickel acetate tetrahydrate (248.86 mg, 1 mmol) was added dropwise and stirred for 2 h. Finally, a methanol solution (5 mL) of 1,10-phenanthroline (1 mmol, 198.2 mg) was added and continuously stirred for 3 h. After the reaction was completed, the resultant solution was held at room temperature for weeks, whereupon green blocky crystals suitable for X-ray diffraction were obtained. Yield: 82%. Anal. Found (%) for C31H26N4NiO4 (Mol. wt = 577.27): C, 64.15%; H, 4.86%; N, 9.35%. Calculated (%) for C, 64.50%; H, 4.54%; N, 9.70%. IR spectra of the complex 1 were shown in Figure S1(a). Selected IR bands (KBr pellets,/cm−1, s, strong absorption; m, middle absorption; w, weak absorption): 3,411 (s), 1,636 (s), 1,595 (s), 1,516 (m), 1,496 (m), 1,467 (m), 1,426 (m), 1,339 (m), 1,305 (m), 1,223 (m), 1,182 (w), 1,127 (w), 1,085 (w), 1,011 (w), 962 (m), 848 (m), 765 (w), 728 (m), 642 (w), 545 (w), 451 (w), 427 (w).
4.2.2. Synthesis of the Complex [Ni (Trp-o-van) (phen) (CH3OH)]•2CH3OH (2)
The preparation of complex 2 follows the same procedure as that of complex 1 except that a solution of o-vanillin (1 mmol, 152.2 mg) in methanol (3 mL) was used to take the place of salicylaldehyde solution. Green single crystals of 2 suitable for X-ray diffraction were obtained at room temperature. Yield: 85%. Anal. Found (%) for C34H36N4NiO7 (Mol. wt = 671.38): C, 60.48%; H, 5.84%; N, 8.57%. Calculated (%) for C, 60.82%; H, 5.40%; N, 8.34%. IR spectra of the complex 2 were shown in Figure S1(b). Selected IR bands (KBr pellets,/cm−1, s, strong absorption; m, middle absorption; w, weak absorption): 3,404 (s), 1,634 (s), 1,596 (s), 1,517 (m), 1,495 (m), 1,469 (m), 1,443 (m), 1,426 (m), 1,384 (m), 1,287 (m), 1,216 (m), 1,127 (w), 1,083 (w), 1,010 (w), 988 (m), 850 (m), 744 (w), 728 (m), 643 (w), 535 (w), 426 (w).
4.2.3. Synthesis of the Complex [Ni (Trp-Naph) (phen) (CH3OH)] (3)
The preparation of complex 3 follows the same procedure as that of complex 1 except that a solution of 2-Hydroxy-1-naphthaldehyde (1 mmol, 172.2 mg) in methanol (3 mL) was used to take the place of salicylaldehyde solution. Green crystals of 3 suitable for X-ray diffraction were also obtained at room temperature. Yield: 80%. Anal. Found (%) for C35H28N4NiO4 (Mol. wt = 627.32): C, 67.38%; H, 4.35%; N, 9.21%. Calculated (%) for C, 67.01%; H, 4.50%; N, 8.93%. IR spectra of the complex 3 were shown in Figure S1(c). Selected IR bands (KBr pellets,/cm−1, s, strong absorption; m, middle absorption; w, weak absorption): 3,412 (s), 1,620 (s), 1,540 (s), 1,516 (m), 1,458 (m), 1,426 (m), 1,343 (m), 1,302 (m), 1,249 (m), 1,182 (w), 1,127 (w), 1,092 (w), 1,037 (w), 974 (m), 845 (m), 748 (w), 728 (m), 642 (w), 564 (w), 454 (w), 427 (w).
4.3. X-Ray Crystallography
The X-ray diffraction data of complexes 1, 2, and 3, were collected at 298 K with Mo-Ka radiation (λ = 0.071073 nm) using a Bruker Smart-1000 CCD diffractometer equipped with a graphite monochromator. Diffraction intensities for the complexes were collected by using the ω-scan technique. The structures were solved by direct methods with the aid of successive difference Fourier maps using SHELXS-2014 and refined anisotropically by full-matrix least-squares on F2 using SHELXL-2014 [45]. All nonhydrogen atoms were refined anisotropically. The organic hydrogen atoms were generated geometrically and allowed to refine using a riding model. Hydrogen atoms attached to carbon were placed in calculated positions and refined using a riding model with isotropic displacement parameters 1.2 or 1.5 times the isotropic equivalent of their carrier atoms. Crystallographic data and experimental details for structural analyses of 1, 2, and 3 are summarized in Table 3. Crystallographic data for the three complexes have been deposited with the Cambridge Crystallographic Data Centre as supplementary publication CCDC reference numbers 1841712, 1829802, and 1829801, respectively. Any inquiries related to the data can be e-mailed to deposit@ccdc.cam.ac.uk.
Table 3.
Crystallographic and structure refinement data for complexes 1, 2, and 3.
| Complex | 1 | 2 | 3 |
|---|---|---|---|
| Empirical formula | C31H26N4NiO4 | C34H36N4NiO7 | C35H28N4NiO4 |
| Formula weight | 577.27 | 671.38 | 627.32 |
| Temperature (K) | 298 (2) | 298 (2) | 298 (2) |
| Wavelength (Å) | 0.71073 | 0.71073 | 0.71073 |
| Crystal system | Monoclinic | Monoclinic | Monoclinic |
| Space group | C 2 | P 21/c | P 21 |
| a (Å) | 16.9956 (14) | 12.9281 (12) | 12.5532 (11) |
| b (Å) | 16.7323 (13) | 11.9960 (11) | 19.1631 (16) |
| c (Å) | 12.4490 (9) | 22.131 (2) | 14.850 (4) |
| α = γ (°) | 90 | 90 | 90 |
| β (°) | 130.648 (3) | 104.568 (2) | 111.483 (3) |
| V (Å3) | 2686.0 (4) | 3321.8 (5) | 3324.2 (10) |
| Z | 4 | 4 | 4 |
| D calc (Mg·m−3) | 1.427 | 1.342 | 1.257 |
| F (000) | 1200 | 1408 | 1310 |
| Absorption coefficient (mm−1) | 0.767 | 0.637 | 0.626 |
| Crystal size (mm) | 0.22 × 0.21 × 0.15 | 0.36 × 0.20 × 0.11 | 0.43 × 0.36 × 0.25 |
| θ Range (°) | 2.434 to 25.016 | 2.549 to 25.020 | 2.587 to 25.020 |
| Limiting indices | –20≤ h ≤ 15; –19≤ k ≤ 19; | –10≤ h ≤ 15; –12≤ k ≤ 14; | –14≤ h ≤ 11; –22≤ k ≤ 21; |
| –14l ≤ 14 | –26l ≤ 16 | –17l ≤ 17 | |
| Reflections collected | 6750 | 15812 | 16814 |
| Unique reflections | 4497 | 5824 | 10297 |
| R int | 0.0243 | 0.0988 | 0.0467 |
| Data, restraints, parameters | 4497, 1, 363 | 5824, 0, 421 | 10297, 1649, 795 |
| Goodness–of–fit on F2 | 0.961 | 1.089 | 0.964 |
| Absolute structure parameter | −0.009 (11) | 0.000 (15) | |
| Final R indices [I > 2σ (I)] | R 1 = 0.0381, wR2 = 0.0787 | R 1 = 0.0949, wR2 = 0.2006 | R 1 = 0.0502, wR2 = 0.1044 |
| R Indices (all data) | R 1 = 0.0560, wR2 = 0.0868 | R 1 = 0.1568, wR2 = 0.2242 | R 1 = 0.1001, wR2 = 0.1233 |
| Largest diff. Peak and hole (e·Å−3) | 0.437 and -0.196 | 0.904, and -0.853 | 0.295, and -0.281 |
4.4. Cell Culture
4.4.1. Cytotoxicity In Vitro Assay
3-(4,5-Dimethylthiazol-2-yl)-2, 5-diphenyltetrazolium bromide (MTT) method was used to assay the cytotoxicity in vitro. Complexes 1–3, ligands (L1, L2, and L3), Ni (CH3COO)2, and cisplatin were dissolved in DMSO at the concentration of 20 mM as a stock solution for subsequent testing. Four different cancer cell lines (MCF-7, SGC-7901, Eca-109, and HepG2) and one normal cell line (HSF) were seeded in 96-well and cultured at 37oC in 5% CO2. After 24 h, the medium was replaced by different concentrations of complex and incubated for 48 h. 10 μL MTT dye (5 mg/mL) was added to each well and incubated for another 4 h. After that, the medium was removed and DMSO (100 μL) was added to solubilize the MTT formazan. A microplate reader (Bio-Rad iMark™) was used to measure the OD value of each well at a wavelength of 490 nm. Each experiment was repeated at least three times, and GraphPad Prism 5.0 was used to analyze the IC50 values.
4.4.2. Apoptosis Assay by Hoechst 33342 Staining
With the density of 2 × 10⁵ cells per well, Eca-109 cells were cultured in a 6-well plate for 24 h. After that, the medium was replaced by different concentrations of complex 2 and incubated for another 24 h. Then, cells were washed twice with ice-cold PBS, stained with 10 μg/mL Hoechst 33342 for 15 minutes, and photographed by fluorescence microscopy (Nikon Eclipse Ti–E, Nikon Instruments Inc., Japan).
4.4.3. Acridine Orange/Ethidium Bromide (AO/EB) Double Staining
AO/EB double staining was used to observe the changes in apoptotic cells. Eca-109 cells were cultured in a 6-well plate for 24 h. Then, cells were treated with different concentrations of complex 2 for another 24 h. After that, cells were washed twice with ice-cold PBS, stained with 100 μg/mL AO/EB for 10 minutes, and photographed by fluorescence microscopy (Nikon Eclipse Ti–E, Nikon Instruments Inc., Japan).
4.4.4. Reactive Oxygen Species (ROS) Levels Studies
Eca-109 cells were seeded into a 6-well plate at a density of 2 × 10⁵ cells per well and incubated for 24 h. Then, the medium was replaced and incubated with different concentrations of complex 2 for another 24 h. After that, cells were washed twice with ice-cold PBS, stained with 10 μM DCFH-DA for 30 minutes, and photographed by fluorescence microscopy (Nikon Eclipse Ti–E, Nikon Instruments Inc., Japan).
N-acetyl-L-cysteine (NAC), as a ROS scavenger, was added in a medium for 1 h before the addition of complex 2 to examine the effect of ROS on cell viability. The percentage of apoptotic cells was detected by Annexin V-PE/7-AAD staining assay after complex 2 treatment with or without NAC.
4.4.5. Apoptosis by Flow Cytometry
Different stages of apoptosis induced by complex 2 were determined by Annexin V-PE and 7-AAD staining according to the manufacture's protocol for the Annexin V Apoptosis Detection Kit (BD, Bioscience). Eca-109 cells were seeded in a 6-well plate with a density of 2 × 10⁵ cells per well and cultured at 37°C in 5% CO2 for 24 h. Then, different concentrations of complex 2 were added into the above well and incubated for another 24 h. The cells were resuspended in binding buffer, stained with 5 μL Annexin V-PE and 5 μL 7-AAD at room temperature for 15 min, and analyzed using the flow cytometer (BD FACS Aria III).
4.4.6. Autophagy Assay
Eca-109 cells were seeded in 6-well plates and incubated at 37oC in 5% CO2 for 24 h. Then, the medium was replaced with different concentrations of complex 2 for another 24 h. After that, the medium was removed and the cells were washed twice with ice-cold PBS. Then, the cells were stained with MDC (monodansylcadaverine) solution (50 μM) for 15 min, and the data were obtained by flow cytometry (BD FACS Aria III).
3-MA, as an autophagic inhibitor, was added in a medium for 1 h before the addition of complex 2 to examine the effect of autophagy on cell viability. The percentage of apoptotic cells was detected by Annexin V-PE/7-AAD staining assay after complex 2 treatment with or without 3-MA.
4.4.7. Mitochondrial Membrane Potential Measurement
After being treated with different concentrations of complex 2, the cells were collected and incubated in 500 μL PBS containing 10 μg/mL JC-1 for 20 min at 37°C in the dark. Then, the cells were resuspended in PBS and analyzed by flow cytometry (BD FACS Aria III).
4.4.8. Cell Cycle Arrest Assay
After treatment with different concentrations of complex 2, the cells were collected and fixed with 70% ethanol for the night. Then, the cells were incubated in 500 μL PBS containing Triton X-100 (0.1% v/v), RNase A (0.2 mg/mL), and propidium iodide (PI, 0.02 mg/mL) for 15 min. Then, the cells were analyzed by flow cytometry (BD FACS Aria III).
4.4.9. Western Blot Assay
After incubation with different concentrations of complex 2, cells were harvested in a radioimmunoprecipitation assay (RIPA) buffer with protease inhibitors and phosphatase inhibitors. BCA Protein Assay Kit was used to determine the protein concentration. Then, the expression levels of proteins associated with Bcl-2 family and autophagy were measured by Western blot assay.
4.5. Statistical Analysis
All experiments were repeated three times. Statistical significance was evaluated by Student's t-test, and ∗ means P < 0.05, ∗∗ means P < 0.01, and ∗∗∗ means P < 0.001.
Acknowledgments
This project was funded by the Shandong Provincial Natural Science Foundation (ZR2016HB73 and ZR2019PH084) and the Medical and Health Science and Technology Development Projects of Shandong Province (2016WS0210).
Contributor Information
Lei Gao, Email: gaolei_0635@126.com.
Lianzhi Li, Email: lilianzhi1963@163.com.
Data Availability
The data used to support the findings of this study are included within the article and the supplementary information file.
Conflicts of Interest
The authors declare that there are no conflicts of interest that could influence the work reported in this paper.
Authors' Contributions
Yang Li and Jianfang Dong contributed equally to this work.
Supplementary Materials
Figure S1: FTIR spectra of the title complexes 1, 2, and 3. Figure S2: CheckCIF/PLATON reports for the crystal structure determinations of the Complexes 1, 2, and 3.
References
- 1.Wang C.-H., Shih W.-C., Chang H. C., et al. Preparation and characterization of amino-linked heterocyclic carbene palladium, gold, and silver complexes and their use as anticancer agents that act by triggering apoptotic cell death. Journal of Medicinal Chemistry. 2011;54(14):5245–5249. doi: 10.1021/jm101096x. [DOI] [PubMed] [Google Scholar]
- 2.Zhao J., Hua W., Xu G., Gou S. Biotinylated platinum (IV) complexes designed to target cancer cells. Journal of Inorganic Biochemistry. 2017;176:175–180. doi: 10.1016/j.jinorgbio.2017.08.017. [DOI] [PubMed] [Google Scholar]
- 3.Altmann S., Choroba K., Skonieczna M., et al. Journal Inorganic Biochemical. 2019;201 doi: 10.1016/j.jinorgbio.2019.110809. [DOI] [PubMed] [Google Scholar]
- 4.Wheate N. J., Walker S., Craig G. E., Oun R. The status of platinum anticancer drugs in the clinic and in clinical trials. Dalton Transactions. 2010;39(35):8113–8127. doi: 10.1039/c0dt00292e. [DOI] [PubMed] [Google Scholar]
- 5.Zhang Y., Zhang Z., Gou Y., et al. Design an anticancer copper (II) pro-drug based on the flexible IIA subdomain of human serum albumin. Journal of Inorganic Biochemistry. 2017;172:1–8. doi: 10.1016/j.jinorgbio.2017.04.002. [DOI] [PubMed] [Google Scholar]
- 6.Kelland L. The resurgence of platinum-based cancer chemotherapy. Nature Reviews Cancer. 2007;7(8):573–584. doi: 10.1038/nrc2167. [DOI] [PubMed] [Google Scholar]
- 7.Konarikova K., Andrezalova L., Rapta P., et al. Effect of the Schiff base complex diaqua-(N-salicylidene-l-glutamato)copper (II) monohydrate on human tumor cells. European Journal of Pharmacology. 2013;721(1-3):178–184. doi: 10.1016/j.ejphar.2013.09.038. [DOI] [PubMed] [Google Scholar]
- 8.Enriquez Garcia A., Lai B., Gopinathan S. G., Harris H. H., Shemanko C. S., Jalilehvand F. Nuclear localization of dirhodium (ii) complexes in breast cancer cells by X-ray fluorescence microscopy. Chemical Communications. 2019;55(57):8223–8226. doi: 10.1039/c9cc00521h. [DOI] [PubMed] [Google Scholar]
- 9.Bergamo A., Sava G. Linking the future of anticancer metal-complexes to the therapy of tumour metastases. Chemical Society Reviews. 2015;44(24):8818–8835. doi: 10.1039/c5cs00134j. [DOI] [PubMed] [Google Scholar]
- 10.Adsule S., Barve V., Chen D., et al. Novel Schiff base copper complexes of quinoline-2 carboxaldehyde as proteasome inhibitors in human prostate cancer cells. Journal of Medicinal Chemistry. 2006;49(24):7242–7246. doi: 10.1021/jm060712l. [DOI] [PubMed] [Google Scholar]
- 11.Yang Z.-Y., Yang R.-D., Li F.-S., Yu K.-B. Crystal structure and antitumor activity of some rare earth metal complexes with Schiff base. Polyhedron. 2000;19(26-27):2599–2604. doi: 10.1016/s0277-5387(00)00562-3. [DOI] [Google Scholar]
- 12.Kuppusamy Senthil K., Yosef B., Tesfay G., et al. Dalton Transactions. 2019;48 [Google Scholar]
- 13.Bheemarasetti M., Palakuri K., Raj S., Saudagar P., Kotha L. R. Journal of the Iranian Chemical Society. 2018;15:1–13. doi: 10.1007/s13738-018-1338-7. [DOI] [Google Scholar]
- 14.Chow M. J., Licona C., Yuan Qiang Wong D., Pastorin G., Gaiddon C., Ang W. H. Discovery and investigation of anticancer ruthenium-arene schiff-base complexes via water-promoted combinatorial three-component assembly. Journal of Medicinal Chemistry. 2014;57(14):6043–6059. doi: 10.1021/jm500455p. [DOI] [PubMed] [Google Scholar]
- 15.Zhao F., Wang W., Lu W., et al. High anticancer potency on tumor cells of dehydroabietylamine Schiff-base derivatives and a copper (II) complex. European Journal of Medicinal Chemistry. 2018;146:451–459. doi: 10.1016/j.ejmech.2018.01.041. [DOI] [PubMed] [Google Scholar]
- 16.Zhong X., Yi J., Sun J., Wei H.-L., Liu W.-S., Yu K.-B. Synthesis and crystal structure of some transition metal complexes with a novel bis-Schiff base ligand and their antitumor activities. European Journal of Medicinal Chemistry. 2006;41(9):1090–1092. doi: 10.1016/j.ejmech.2006.05.009. [DOI] [PubMed] [Google Scholar]
- 17.Amer S., El-Wakiel N., El-Ghamry H. Synthesis, spectral, antitumor and antimicrobial studies on Cu (II) complexes of purine and triazole Schiff base derivatives. Journal of Molecular Structure. 2013;1049:326–335. doi: 10.1016/j.molstruc.2013.06.059. [DOI] [Google Scholar]
- 18.Walsh C. T., Orme-Johnson W. H. Nickel enzymes. Biochemistry. 1987;26(16):4901–4906. doi: 10.1021/bi00390a001. [DOI] [PubMed] [Google Scholar]
- 19.Schickler H., Caspi H. Response of antioxidative enzymes to nickel and cadmium stress in hyperaccumulator plants of the genus Alyssum. Physiologia Plantarum. 1999;105(1):39–44. doi: 10.1034/j.1399-3054.1999.105107.x. [DOI] [Google Scholar]
- 20.Ramasubramanian R., Anandababu K., Kumar M., Ramasamy M. Dalton Transactions. 2018;47 doi: 10.1039/c7dt04739h. [DOI] [PubMed] [Google Scholar]
- 21.Saylor Z., Maier R. Helicobacter pylori nickel storage proteins: recognition and modulation of diverse metabolic targets. Microbiology. 2018;164(8):1059–1068. doi: 10.1099/mic.0.000680. [DOI] [PubMed] [Google Scholar]
- 22.Lal N. Asian Journal of Cell Biology. 2017;2:1–15. [Google Scholar]
- 23.Agata B., Lemanowicz J., Anetta S.-Z. International Journal of Environmental Research. 2016;10:245–254. [Google Scholar]
- 24.Domhöver B., Kläui W., Kremer-Aach A., Bell R., Mootz D. Catalytic copolymerization of ethene and carbon monoxide on nickel complexes. Angewandte Chemie International Edition. 1998;37(21):3050–3052. doi: 10.1002/(sici)1521-3773(19981116)37:21<3050::aid-anie3050>3.0.co;2-m. [DOI] [PubMed] [Google Scholar]
- 25.Xiaojun S., McCardle K. M., Julien A. P., Jurss J. W. Chem. Commun. 2018;54:3351–3354. doi: 10.1039/c8cc00266e. [DOI] [PubMed] [Google Scholar]
- 26.Camerman A., Hempel A., Mastropaolo D., Camerman N., Iucr AcCrC. 2005;61:417–419. doi: 10.1107/s0108270105014745. [DOI] [Google Scholar]
- 27.Pang H., Lu Q., Li Y., Gao F. Facile synthesis of nickel oxide nanotubes and their antibacterial, electrochemical and magnetic properties. Chemical Communications. 2009;28(48):7542–7544. doi: 10.1039/b914898a. [DOI] [PubMed] [Google Scholar]
- 28.Campo R. D., Criado J. J., García E., Hermosa M. R., Sanz F. J. Inorg. Biochem. 2002;89:74–82. doi: 10.1016/s0162-0134(01)00408-1. [DOI] [PubMed] [Google Scholar]
- 29.Adams M. D., Nickel G. C., Bajaksouzian S., et al. Resistance to colistin in acinetobacter baumannii associated with mutations in the PmrAB two-component system. Antimicrobial Agents and Chemotherapy. 2009;53(9):3628–3634. doi: 10.1128/aac.00284-09. [DOI] [PMC free article] [PubMed] [Google Scholar]
- 30.Gupta A. D., Patil A. M., Ambekar J. G., Das S. N., Dhundasi S. A., Das K. K. J Basic Clin Physiol Pharmacol. 2011;17:87–100. doi: 10.1515/jbcpp.2006.17.2.87. [DOI] [PubMed] [Google Scholar]
- 31.Zhao P., Zhai S., Dong J., et al. Bioinorganic Chemistry & Applications. 2018;2018:1–16. doi: 10.1155/2018/8478152. [DOI] [PMC free article] [PubMed] [Google Scholar]
- 32.Jayabharathi J., Thanikachalam V., Vennila M., Jayamoorthy K. Potential fluorescent chemosensor based on L-tryptophan derivative: DFT based ESIPT process. Spectrochimica Acta Part A: Molecular and Biomolecular Spectroscopy. 2012;95:446–451. doi: 10.1016/j.saa.2012.04.017. [DOI] [PubMed] [Google Scholar]
- 33.Subha L., Balakrishnan C., Natarajan S., Theetharappan M., Neelakantan M. A. Spectrochim. Acta Part. 2015;153:249–256. doi: 10.1016/j.saa.2015.08.033. [DOI] [PubMed] [Google Scholar]
- 34.Li L., Dang Y.-Q., Li H.-W., Wang B., Wu Y. Fluorescent chemosensor based on Schiff base for selective detection of zinc (II) in aqueous solution. Tetrahedron Letters. 2010;51(4):618–621. doi: 10.1016/j.tetlet.2009.11.070. [DOI] [Google Scholar]
- 35.Tang B., Wan D., Lai S.-H., et al. Design, synthesis and evaluation of anticancer activity of ruthenium (II) polypyridyl complexes. Journal of Inorganic Biochemistry. 2017;173:93–104. doi: 10.1016/j.jinorgbio.2017.04.028. [DOI] [PubMed] [Google Scholar]
- 36.Zhang C., Han B.-J., Zeng C.-C., et al. Synthesis, characterization, in vitro cytotoxicity and anticancer effects of ruthenium (II) complexes on BEL-7402 cells. Journal of Inorganic Biochemistry. 2016;157:62–72. doi: 10.1016/j.jinorgbio.2016.01.003. [DOI] [PubMed] [Google Scholar]
- 37.Wan D., Tang B., Wang Y.-J., et al. Synthesis and anticancer properties of ruthenium (II) complexes as potent apoptosis inducers through mitochondrial disruption. European Journal of Medicinal Chemistry. 2017;139:180–190. doi: 10.1016/j.ejmech.2017.07.066. [DOI] [PubMed] [Google Scholar]
- 38.Zhang Y., Ho A., Yue J., et al. Structural basis and anticancer properties of ruthenium-based drug complexed with human serum albumin. European Journal of Medicinal Chemistry. 2014;86:449–455. doi: 10.1016/j.ejmech.2014.08.071. [DOI] [PubMed] [Google Scholar]
- 39.Eskelinen E.-L., Saftig P. Autophagy: a lysosomal degradation pathway with a central role in health and disease. Biochimica et Biophysica Acta (BBA) - Molecular Cell Research. 2009;1793(4):664–673. doi: 10.1016/j.bbamcr.2008.07.014. [DOI] [PubMed] [Google Scholar]
- 40.Kang C., Avery L. To be or not to be, the level of autophagy is the question: dual roles of autophagy in the survival response to starvation. Autophagy. 2008;4(1):82–84. doi: 10.4161/auto.5154. [DOI] [PMC free article] [PubMed] [Google Scholar]
- 41.Zhao C., Gao W., Chen T. Synergistic induction of apoptosis in A549 cells by dihydroartemisinin and gemcitabine. Apoptosis. 2014;19(4):668–681. doi: 10.1007/s10495-013-0953-0. [DOI] [PubMed] [Google Scholar]
- 42.Chen T., Liu Y., Zheng W.-J., Liu J., Wong Y.-S. Ruthenium polypyridyl complexes that induce mitochondria-mediated apoptosis in cancer cells. Inorganic Chemistry. 2010;49(14):6366–6368. doi: 10.1021/ic100277w. [DOI] [PubMed] [Google Scholar]
- 43.Chen T., Wong Y. S. Selenocystine induces apoptosis of A375 human melanoma cells by activating ROS-mediated mitochondrial pathway and p53 phosphorylation. Cellular and Molecular Life Sciences. 2008;65(17):2763–2775. doi: 10.1007/s00018-008-8329-2. [DOI] [PMC free article] [PubMed] [Google Scholar]
- 44.Cory S., Adams J. M. The Bcl2 family: regulators of the cellular life-or-death switch. Nature Reviews Cancer. 2002;2(9):647–656. doi: 10.1038/nrc883. [DOI] [PubMed] [Google Scholar]
- 45.Sheldrick G. M. Göttingen, Germany: University of Göttingen; 2014. [Google Scholar]
Associated Data
This section collects any data citations, data availability statements, or supplementary materials included in this article.
Supplementary Materials
Figure S1: FTIR spectra of the title complexes 1, 2, and 3. Figure S2: CheckCIF/PLATON reports for the crystal structure determinations of the Complexes 1, 2, and 3.
Data Availability Statement
The data used to support the findings of this study are included within the article and the supplementary information file.


