Abstract
Microglia undergo dynamic structural and transcriptional changes during the immune response to traumatic brain injury (TBI). For example, TBI causes microglia to form rod-shaped trains in the cerebral cortex, but their contribution to inflammation and pathophysiology is unclear. The purpose of this study was to determine the origin and alignment of rod microglia and to determine the role of microglia in propagating persistent cortical inflammation. Here, diffuse TBI in mice was modeled by midline fluid percussion injury (FPI). Bone marrow chimerism and BrdU pulse-chase experiments revealed that rod microglia derived from resident microglia with limited proliferation. Novel data also show that TBI-induced rod microglia were proximal to axotomized neurons, spatially overlapped with dense astrogliosis, and aligned with apical pyramidal dendrites. Furthermore, rod microglia formed adjacent to hypertrophied microglia, which clustered among layer V pyramidal neurons. To better understand the contribution of microglia to cortical inflammation and injury, microglia were eliminated prior to TBI by CSF1R antagonism (PLX5622). Microglial elimination did not affect cortical neuron axotomy induced by TBI, but attenuated rod microglial formation and astrogliosis. Analysis of 262 immune genes revealed that TBI caused profound cortical inflammation acutely (8 hr) that progressed in nature and complexity by 7 dpi. For instance, gene expression related to complement, phagocytosis, toll-like receptor signaling, and interferon response were increased 7 dpi. Critically, these acute and chronic inflammatory responses were prevented by microglial elimination. Taken together, TBI-induced neuronal injury causes microglia to structurally associate with neurons, augment astrogliosis, and propagate diverse and persistent inflammatory/immune signaling pathways.
Keywords: astrocytes, CSF1R antagonist, fluid percussion injury, microglia, neuroinflammation, traumatic brain injury
1 |. INTRODUCTION
Traumatic brain injury (TBI), whereby mechanical forces to the head disrupt brain physiology and structure, is a leading cause of hospital utilization and disability in the United States (Faul, Xu, Wald, & Coronado, 2010; Selassie et al., 2008). Furthermore, TBI is associated with increased risk for psychiatric comorbidities (Alway, Gould, Johnston, McKenzie, & Ponsford, 2016; Whelan-Goodinson, Ponsford, Johnston, & Grant, 2009) and neuropathology (Crane et al., 2016; Hong et al., 2014) that present and persist beyond the acute post-injury window. Positron emission tomography (PET) and post mortem studies show that glial reactivity persists over a decade after injury (Cherry et al., 2016; Coughlin et al., 2016; Ramlackhansingh et al., 2011). Thus, clinical innovation will require understanding how processes initiated at impact (primary injury) progress into long-term neurodegeneration and inflammation (secondary injury).
Midline fluid percussion injury (FPI) in rodents recapitulates acute sensorimotor impairment, chronic cognitive and behavioral morbidities, and pathological hallmarks consistent with single, diffuse TBI in humans (Lifshitz et al., 2016). Notably, diffuse TBI is distinct from both repetitive injury and focal injury in etiology, symptomatology, and pathology. Midline FPI models percussive movement of the brain within the skull; axons and white matter tracts are vulnerable to shearing forces and undergo widespread injury. Cortical pyramidal neurons are particularly vulnerable to irreversible axotomy following midline FPI in rodents and show persistent transcriptional and neuro-physiological changes (Greer, McGinn, & Povlishock, 2011; Greer, Povlishock, & Jacobs, 2012). Understanding the microglial response and relationship to neuronal injury is vital to both preventing maladaptive inflammation and promoting neuronal regeneration.
Microglial homeostasis is disrupted acutely following TBI and remains dysregulated long after injury. At baseline, microglia have small cell bodies with elongated processes that dynamically survey the microenvironment (Nimmerjahn, Kirchhoff, & Helmchen, 2005). Following injury, inflammatory signaling is tightly regulated. For instance, expression of proinflammatory cytokines IL-1β and TNFα increases 4 hr post-injury, but returns to baseline by 72 hr post-injury (Fenn et al., 2014). Furthermore, microglial structure changes dynamically in the cortex acutely after TBI (1 dpi) and persists into subacute (3–7 dpi) and chronic (30 dpi) stages of injury (Morrison, Young, Qureshi, Rowe, & Lifshitz, 2017). Microglial structural alterations 30 dpi are associated with increased inflammatory gene expression, cognitive and behavioral deficits, and increased MHC-II expression, consistent with “microglial priming” (Fenn et al., 2014; Muccigrosso et al., 2016). Functional consequences of microglial priming 30 dpi include exacerbated cytokine expression, prolonged sickness behavior, and cognitive impairment following innate immune challenge (Fenn et al., 2014). Thus, it is critical to understand how microglial profiles progress from the acute to chronic phase of brain injury.
Rod-shaped microglia form as early as 1 dpi, peak in the subacute window, and align linearly in the cortex 7 dpi (Taylor, Morganti-Kossmann, Lifshitz, & Ziebell, 2014). This structure is observed in other pathological contexts, including aging and chronic viral infection (Bachstetter et al., 2017; Ji, Schachtschneider, Schook, Walker, & Johnson, 2016; Sierra et al., 2016; Yuan, Liang, Peng, Lin, & So, 2015). Thus, it may represent a conserved response to neuronal degeneration/damage. Notably, after midline fluid percussion injury, rod microglia are observed in cortical regions where neuronal injury is previously described, evident by the presence of axotomized neurons, neuronal soma atrophy, and increased silver staining (Greer et al., 2011; J. Lifshitz & Lisembee, 2012). Furthermore, rod microglia align with neurites after diffuse TBI in mice (Ziebell, Taylor, Cao, Harrison, & Lifshitz, 2012) and associate with injured neurons/axons following porcine TBI (Lafrenaye, Todani, Walker, & Povlishock, 2015; Wofford et al., 2017). It is unclear if microglia–neuron associations are beneficial following diffuse TBI. Notably, Rice et al. (2015) showed that microglia have both neuroprotective and maladaptive roles following hippocampal lesion. Microglial elimination by colony stimulating factor receptor (CSF1R)-mediated antagonism prevented increases in inflammatory gene expression and behavioral deficits, but exacerbated neuron loss. Rod microglia were observed in lesioned hippocampi, suggesting that they respond to neuronal injury (Rice et al., 2015). Therefore, the objectives of this study were to determine the cellular origin of rod microglia, to ascertain the substrate along which they form, and to determine the cellular and inflammatory microenvironment in which rod microglia develop by eliminating microglia using a CSF1R antagonist.
2 |. MATERIALS AND METHODS
2.1 |. Mice
Male C57BL/6 mice (Mus musculus; 6–8 weeks old) were purchased from Charles River Breeding Laboratories (Wilmington, MA). Mice were housed in groups of 2–4 for the duration of the study and maintained at 25°C under a 12 hr light/12 hr dark cycle with ad libitum access to water and rodent chow. All procedures were performed in accordance with the National Institute of Health Guidelines for the Care and Use of Laboratory Animals and the Public Health Service’s Policy on Humane Care and Use of Laboratory Animals and Guide for the Care use of Laboratory Animals and were approved by The Ohio State University Institutional Laboratory Animal Care and Use Committee.
2.2 |. Midline fluid percussion injury
Mice received a diffuse midline TBI using a fluid percussion injury (FPI) apparatus (Custom Design & Fabrication, Richmond, VA) as previously described (Fenn et al., 2014; Fenn et al., 2015; Rowe, Griffiths, & Lifshitz, 2016). This diffuse injury occurs in the absence of a contusion, does not induce tissue cavitation, and causes diffuse axonal injury in the neocortex, hippocampus, and dorsolateral thalamus (Bachstetter et al., 2013; Fenn et al., 2014; Kelley, Farkas, Lifshitz, & Povlishock, 2006; Kelley, Lifshitz, & Povlishock, 2007). In brief, a midline craniectomy was performed with a 3 mm outer diameter trephine and a rigid Luer-lock needle hub was secured over the craniectomy. After recovery, injury was induced by filling the injury hub with saline and imposing a 10 ms pulse of saline (1.2 atm; 670–720 mV) onto the dura through the hub (Fenn et al., 2014; Lifshitz, Witgen, & Grady, 2007b; Rowe et al., 2016; Witgen, Lifshitz, & Grady, 2006). Immediately after injury, the hub was removed, dural integrity was confirmed, and mice were evaluated for injury severity using the self-righting test (Lifshitz, Kelley, & Povlishock, 2007a). Mice were euthanized immediately if dural integrity was compromised. Self-righting inclusion criteria were based on our previous work with BALB/c mice (Fenn et al., 2014). Only mice with a moderate TBI were used (200–540 s); two mice were excluded for righting reflexes longer than 540 s. Control mice were naïve and uninjured unless otherwise specified. Select studies used sham-injured controls, which were subjected to midline craniectomy and hub placement, but did not receive the fluid pulse.
2.3 |. Immunofluorescence
Mice were transcardially perfused with phosphate-buffered saline (PBS) followed by 4% paraformaldehyde (PFA). Brains were removed and post-fixed in 4% PFA for 24 hr and dehydrated in 30% sucrose for 48 hr. Fixed tissue was snap-frozen in isopentane (−78°C) and cryosectioned at 30 μm thickness. Sections were stored in cryoprotectant at −20°C, and washed with PBS prior to use. Brain regions were identified using the Allen Mouse Brain Atlas. Prior to labeling, sections were washed in PBS and blocked with 0.1% TritonX and 5% normal donkey serum (NDS) in PBS for 2 hr. Sections were incubated with primary antibodies diluted in blocking solution overnight at 4°C (rabbit anti-Iba1, 1:1000, Wako Cat# 019–19,471, RRID: AB_2665520; goat anti-Iba1, 1:500, Abcam Cat# ab5076, RRID: AB_2224402; rabbit anti-ATF3, 1:100, Santa Cruz Biotechnology Cat# sc-22,798, RRID:AB_2058590; goat anti-GFAP, 1:500, Abcam Cat# ab53554, RRID:AB_880202; rat anti-BrdU, 1:1000, Bio-Rad / AbD Serotec Cat# OBT0030G, RRID:AB_609567; rat anti-CD45, 1:500, Bio-Rad / AbD Serotec Cat# MCA1388, RRID:AB_321729; rat anti-Ly6C, 1:1000, Abcam Cat# ab54223, RRID:AB_881384; rabbit anti-P2RY12, 1:1000, AnaSpec, EGT Group Cat# 55043A, RRID: AB_2298886; rabbit anti-NeuN, 1:1000, Abcam, Cat# ab177487, RRID:AB_2532109). Next, sections were washed in PBS and incubated with an appropriate fluorochrome-conjugated secondary antibody (Donkey anti-rat, rabbit, or goat; AlexaFluor 488/594/647; Invitrogen). Sections were mounted on charged slides and cover-slipped with Fluoromount (Beckman Coulter, Inc., Fullerton, CA).
2.4 |. Epifluorescent microscopy and analysis
Slides were visualized using an epi-fluorescent Leica DMB5000B microscope and images were taken of the somatosensory cortex using a Leica DFC300 FX camera and software. Imaging parameters (gain, exposure) were kept constant throughout each experiment. To determine percent-area of labeling, single-channel images were converted to 8-bit TIFF format and constant thresholds were used to quantify positively labeled pixels (ImageJ Software). To quantify NeuN+ nuclei, 8-bit TIFF images were quantified using the “Find Maxima” plug-in in ImageJ. Rod morphology of Iba1+ cells was quantified using the morphological definition provided in Taylor et al. (2014). Values from 4 to 6 images per mouse were averaged, and these values were used to calculate group averages and variance for each injury or treatment group. Investigators were blinded to injury/treatment group prior to all microscopy and throughout image analysis.
2.5 |. GFP+ bone marrow chimeras
Bone marrow (BM) chimeras were established as previously described (Wohleb, Powell, Godbout, & Sheridan, 2013). In brief, C57BL/6 male mice were injected intraperitoneally (ip) with busulfan (30 mg/kg, 50% DMSO in sterile water) once daily for two consecutive days to ablate the bone marrow of recipients. Donor bone marrow was obtained from C57BL/6-Tg(CAG-EGFP)131Osb/LeySopJ mice (Jackson Laboratories, strain # 006567, RRID:IMSR_JAX:006567). Long-bones were extracted and bone marrow was flushed with saline and passed through a 70 μm cell strainer. Bone marrow-derived cells (1 × 10⁶) were injected into recipient mice intravenously 48 hr after the second busulfan dose and allowed to engraft for 28 days. Engraftment was confirmed by determining the percentage of green fluorescent protein (GFP+) cells in blood. Mice with <70% engraftment of GFP+ cells were excluded from the study.
2.6 |. 5′bromodeoxyuridine labeling
To assess cell proliferation throughout 7 days post-injury, mice were administered 5′bromodeoxyuridine (BrdU) in the drinking water and by ip injection (twice per day during light phase). This design was used to label all proliferating cells while minimizing number of injections (water consumption occurs primarily during the dark phase) because BrdU has a short half-life in vivo (Mandyam, Harburg, & Eisch, 2007). BrdU was dissolved in standard, veterinary-provided drinking water (0.8 mg/mL) or dissolved in sterile PBS for injections. Mice were injected with 50 mg/kg BrdU. Tissue was collected and processed as described, with an additional DNA denaturing step (2 N HCl at 37°C for 30 min) prior to blocking.
2.7 |. Plexxikon (PLX) 5622 administration
PLX5622 was provided by Plexxikon Inc. (Berkley, CA) and formulated in AIN-76A rodent chow by Research Diets at a concentration of 1,200 mg/kg. Standard AIN-76A diet was provided as a vehicle control. Mice were provided ad libitum access to PLX5622 or vehicle diet for 14 days to deplete microglia prior to TBI. This dose and time was validated in our lab to deplete ~96% of microglia (McKim et al., 2017).
2.8 |. Cortical dissection and RNA isolation
Mice were euthanized with inhaled CO2 and the brain was immediately removed. A 2-mm-thick coronal section was made using a brain matrix (Ted Pella, Inc., mouse coronal 1 mm matrix) and the cortex was dissected. Tissue was immediately flash frozen in liquid nitrogen and stored at −80°C. Total RNA was extracted from homogenized tissue using TriReagent (Sigma-Aldrich), normalized by concentration, and reverse-transcribed to cDNA (HiCap RT PCR kit, Applied Biosystems). Quantitative real-time (qRT)-PCR was used to quantify gene expression using the Applied Biosystems Taqman Gene Expression assay-on-demand protocol. Target cDNA genes and reference gene (GAPDH) were run on the same PCR plate using a QuantStudio 3 qRT-PCR machine (Thermo Fisher). Data was analyzed using the comparative threshold method (ΔΔCt), with injury time-points expressed as fold-change from control.
2.9 |. NanoString nCounter analysis of mRNA copy number
Prior to analysis, RNA quality was determined by Bioanalyzer and all samples had an RNA integrity number (RIN) >7.5. RNA was multiplexed and run on an nCounter Mouse Inflammation v2 panel plus, allowing for copy-number quantification of hundreds of genes simultaneously. Data analysis was performed using DESeq2 in R (Love, Huber, & Anders, 2014). Normalization to housekeeping genes and positive controls was performed using the controlGenes argument of estimate-SizeFactors. Comparisons are described as “numerator versus denominator”. Benjamini–Hochberg correction was done to correct for multiple comparisons. Adjusted p-values (p-adj) below a false discovery rate of 5% were considered differentially expressed and were used for pathway analysis and designated as significant in figures. Data are expressed as normalized RNA copy-number ± standard error of the mean (SEM). PCA plots were generated in DESeq2 and volcano plots were generated in ggplot2 (Wickham, 2009). Significantly regulated pathways were generated by Ingenuity Pathway Analysis (QIAGEN Inc., https://www.qiagenbioinformatics.com/products/ingenuity-pathway-analysis) (Kramer, Green, Pollard, & Tugendreich, 2014).
2.10 |. Experimental design and statistical analysis
All other statistical analyses were performed using IBM SPSS Statistics. To determine significant main effects and interactions between main factors, data were analyzed using univariate (TBI) or multivariate (TBI x PLX) analysis of variance (ANOVA) using the general linear model procedure. When appropriate, differences between treatment means were evaluated by F-protected t test using Fischer’s Least Significant Difference method. Results from post hoc comparisons are reflected in figures; values were considered statistically different when p < .05. All data are expressed as group mean ± SEM.
3 |. RESULTS
3.1 |. Diffuse TBI resulted in the formation of rod-shaped microglia in the somatosensory cortex 7 days postinjury (dpi)
Microglia take on myriad structural and transcriptional profiles, which may provide key insight into their functional role in health, injury, and neurodegenerative disease (Krasemann et al., 2017). For instance, structural analyses show that microglia persist in elongated, rod-shaped structures in the cortex following diffuse TBI (Taylor et al., 2014; Ziebell et al., 2012). The derivation and pathophysiological role of rod-shaped microglia or “rod microglia,” however, is unclear. Thus, the purpose of this study was to further characterize rod microglia after diffuse TBI to better assess their functional role in neuropathology.
To address these objectives, mice were uninjured (control) or subjected to diffuse TBI (midline fluid percussion injury, midline FPI) and rod microglia number was quantified in the lateral or somatosensory cortex. The frequency of rod microglia was not significantly different between naïve-uninjured and sham-injured controls (data not shown). Therefore, uninjured controls were used in these experiments. Consistent with previous reports, Figure 1a shows that Iba1+ rod microglia were readily apparent in the cortex 7 dpi compared to controls. Rod-shaped microglia were detected in controls, however, this detection was rare. Moreover, rod microglia were elongated cells that aligned linearly and were perpendicular to the cortical surface (Figure 1a,b). In addition, rod microglia were also commonly detected distal to hypertrophied microglia (Figure 1a,b). Indeed, the percent-area of Iba1 labeling was increased at 7 dpi (F1,10 = 6.809; p < .03, Figure 1c). Furthermore, morphological assessment showed that TBI increased the number of rod microglia in the cortex 7 dpi compared to controls (F1,10 = 12.339; p < .01, Figure 1d). Co-labeling with nuclear stain (DAPI) and Iba1 illustrates that elongated trains of rod microglia consisted of several separate cells that aligned linearly (Figure 1e,f ). Thus, diffuse TBI causes the formation of rod microglia in linear arrangements within the cortex 7 dpi.
FIGURE 1.
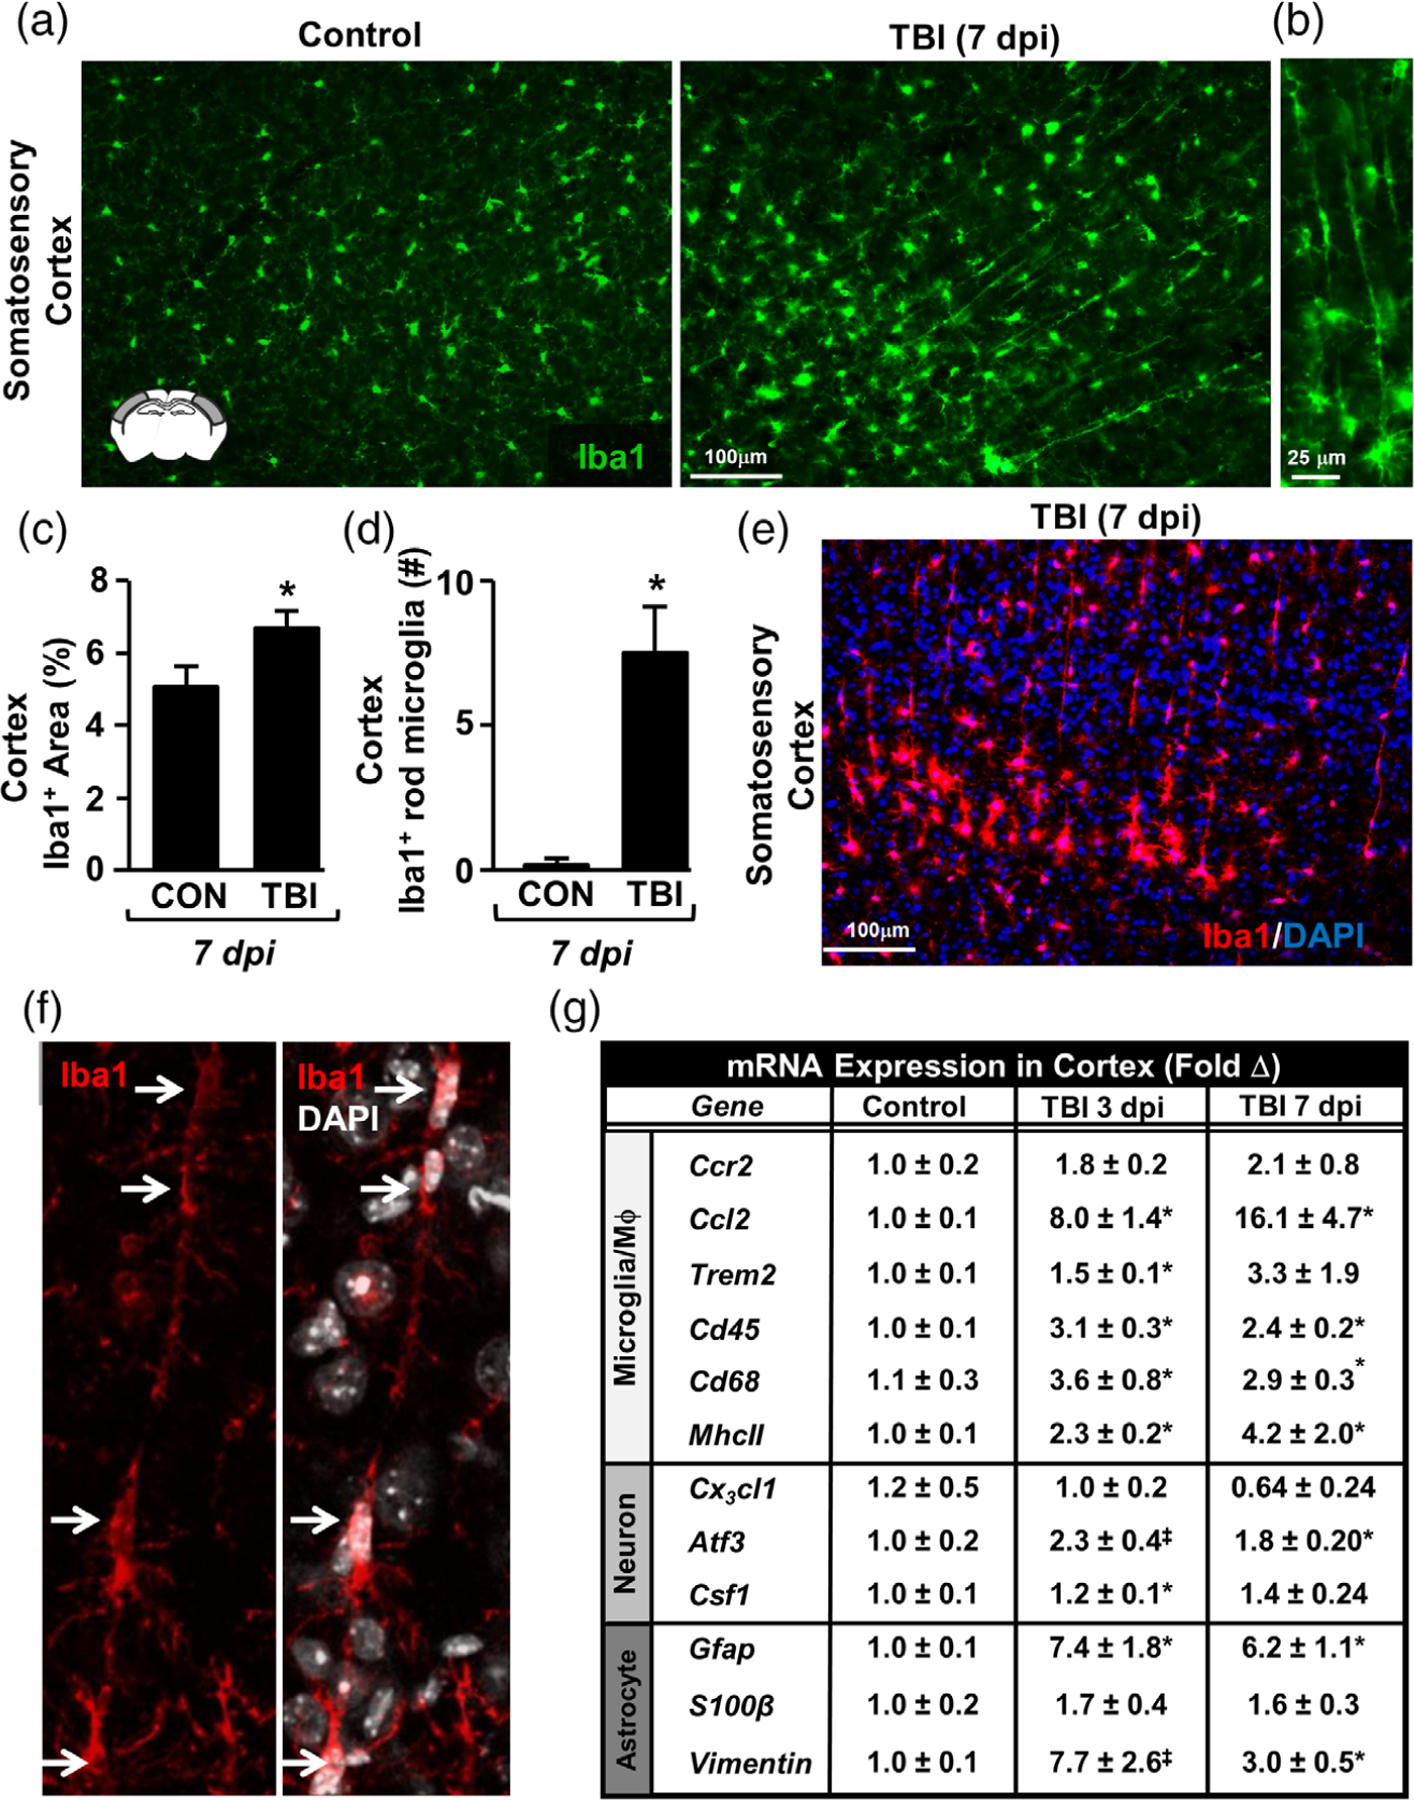
Diffuse TBI caused formation of rod-shaped microglia in the somatosensory cortex 7 dpi. Adult C57BL/6 mice were uninjured (control) or were subjected to midline fluid percussion injury (TBI). At 7 days post-injury (dpi), brains were perfused, fixed, sectioned, and labeled for Iba1. (a) Representative images of Iba1 labeling (20×) in the lateral cortex of control and TBI mice. Inset shows the brain region used for analysis. (b) Representative image (40×) of Iba1+ rod microglia after TBI. (c) Percent-area of Iba1 labeling in the cortex 7 dpi (n = 5). (d) Number of Iba1+ rod microglia per 20× field in the cortex (n = 5). (e) Representative image of merged Iba1 (red) and DAPI (blue) labeling in the somatosensory cortex 7 dpi. (f ) Representative confocal image of Iba1+/DAPI+ rod microglia aligned linearly. Arrows highlight that several separate microglia align to form a “train” of rod microglia. In a separate experiment, mice were uninjured (control) or were subjected to midline fluid percussion injury. (g) At 3 or 7 dpi, RNA was collected from the cortex and mRNA levels of several genes were determined (n = 4). These genes are associated with microglia/macrophages (Ccr2, Ccl2, Trem2, Cd45, Cd68, MhcII), neurons (Cx3cl1, Atf3, Csf1), or astrocytes (Gfap, S100β, Vimentin). Graphs represent mean ± SEM. Means with (*) are significantly different from controls (p < .05) and means with (‡) tend to be different from controls (p = .06–.10)
Next, markers of inflammation and neuronal injury were assessed in the lateral cortex 3 and 7 dpi. The mRNA expression of several genes associated with microglia/macrophage identification and activity (Ccr2, Ccl2, Trem2, Cd45, Cd68, and MhcII), neuronal injury and homeostasis (Cx3cl1, Atf3, Csf1), and astrocytic identification and reactivity (Gfap, S100β, Vim) were determined (Figure 1g). Gene expression analysis of cortical samples at 3 and 7 dpi provides evidence of inflammation and neuronal injury. For instance, TBI increased mRNA expression of CCL2, a microglia-derived chemokine, at both 3 and 7 dpi compared to uninjured controls (p < .05). Expression of microglial/macrophage markers of immune activation and phagocytosis (Cd45, MhcII, Cd68, p < .05 for each) was increased 3 days following TBI and remained elevated 7 days later (p < .05, for each). mRNA levels of neuronal damage-associated transcription factor ATF3 was also increased 7 dpi compared to controls (p < .05). Last, mRNA levels of the astrocyte-associated proteins GFAP and vimentin were increased at 3 and 7 dpi compared to controls (p < .05). Taken together, the cortical environment in which rod microglia formed by 7 dpi had an mRNA profile consistent with microglia/macrophage activation, astrocyte reactivity, and neuronal injury.
3.2 |. Resident microglia formed rod microglia in the lateral cortex following TBI
We next determined if rod microglia were resident microglia or monocyte-derived macrophages. First, protein expression of CD45 was determined 7 dpi. There was a TBI-dependent increase in CD45 expression in the lateral cortex. Notably, CD45 protein was expressed at very low levels in uninjured controls (Figure 2a,b). Following TBI, monocytes (CD45+/Iba1neg) and ramified microglia/macrophages (CD45+/Iba1+) were detected in the lateral cortex (Figure 2a, arrows). In addition, both hypertrophied microglia and rod microglia were CD45+ 7 dpi (Figure 2a). These changes were represented as a tendency for increased CD45+ percent-area labeling after TBI (p = .06, Figure 2b) and an increased percentage area of CD45+/ Iba1+ labeling after TBI (F1,5 = 8.832; p < .05, Figure 2c).
FIGURE 2.
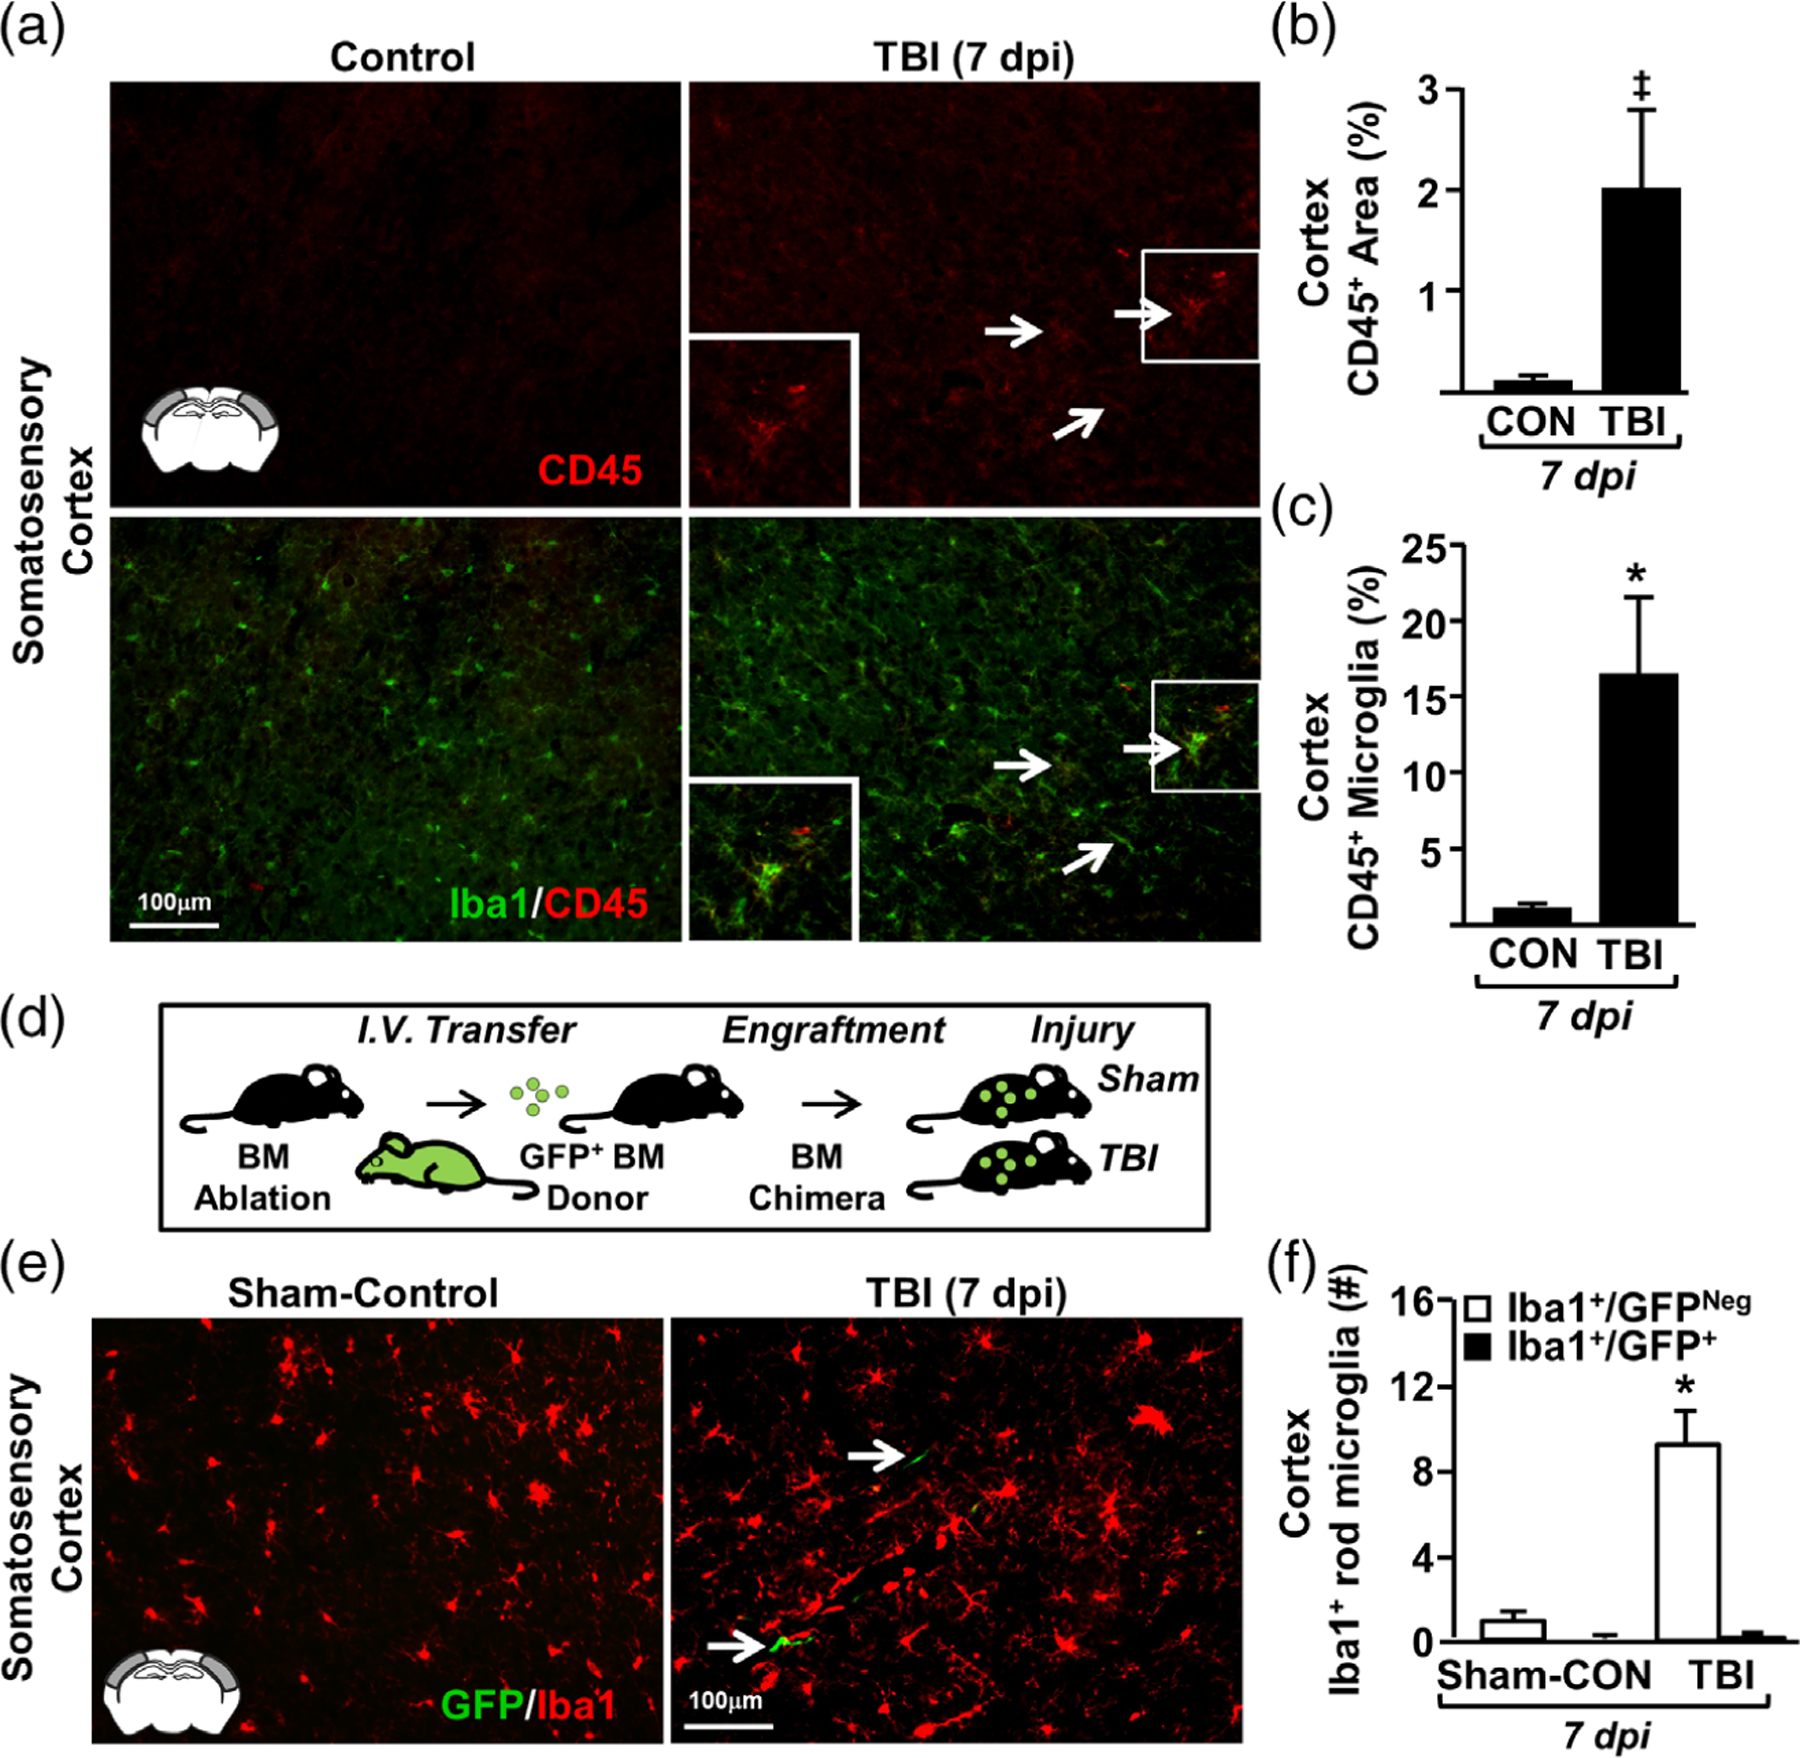
Resident microglia formed rod microglia in the somatosensory cortex following TBI. Adult C57BL/6 mice were uninjured (control) or were subjected to midline fluid percussion injury (TBI). At 7 days postinjury (dpi), brains were perfused, fixed, sectioned, and labeled for Iba1. (a) Representative merged images of Iba1 (green) and CD45 (red) labeling (20×) from the somatosensory of control and TBI mice. Arrows show cells that are both Iba1+ and CD45+. (b) Percent-area of CD45 labeling in the cortex (n = 3). (c) Percent-area of double-positive Iba1 and CD45 labeling (n = 3). (d) In a separate experiment, green fluorescent protein (GFP) bone marrow (BM) chimeras were established by chemical BM ablation and engraftment of GFP+ bone marrow cells. GFP+ BM-chimera mice were sham-injured (controls) or subjected to TBI. At 7 dpi, brains were removed, post-fixed, sectioned, and labeled with Iba1. (e) Representative merged images (20×) of Iba1 labeling and GFP expression in the somatosensory cortex of control and TBI mice. (f ) Number of Iba1+/GFPneg and Iba1+/GFP+ rod microglia in the somatosensory cortex control and TBI mice (n = 6). Bars represent the mean ± SEM. Means with (*) are significantly different from controls (p < .05)
Next, GFP+ bone-marrow chimeras were generated (Figure 2d) as previously described (McKim et al., 2017; Wohleb et al., 2013) to address whether the CD45+/Iba1+ cells present after TBI were monocyte-derived macrophages. Here, GFP+ chimeric mice were subjected to TBI or sham-injury (controls). Figure 2e illustrates that there were infrequent GFP+ cells in the brain 7 dpi. These GFP+ cells, however, did not contribute to rod microglial formation (Figure 2f ). For example, the number of Iba1+ rod microglia was increased 7 dpi (F1,11 = 11.788; p < .01, Figure 2f ), but none of these cells were GFP+. Taken together, some monocytes accumulated in the brain after TBI, but rod microglia were derived from resident microglia that upregulate CD45 after injury.
3.3 |. Formation of rod microglia in the lateral cortex after diffuse brain injury was associated with limited microglial proliferation
Next, we examined the degree to which microglial proliferation was associated with the formation of rod microglia in the lateral cortex 7 dpi. Here, mice were subjected to TBI, administered BrdU for 7 d, and proliferation was assessed in the somatosensory cortex 7 dpi (Figure 3a). The overall amount of BrdU labeling tended to increase in the somatosensory cortex 7 dpi compared to uninjured controls (p = .1, Figure 3b). Iba1 quantification confirms that there were more rod microglia 7 dpi that aligned in a “train” (F1,5 = 46.129; p < .001, Figure 3d). Nonetheless the majority of rod microglia present 7 dpi were BrdUneg (80%). In fact, when BrdU+/Iba1+ rod microglia were present, they were aligned in a train (F1,5 = 15.686; p < .02). Thus, there was limited proliferation of rod microglia.
FIGURE 3.
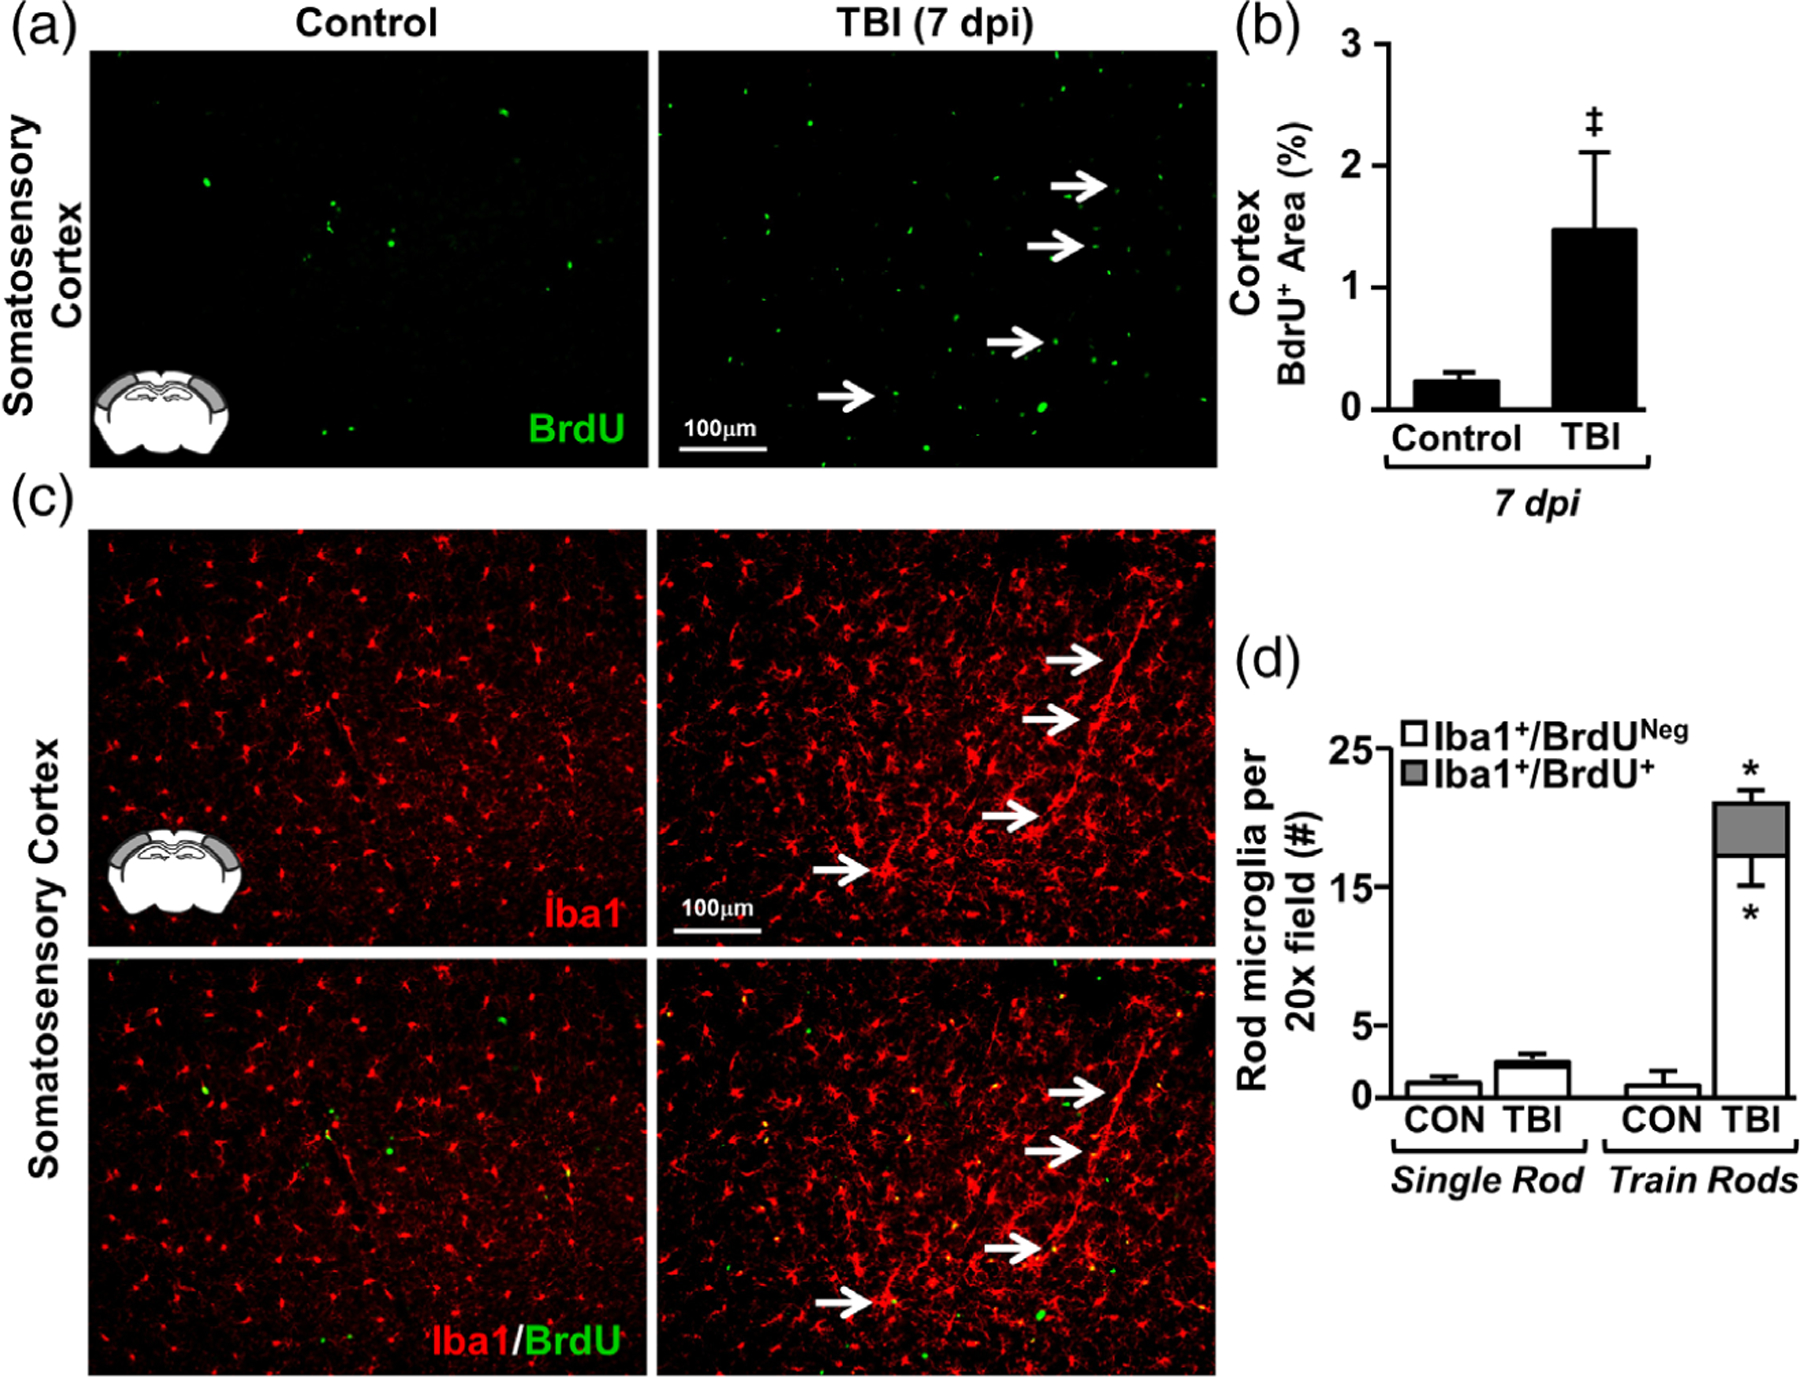
TBI-induced formation of rod microglia was associated with limited microglial proliferation. Adult C57BL/6 mice were uninjured (control) or were subjected to midline fluid percussion injury (TBI). Following TBI, mice were provided ad libitum access to drinking water containing 0.8 mg/ml 5-bromo-2-deoxyuridine (BrdU) for 7 days. Mice were also injected with BrdU (50 mg/kg) at 0900 and 1400 (light phase). At 7 days postinjury (dpi), brains were perfused, fixed, sectioned, and labeled for Iba1 and BrdU. (a) Representative images of BrdU labeling (20×) in the somatosensory cortex of control and TBI mice. Inset indicates region used for analysis. (b) Percent-area of BrdU labeling in the somatosensory cortex (n = 4). (c) Representative images (20×) of Iba1 labeling (top) and merged BrdU labeling (bottom). Arrows highlight the Iba+/BrdU+ rod microglia. (d) Number of Iba1+ rod microglia that were either BrdU+ or BrdUneg (n = 3). Bars represent mean ± SEM. Means with (*) are significantly different from controls (p < .05) and means with (‡) tend to be different from controls (p = .1)
3.4 |. Increased rod microglial formation in lateral cortex after TBI was associated with astrogliosis
Gene expression data indicate that diffuse TBI results in inflammation and robust astrocyte alterations in the lateral/somatosensory cortex that persisted 7 dpi. Here, rod microglial formation (Iba1) and astrocyte reactivity (GFAP) were determined in the somatosensory cortex 7 dpi. Again, there was increased rod microglia and train formation (Iba1+) in the somatosensory cortex 7 dpi (Figure 4a, top panel). Moreover, Figure 4a illustrates that there was robust GFAP+ immunoreactivity in the somatosensory cortex after TBI (middle panel) and this GFAP+ immunoreactivity was in close proximity to Iba1+ rod microglia (bottom panel). Notably, baseline GFAP+ labeling was sparse and limited to vasculature in the cortex of uninjured controls. This is consistent with previous studies in rodents showing that GFAP-labeling of astrocytes is region-specific (Lee, Messing, Su, & Brenner, 2008). Quantification of GFAP+ percent-area confirmed a significant increase in GFAP+ immunoreactivity 7 dpi compared to controls (F1,10 = 29.258; p < .001, Figure 4b). Furthermore, the presence of GFAP+ astrocytes was positively correlated with the number of rod microglia (R2 = 0.441, Figure 4c). In fact, cortical regions with >15 rod microglia 7 dpi accounted for the injury-associated increase in GFAP labeling (Figure 4d). Collectively, there was robust and spatially specific astrogliosis after TBI in cortical regions where rod microglia were detected.
FIGURE 4.
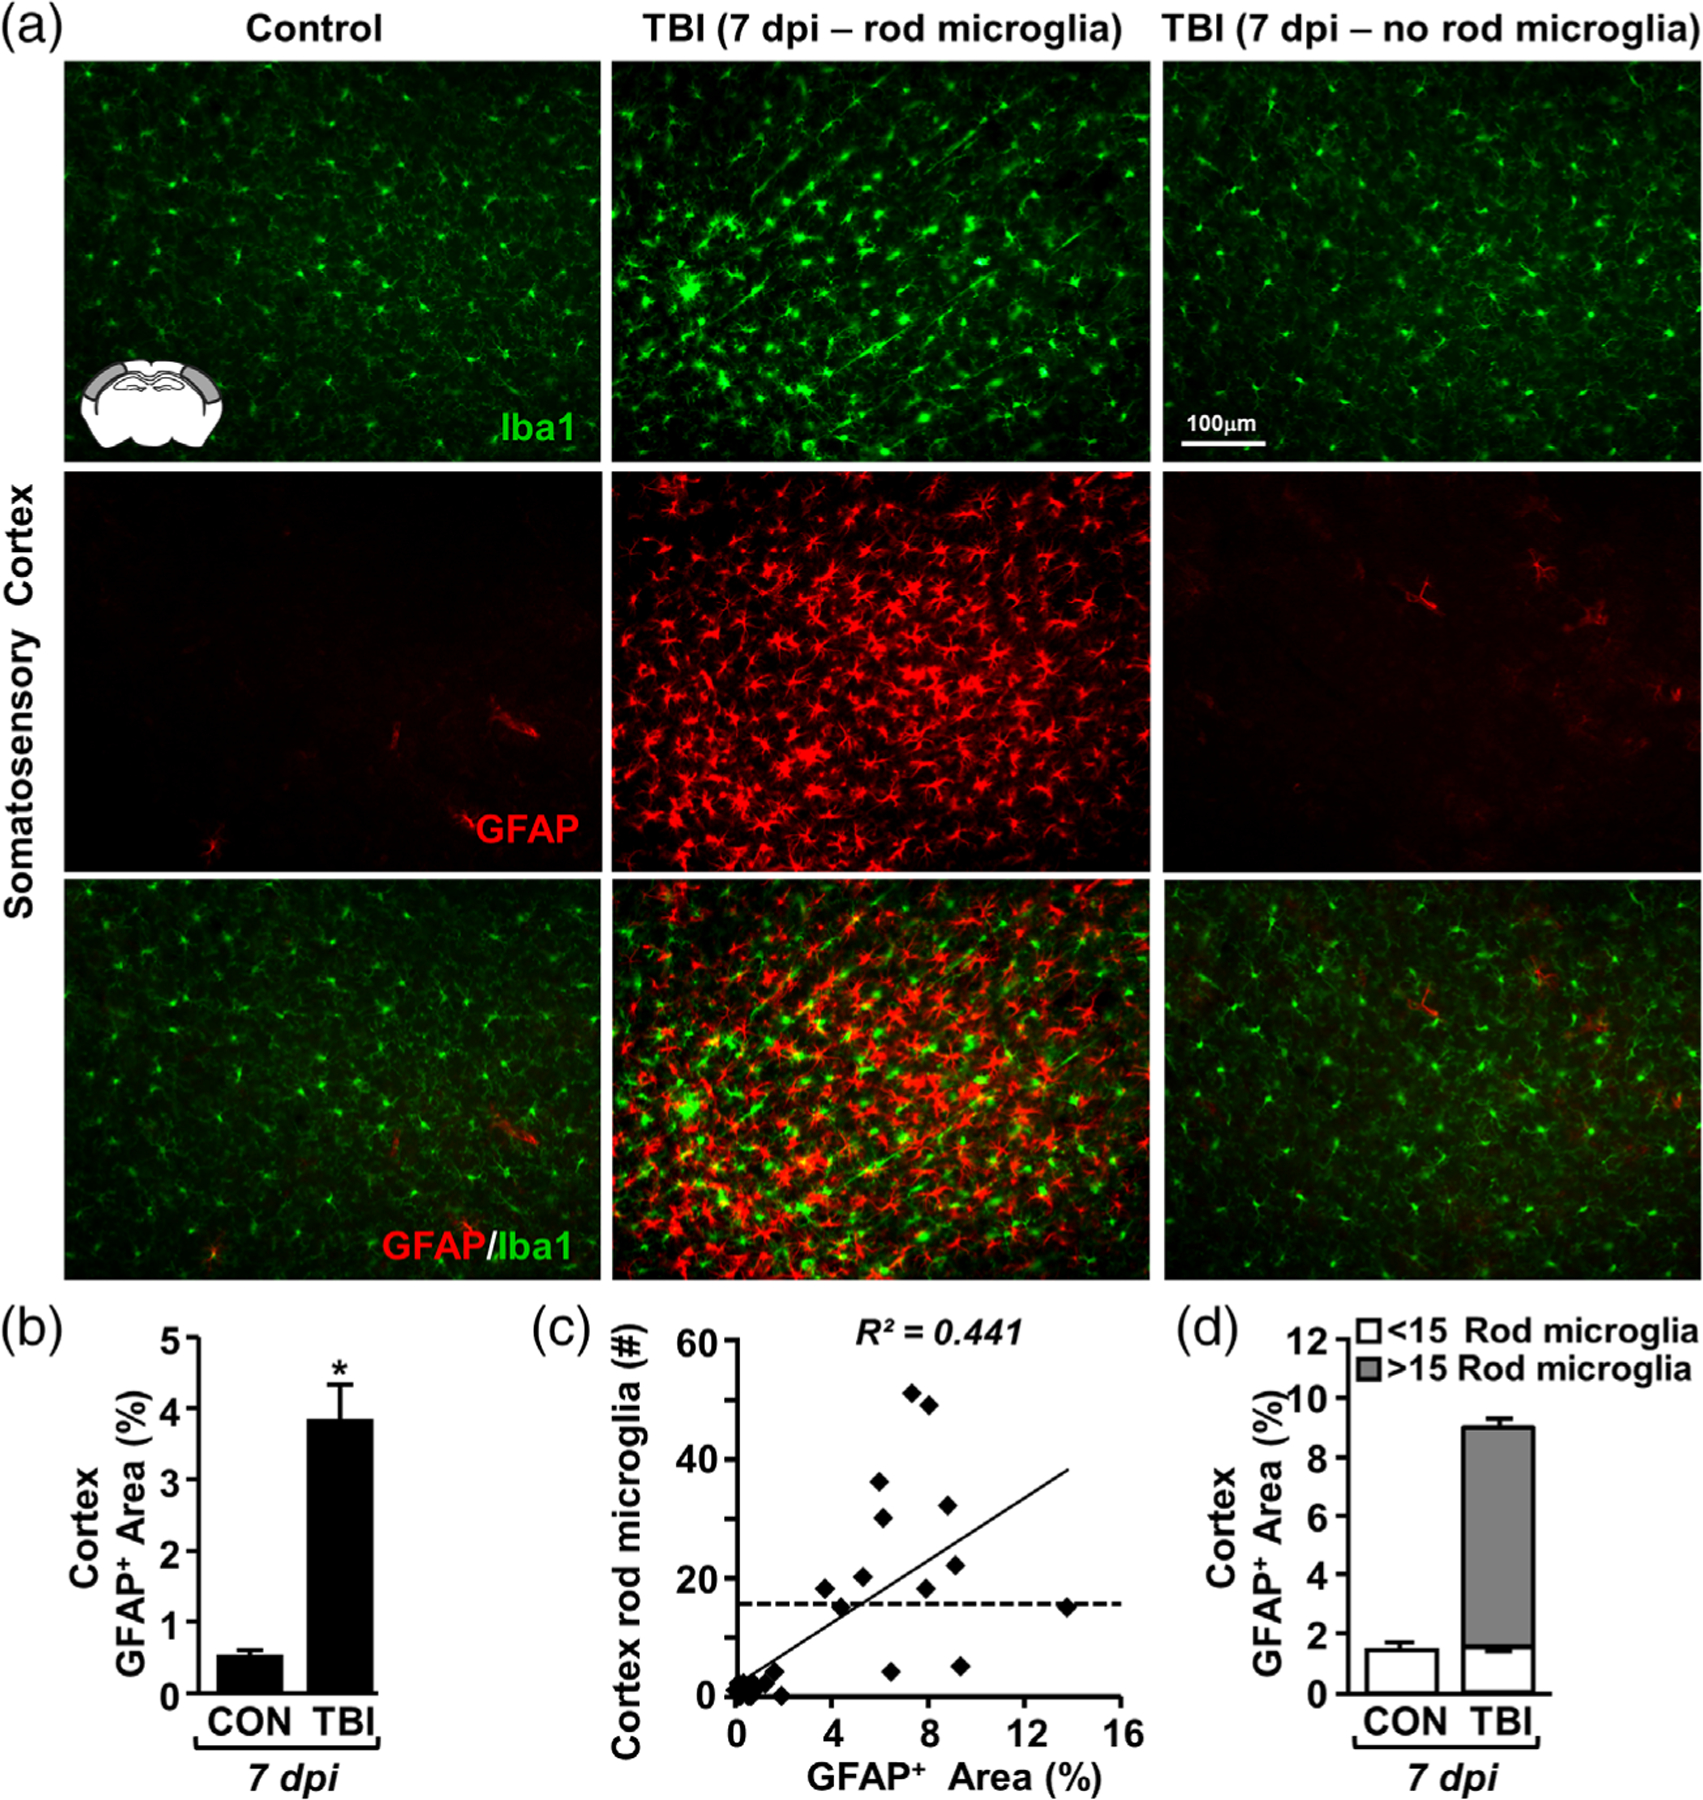
TBI-induced formation of rod microglia was spatially associated with astrogliosis. Adult C57BL/6 mice were uninjured (control) or were subjected to midline fluid percussion injury (TBI). At 7 dpi, brains were perfused, fixed, sectioned, and labeled for Iba1 (green) and GFAP (red). (a) Representative image of Iba1 (top), GFAP (middle), and merged (bottom) labeling from the somatosensory cortex of control and TBI mice either with (center) or without (right) rod microglia. (b) Percent-area of GFAP labeling in the cortex (n = 4). (c) Linear regression (R2 = 0.44) of GFAP+ area and the number of Iba1+ rod microglia per 20× field (n = 4). d) Post-hoc quantification of GFAP+ area (percent) in the presence of rod microglia (<15 or >15 rod microglia, n = 28 images). Bars represent the mean ± SEM. Means with (*) are significantly different from controls (p < .05)
3.5 |. Rod microglia formed in close proximity to ATF3+ neurons in the cortex after diffuse brain injury
TBI induced by midline fluid percussion injury causes axotomy of layer V pyramidal neurons in the cortex (Greer et al., 2011; Greer, Hanell, McGinn, & Povlishock, 2013). Moreover, this neuronal axotomy, determined by neuronal upregulation of ATF3, is reported in similar cortical regions as rod microglial formation (Greer et al., 2011; Ziebell et al., 2012) and rod microglia align with neurites after diffuse brain injury (Ziebell et al., 2012). Nonetheless, the cause of rod microglial alignment and the specific neuronal substrate on which they align are unknown. Thus, we sought to determine if rod microglia were spatially associated with axotomized neurons. Here, mice were uninjured or subjected to TBI and, 7 dpi, axotomized neurons were identified by positive labeling for activating transcription factor 3 (ATF3) as previously described (Greer et al., 2011). ATF3+ cells were quantified by nuclear morphology and fluorescence intensity above background levels. Notably, no ATF3+ neurons were detected in control mice. As hypothesized, ATF3+ neurons, Iba1+ microglia, and Iba1+ rod microglia were detected in the somatosensory cortex 7 dpi (Figure 5a). Moreover, there was a significant increase in the number of ATF3+ cells in the cortex 7 dpi compared to controls (F1,5 = 7.832; p < .04, Figure 5b). ATF3 labeling in Thy1-YFP-H mice 7 dpi confirmed that ATF3+ cells were layer V pyramidal neurons (Figure 5c). It is important to highlight that ATF3+ neurons were only detected in areas where rod microglia were concentrated. Thus, there may be a critical spatial association between rod microglia and axotomized neurons following TBI.
FIGURE 5.
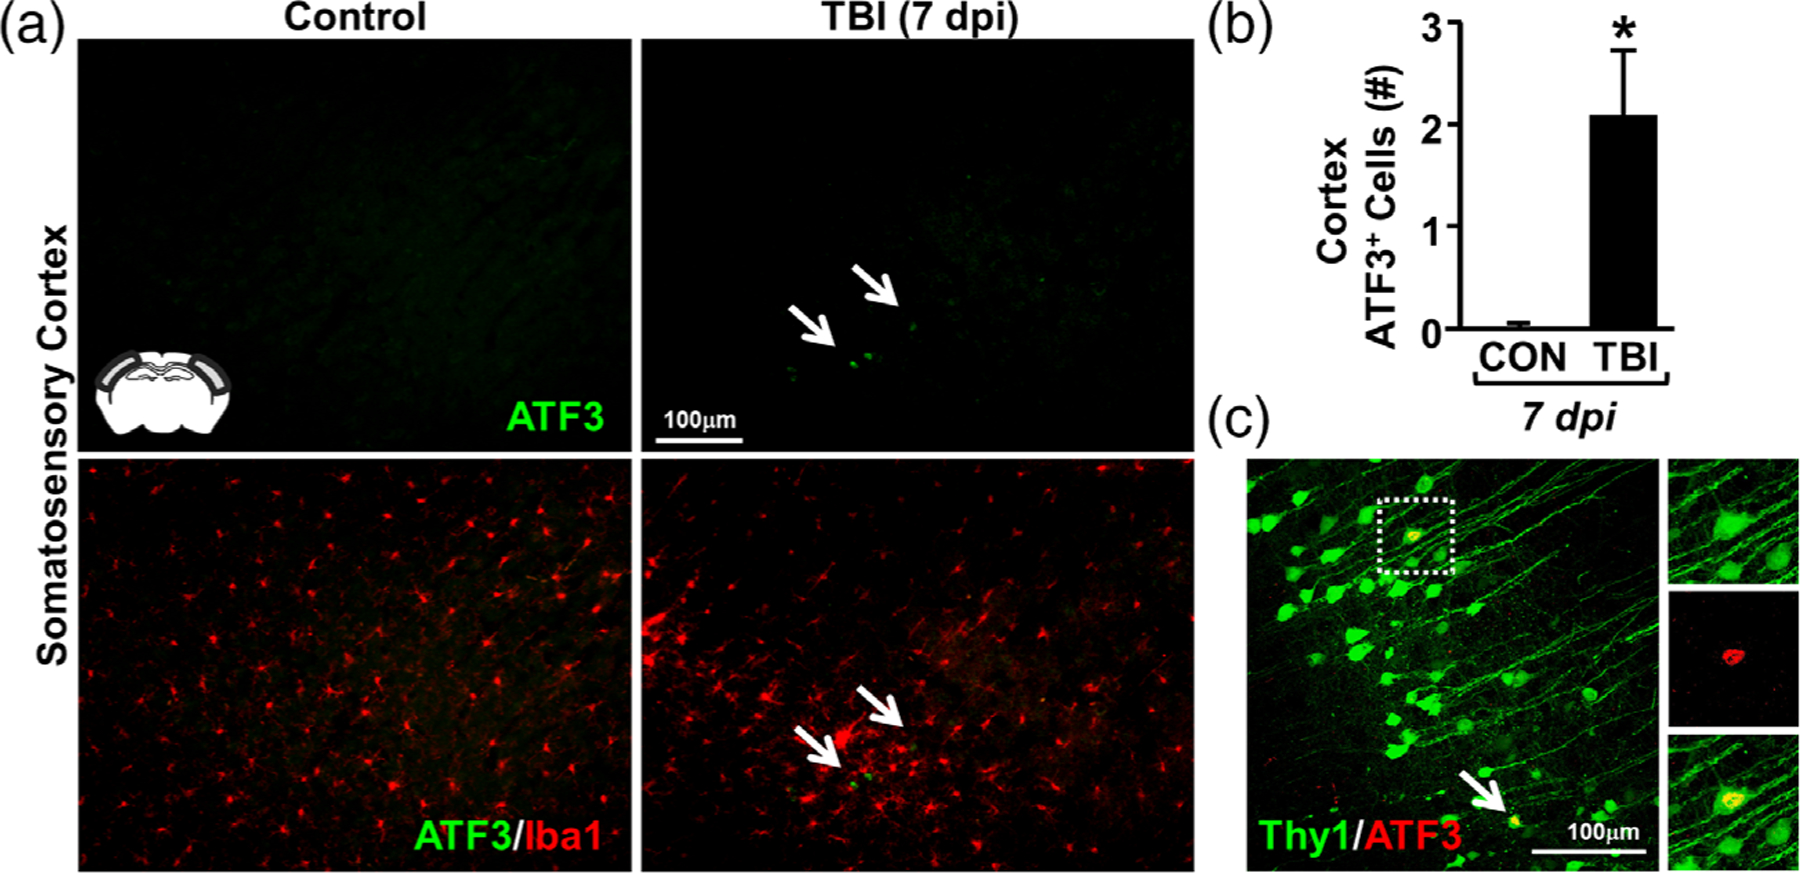
Rod microglia formed in close proximity to ATF3+ neurons in the somatosensory cortex after TBI. Adult C57BL/6 mice were uninjured (control) or were subjected to midline fluid percussion injury (TBI). At 7 dpi, brains were perfused, fixed, sectioned, and labeled for activating transcription factor 3 (ATF3, green) and Iba1 (red). (a) Representative images (20×) of ATF3 labeling (top) and merged images of ATF3 and Iba1 labeling (bottom). Inset indicates region used for analysis. Arrows highlights clustering of ATF3+ cells in the cortex 7 dpi. (b) Number of ATF3+ cells per 20× field in the somatosensory cortex of mice subjected to control or TBI (n = 4). (c) Representative confocal image (40×) shows Thy1-YFP+/ATF3+ neurons in the somatosensory cortex 7 dpi. Arrow highlights ATF3+ neuron and inset shows single-color images of YFP+/ATF3+ neuron. Bars represent the mean ± SEM. Means with (*) are significantly different from controls (p < .05)
3.6 |. Rod microglia aligned with apical dendrites of pyramidal neurons in the lateral cortex following TBI
We next sought to determine the structure that allows for the linear arrangement of rod microglia after TBI. We first assessed if rod microglia aligned along blood vessels 7 dpi. Here, cortical sections were labeled with Iba1 (microglia) and Ly6C (endothelial cells). As expected, rod microglia and trains of rod microglia were evident in the somatosensory cortex after TBI (Figure 6a). Analysis of Ly6C+ blood vessels and Iba1+ rod microglia confirmed the increase in rod microglia after TBI (F1,10 = 13.602; p < .01, Figure 6b). The majority of rod microglia (>90%), however, did not align along a vascular substrate and there was no difference between vascular-associated rod microglia in the cortex of controls and injured mice. Thus, these data are interpreted to indicate that rod microglial formation after TBI is along a nonvascular CNS substrate.
FIGURE 6.
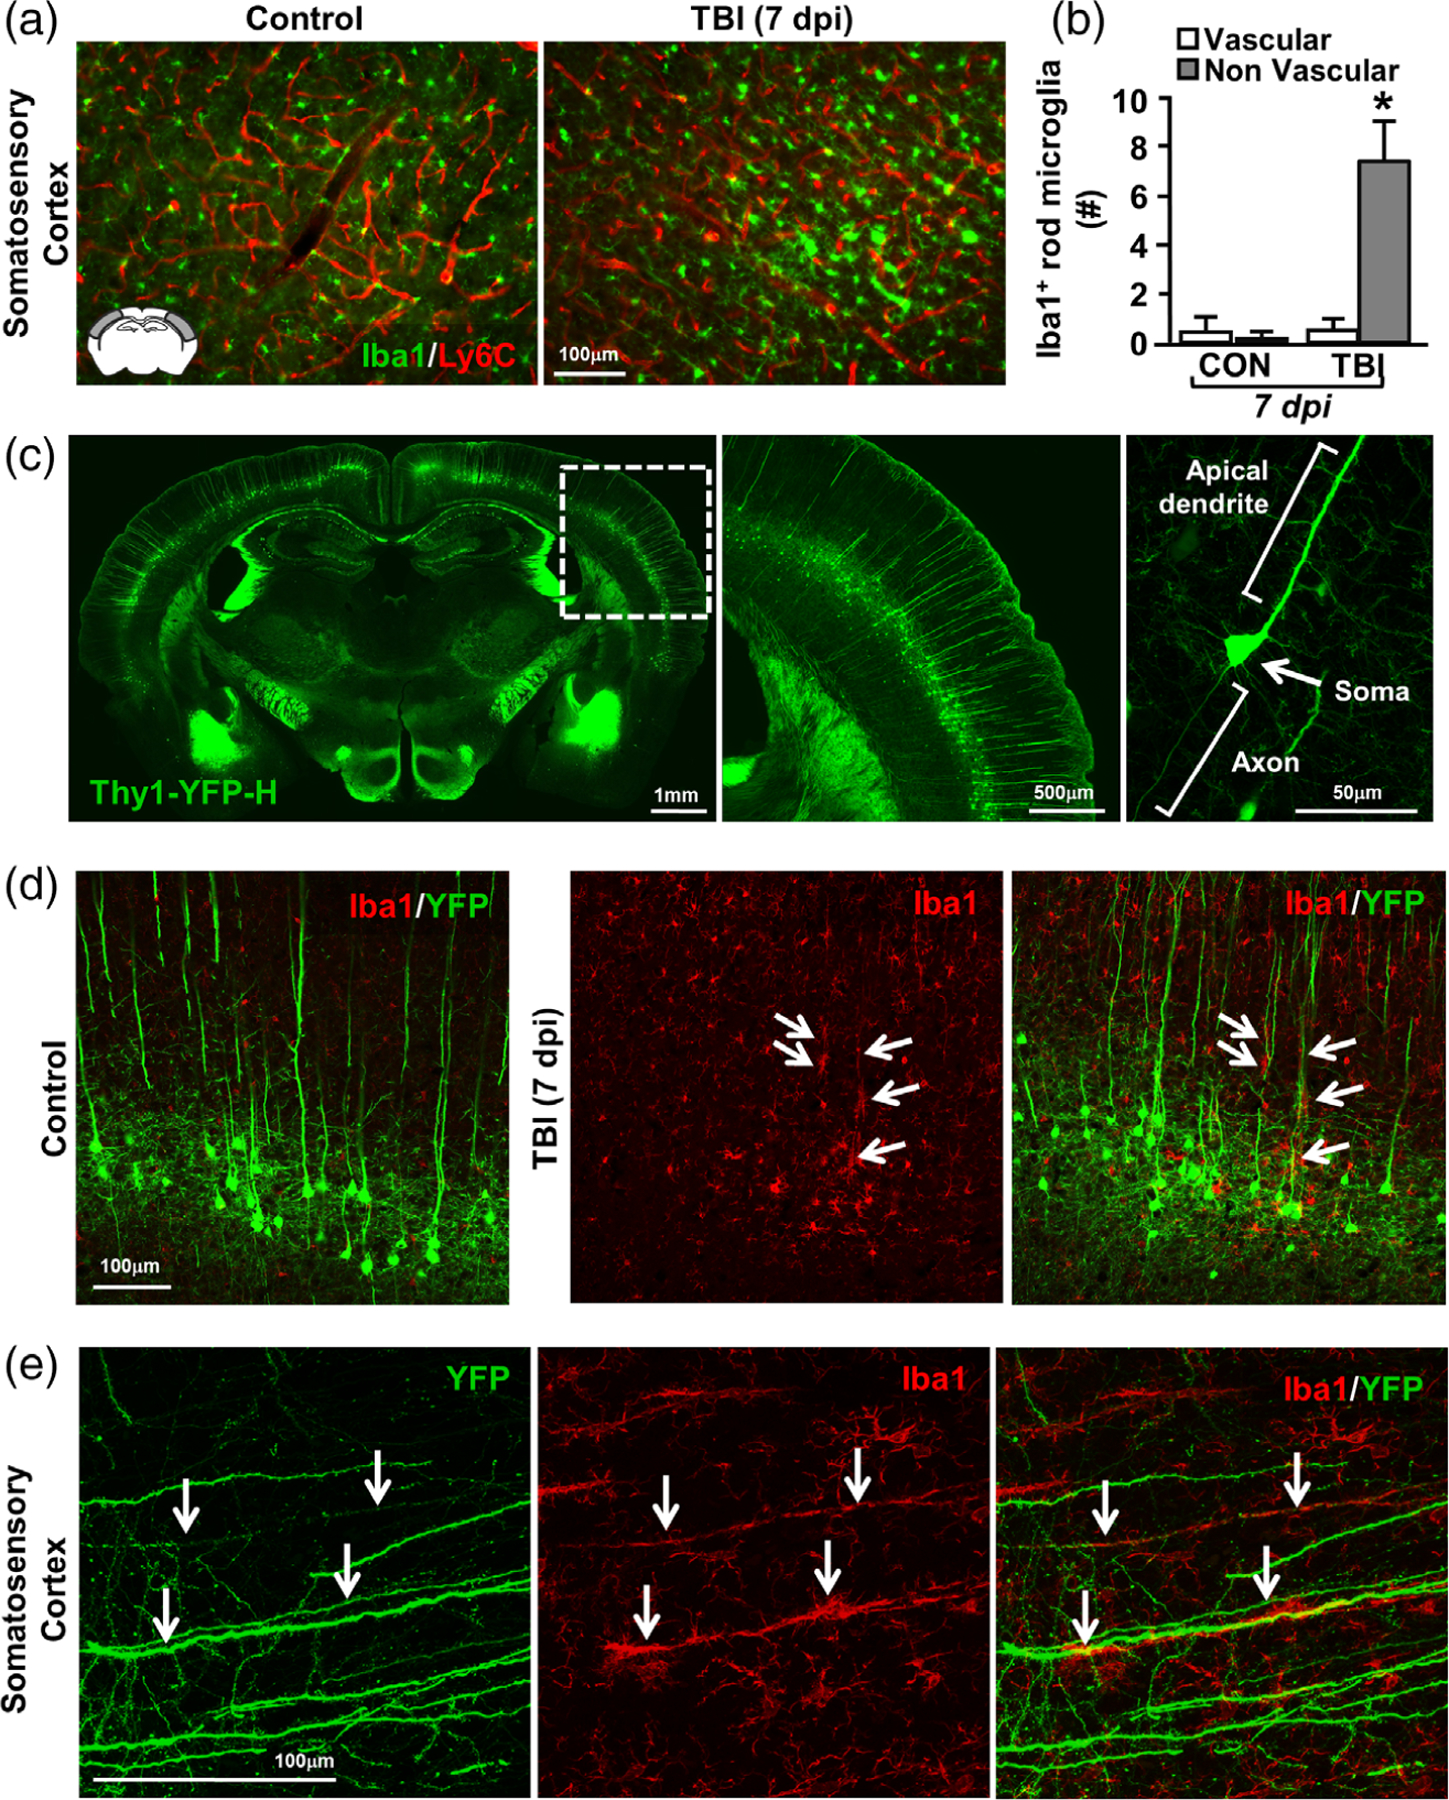
Rod microglia aligned with apical dendrites of injured neurons after TBI. Adult C57BL/6 mice were uninjured (control) or were subjected to midline fluid percussion injury (TBI). At 7 dpi, brains were perfused, fixed, sectioned, and labeled for Iba1 (green) and Ly6C (vasculature, red). (a) Representative merged images of Iba1 and Ly6C labeling in mice subjected to control or TBI. Inset indicates region used for analysis. (b) Number of Iba1+ rod microglia that were aligned with Ly6C+ vasculature or not. Bars represent the mean ± SEM. Means with (*) are significantly different from controls. In a separate experiment, Thy1-YFP-H mice were used to visualize the interaction between neurons and rod microglia. Bars represent the mean ± SEM. Means with (*) are significantly different from controls. (c) Representative images of control Thy1-YFP-H mice showing whole brain distribution of YFP (left), inset showing cortical distribution (middle), and detail of a single neuron (right). Next, Thy1-YFP-H mice were uninjured (control) or were subjected to midline fluid percussion injury (TBI). At 7 dpi, brains were perfused, fixed, sectioned, and labeled for 1ba-1. (d) Representative images (20×) of Iba1 (red) and YFP expression (green) from the somatosensory cortex of control and TBI mice 7 dpi. (e) Representative merged images (63×) of Iba1 (red) and YFP expression (green) from the somatosensory cortex of TBI mice 7 dpi. Arrows highlight Iba1+ rod microglia aligned with YFP+ apical dendrites
We next assessed the degree to which rod microglia aligned with neuronal structures in the cortex. For these experiments, we used Thy1-YFP-H reporter mice that express YFP in 10%–12% of layer V cortical pyramidal neurons (Feng et al., 2000). Figure 6c shows the distribution of YFP expression throughout the brain (left), cortex (middle), and fine details of neuronal structure within axon, soma, and apical dendrite (right). Rod microglial formation (Iba1) and neuronal structure (YFP) were determined in the somatosensory cortex of mice subjected to TBI or uninjured controls. Figure 6d shows the distribution of Iba1+ microglia and rod microglia among YFP+ neurons in the somatosensory cortex of control and TBI mice. In controls, Iba1+ microglia were evenly spaced among YFP+ pyramidal neurons (Figure 6d, left). Following TBI, hypertrophied microglia were detected amid layer V pyramidal neurons (Figure 6d, right). In addition, TBI-associated rod microglia (Iba1+) aligned with apical dendrites of the layer V pyramidal neurons (Figure 6d, right). Confocal imaging of rod microglia following TBI confirmed profound and specific alignment of train rod microglia along the YFP+ pyramidal apical dendrites (Figure 6e). Taken together, the linear arrangement of rod microglia in the somatosensory cortex after TBI is primarily detected along apical dendrites of layer V pyramidal neurons.
3.7 |. Microglial morphology and neuronal interactions were heterogeneous in the somatosensory cortex 7 dpi
In a similar set of studies, we used the microglial marker P2RY12 to determine microglial morphology and interactions with neurons in the Thy1-YFP-H reporter mice. Here, P2RY12+ and YFP+ labeling shows more evidence of physical interactions between neurons and microglia in the somatosensory cortex 7 dpi. In uninjured controls, P2RY12+ microglia had small, rounded somas and were evenly spaced throughout layer V (Figure 7a). Similar to the results in Figure 6 using Iba1, there was a robust increase in P2RY12+ rod microglia in the cortex 7 dpi that were selectively aligned with YFP+ apical dendrites (Figure 7b). There were also some P2RY12+ rod microglia that aligned with axons (Figure 7c). This, however, was a rare event because the majority of rod microglia were detected dorsal to layer V. Last, there were P2RY12+ microglia, which were not rod microglia, that associated with neuronal somas in the somatosensory cortex 7 dpi (Figure 7d). Overall, there was significant morphological diversity of microglia and dynamic physical interactions with neurons in the somatosensory cortex 7 dpi.
FIGURE 7.
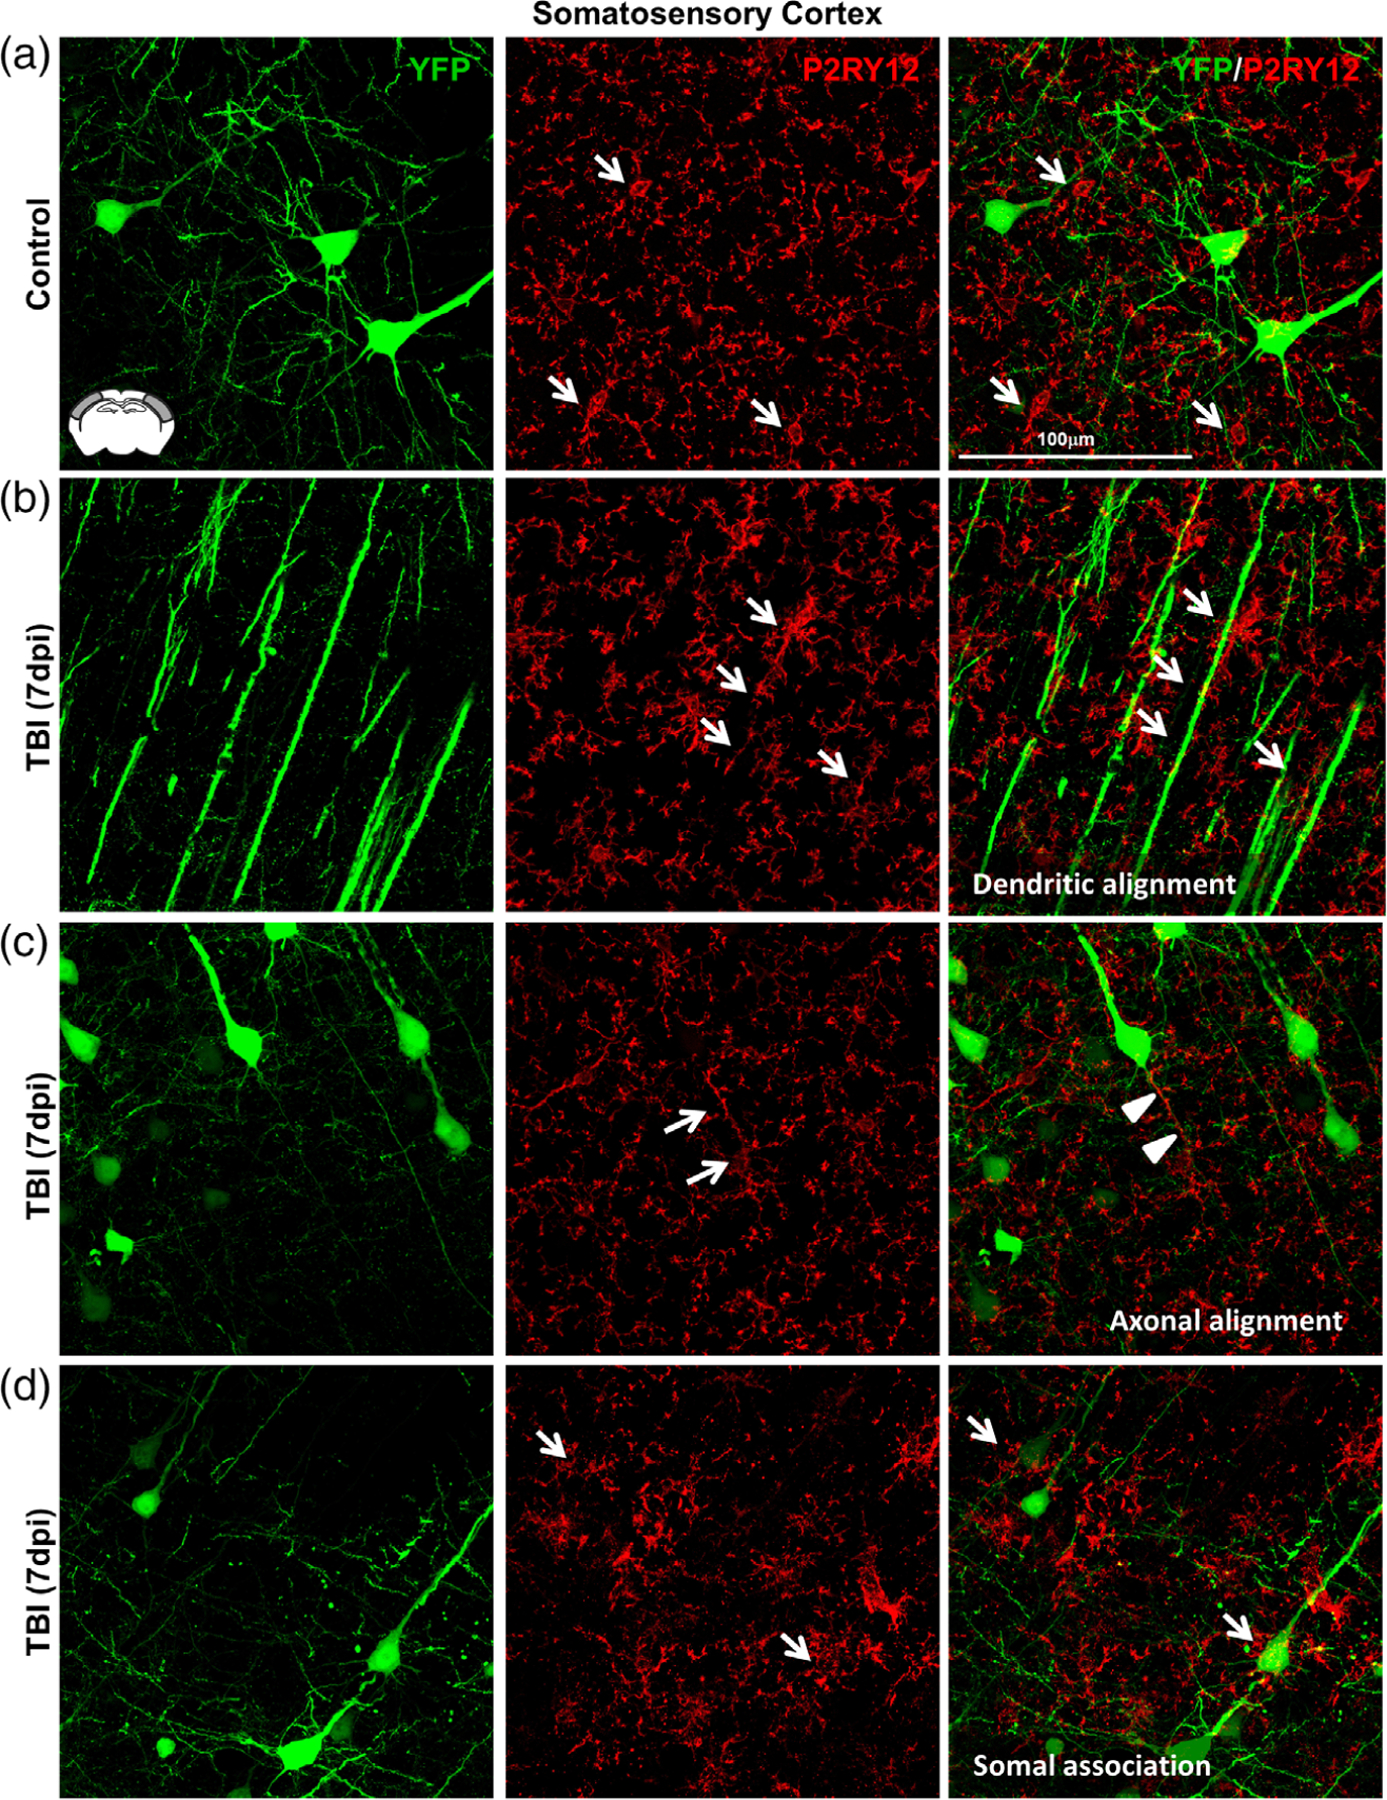
Microglia–neuronal interactions were heterogeneous in the somatosensory cortex 7 dpi. Thy1-YFP-H mice were uninjured (control) or were subjected to midline fluid percussion injury (TBI). At 7 dpi, brains were perfused, fixed, sectioned, and labeled for P2RY12 (red). Confocal imaging was used to visualize P2RY12 labeling and YFP expression (green). (a) Representative merged images (63×) of P2RY12 (red) and YFP expression (green) from the somatosensory cortex of control mice. Arrows show small P2RY12+ microglia (arrows) near YFP+ neurons. (b) Representative merged images (63×) of P2RY12 (red) and YFP expression (green) from the somatosensory cortex of TBI mice 7 days after injury. Arrows depict the alignment of P2RY12+ rod microglia with YFP+ apical dendrites. (c) Representative merged images (63×) of P2RY12 (red) and YFP expression (green) from the somatosensory cortex of TBI mice 7 days after injury. Arrows highlight rod microglia aligned with YFP+ axons of pyramidal neurons. (d) Representative merged images (63×) of P2RY12 (red) and YFP expression (green) from the somatosensory cortex of TBI mice 7 days after injury. Arrows denote microglia surrounding the soma of YFP+ neurons in cortical layer V
3.8 |. Elimination of microglia with a CSF1R antagonist PLX5622 attenuated rod microglial formation in the somatosensory cortex after TBI
We provide novel data that inflammation persisted in the somatosensory cortex for at least 7 days after diffuse TBI. Moreover, the landscape of the somatosensory cortex was dominated by GFAP+ astrocytes and rod microglia. These rod microglia primarily aligned with apical dendrites of cortical neurons in regions of neuronal axotomy. Thus, we aimed to ascertain the degree to which microglial elimination affected TBI-induced rod microglial formation, neuronal injury, astrogliosis, and inflammation. To complete this objective, microglia were eliminated prior to TBI with 14 days of dietary administration of the CSF1R antagonist, PLX5622 (Rice et al., 2015). Mice were maintained on experimental diet, uninjured or subjected to TBI, and samples were collected 7 dpi (Figure 8a).
FIGURE 8.
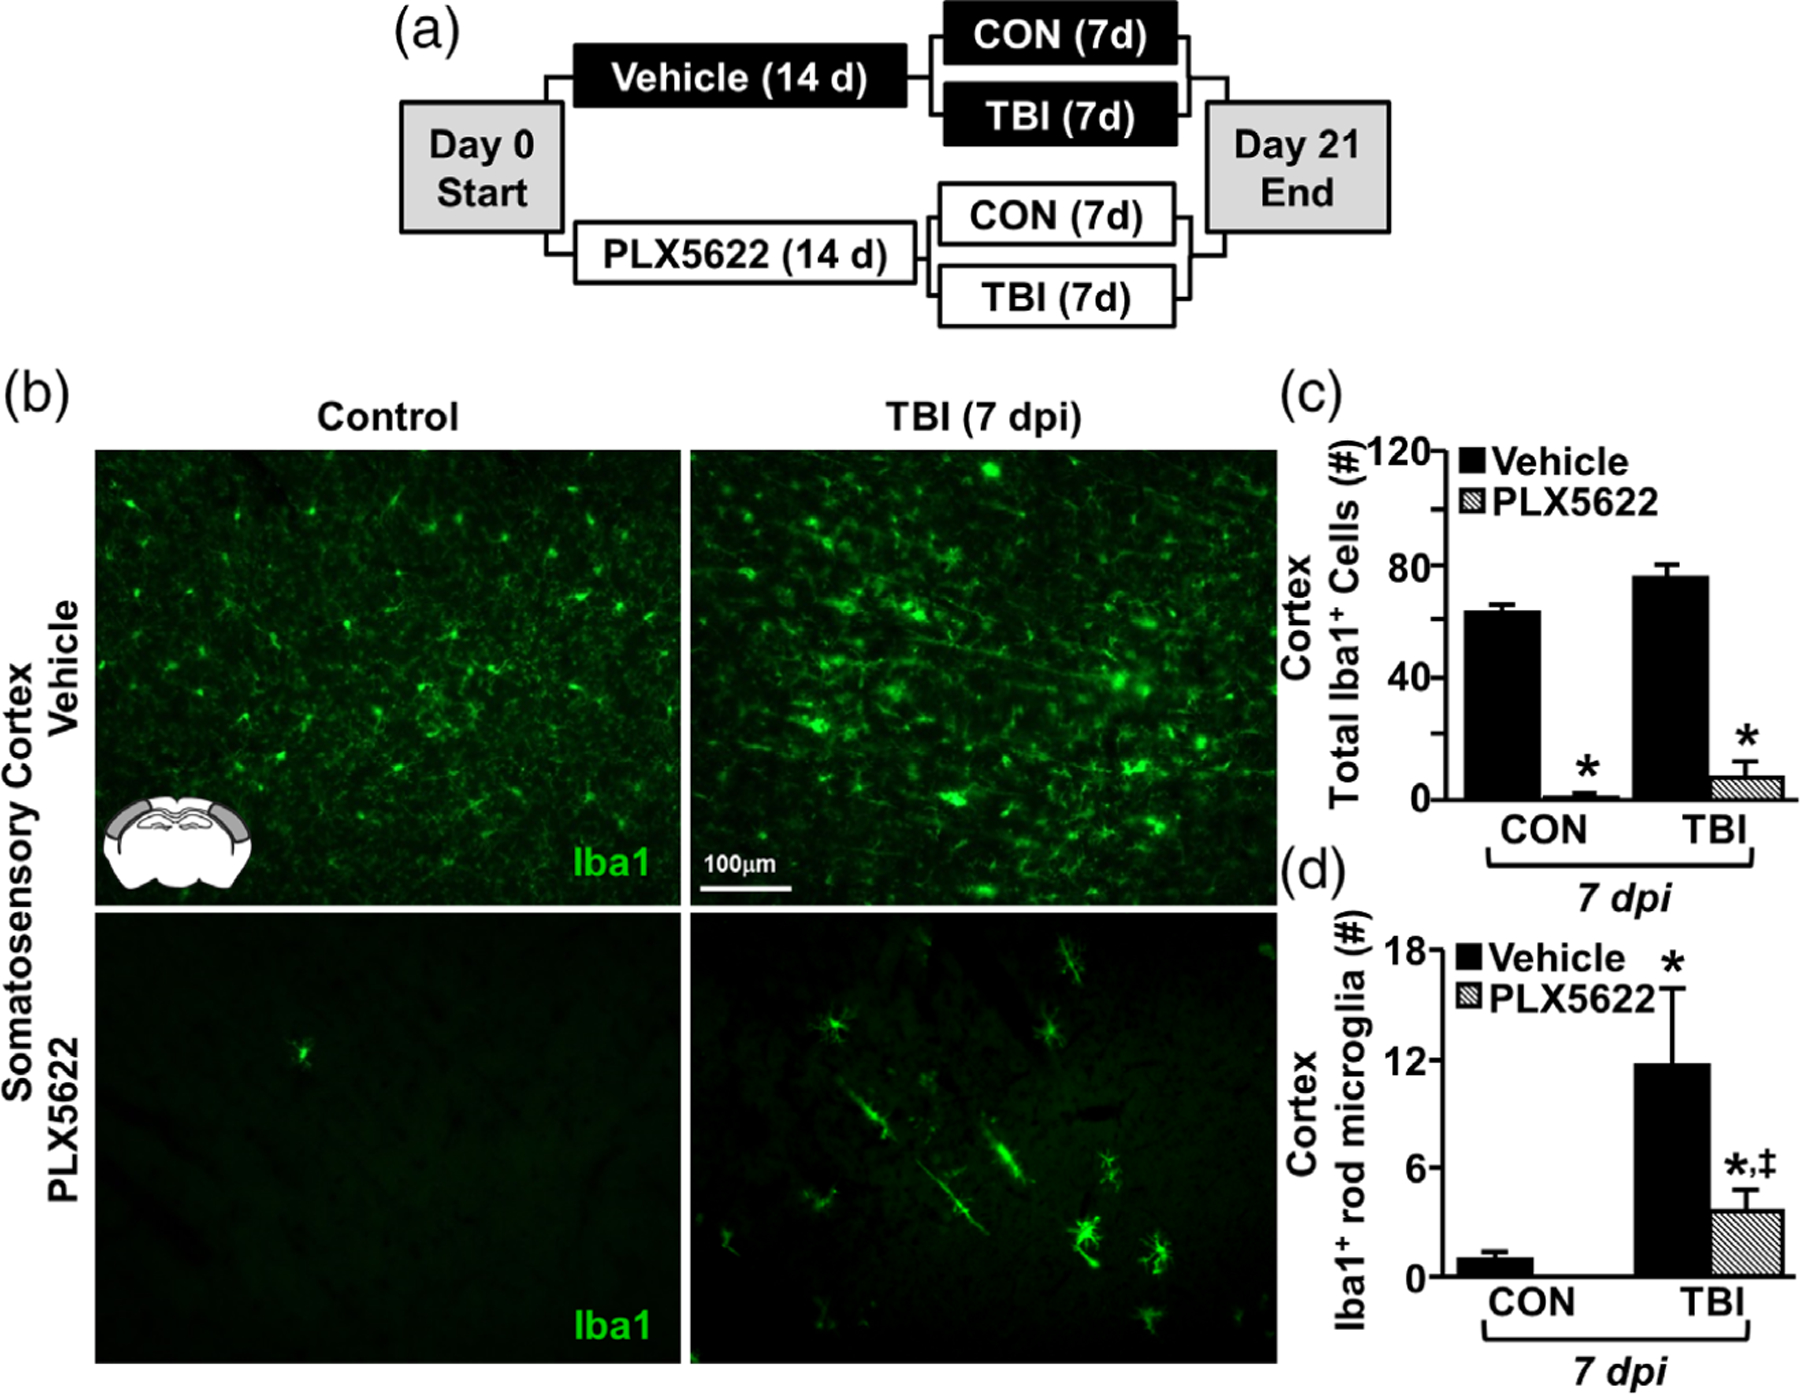
Elimination of microglia with the CSF1R antagonist PLX5622 attenuated rod microglial formation in the somatosensory cortex after TBI. (a) Adult C57BL/6 mice were provided diets formulated with either vehicle (Veh) or PLX5622 (PLX) for 14 days. Next, mice were uninjured (control) or were subjected to midline fluid percussion injury (TBI). At 7 dpi (21d of Veh or PLX diet), brains were perfused, fixed, sectioned, and labeled for 1ba1 (green). (b) Representative images of Iba1 labeling (20×) in the somatosensory cortex 7 dpi. Inset indicates region used for analysis. (c) Total number of Iba1+ cells per 20× field in the somatosensory cortex of mice subjected to control or TBI on Veh or PLX diet (n = 4). (d) Number of Iba1+ rod microglia per 20× field in the somatosensory cortex of mice subjected to control or TBI on Veh or PLX diet (n = 4). Bars represent the mean ± SEM. Means with (*) are significantly different from controls
As we and others have reported, PLX5622 administration robustly reduced the presence of Iba1+ microglia (Figure 8b) (McKim et al., 2017; Rice et al., 2015; Rice et al., 2017). Indeed, 21 day administration of PLX5622 resulted in an ~97% reduction of the number of Iba1+ microglia compared to vehicle-fed controls (Figure 8c, F1,10 = 271.233; p < .001). Moreover, this elimination of Iba1+ microglia was apparent in mice subjected to TBI. There was a main effect of PLX5622 on formation of rod microglia in the somatosensory cortex after TBI (F1,10 = 5.102; p < .05). Post hoc analysis revealed that there were still more rod microglia the PLX-TBI group compared to Veh-Controls (Figure 8d, p < .05). Moreover, there were more rod microglia detected 7 dpi in the Veh-TBI group compared to all other treatment groups (Figure 8d, p < .05). It is important to highlight that only limited measures of functional recovery (up to 7 days postinjury) were assessed in this study. There were no differences were observed between Veh-TBI and PLX-TBI in assessments of post-injury body mass, grooming behavior, or rotarod performance (data not shown). Overall, administration of PLX5622 eliminated microglia in the brain and attenuated rod microglial formation 7 dpi.
3.9 |. Elimination of microglia did not affect neuronal damage after TBI but attenuated astrogliosis
In the next set of experiments, we examined if microglial elimination prior to TBI affected neuronal injury and astrogliosis in the cortex 7 dpi. First, rod microglia and evidence of neuronal axotomy (ATF3+ nuclei) were assessed in the lateral cortex of mice with or without microglia subjected to TBI. As previously described, ATF3+ cells were detected in the somatosensory cortex 7 dpi in close proximity to rod microglia (Figure 9a). There was an increased number of ATF3+ neurons in the somatosensory cortex 7 dpi (Tendency: F1,10 = 3.2, p = .1, Figure 9b). The presence of neuronal injury at 7 dpi, however, was unaffected by microglial elimination (PLX5622). Post hoc analysis revealed that the same number of ATF3+ cells was detected in the cortex of Veh-TBI mice and PLX-TBI mice (Figure 9b). Next, we quantified number of NeuN+ nuclei in the somatosensory cortex 7 dpi. These data show that there were no differences in NeuN+ cell number in the somatosensory cortex following TBI or microglial elimination (Figure 9c,d). Thus, TBI-associated neuronal survival and neuronal axotomy (ATF3+) at 7 dpi was unaffected by the elimination of microglia with PLX5622.
FIGURE 9.
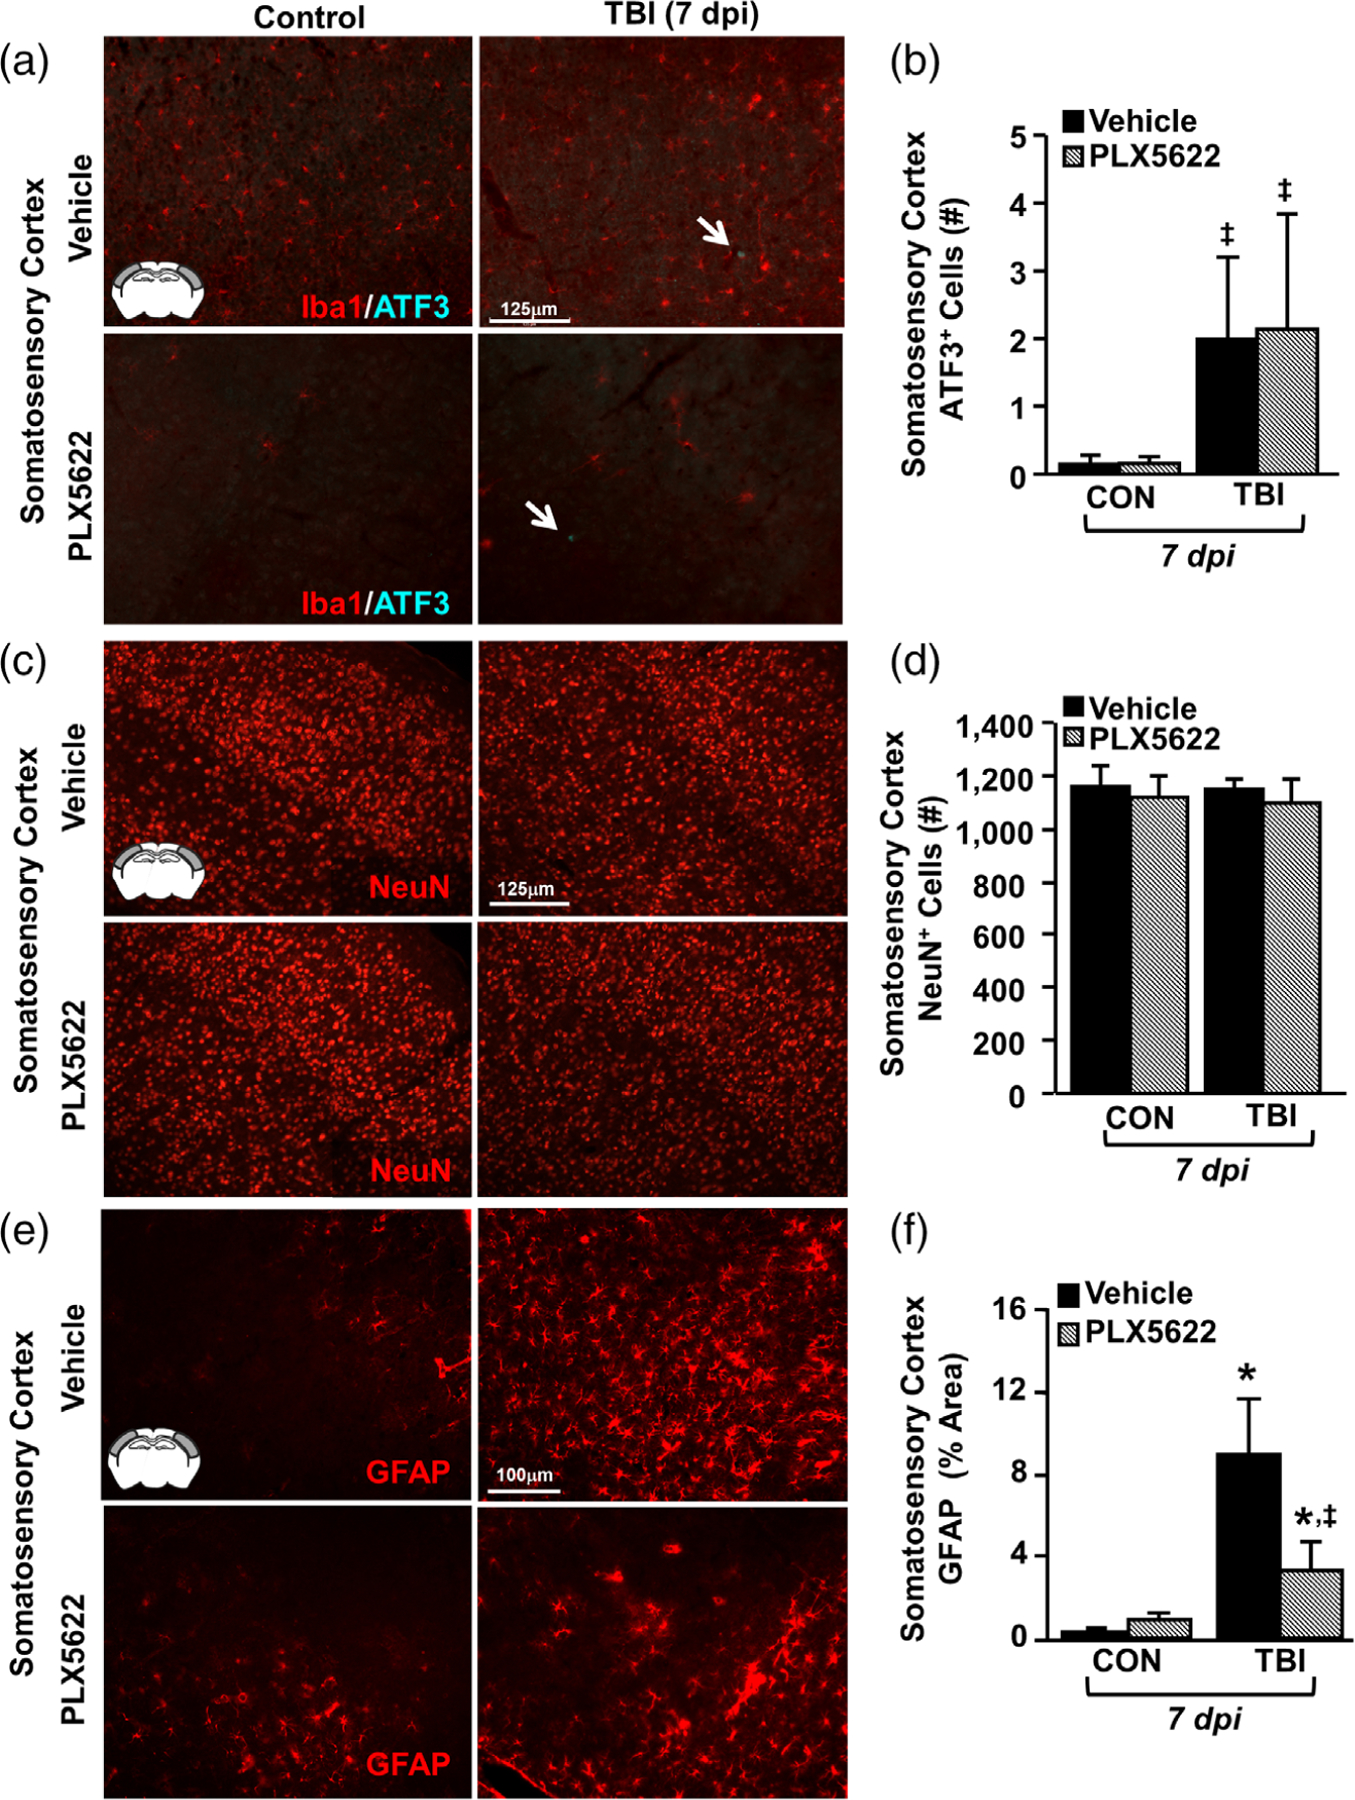
Elimination of microglia did not affect neuronal damage after TBI but attenuated astrogliosis. Adult C57BL/6 mice were provided diets formulated with either vehicle or PLX5622 for 14 days. Next, mice were uninjured (control) or were subjected to midline fluid percussion injury (TBI). At 7 dpi (21d of Veh or PLX diet), brains were perfused, fixed, sectioned, and labeled for 1ba1, ATF3, NeuN, or GFAP. (a) Representative merged images of Iba1 (red) and ATF3 (cyan) labeling (20×) in the somatosensory cortex 7 dpi. Inset indicates region used for analysis. (b) Number of ATF3+ cells per 20× field in the somatosensory cortex 7 dpi (n = 4). Arrow indicates an ATF3+ cell. (c) Representative images of NeuN labeling (20×) in the somatosensory cortex 7 dpi. (d) Number of NeuN+ cells per 20× field in the somatosensory cortex 7 dpi (n = 4). (e) Representative images of GFAP labeling (20×) in the somatosensory cortex 7 dpi. (f ) Percent-area of GFAP labeling in the somatosensory cortex 7 dpi (n = 4). Bars represent the mean ± SEM. Means with (*) are significantly different from Veh-CON (p < .05) and means with (‡) tend to be different than Veh-CON (p = .06)
In the analysis of astrogliosis, there was marked GFAP+ immunoreactivity in the somatosensory cortex of vehicle mice subjected to TBI (Figure 9e). Here, GFAP immunoreactivity was increased by TBI (F1,10 = 11.634; p = .007) and was reduced by microglial elimination (tendency: injury × intervention, F1,10 = 3.662; p = .09). Post-hoc analysis confirmed that the highest level of GFAP immunoreactivity was in the Veh-TBI group compared to all other groups (Figure 9f, p < .05). These results indicate that astrogliosis present in the cortex 7 dpi was associated with increased microglial activity.
3.10 |. Cortical inflammation persisted 7 dpi and differed from the acute response to TBI
In the next set of experiments, we examined if microglial elimination prior to TBI affected inflammation within the lateral cortex 8 hr and 7 days postinjury. As above, microglia were eliminated prior to TBI using the PLX5622-CSF1R antagonist. Mice were then subjected to sham-surgery (CON) or TBI. At either 8 hr or 7 days postinjury, RNA was isolated from the lateral cortex and gene expression (mRNA transcript copy number) was quantified using a NanoString Mouse Inflammation V2 Panel Plus (262 genes). Genes that were differentially expressed between groups were determined using DESeq2 in R (Love et al., 2014).
Figure 10 highlights the comparisons between sham-injured controls and TBI mice fed vehicle diet at both 8 hours postinjury (hpi) and 7 dpi. First, a principle component analysis (PCA) was performed to allow for unsupervised visualization across groups. The PCA plot in Figure 10a shows that the samples cluster into 4 primary groups: group 1 (7 dpi-CON), group 2 (8 hpi-CON), group 3 (8 hpi-TBI), group 4 (7 dpi-TBI). Principle component (PC) 1 describes variation caused by TBI across both time points while PC2 describes variation between time points. This analysis indicates that there are inflammatory changes in the cortex that are both conserved and different at 8 hpi and 7 dpi.
FIGURE 10.
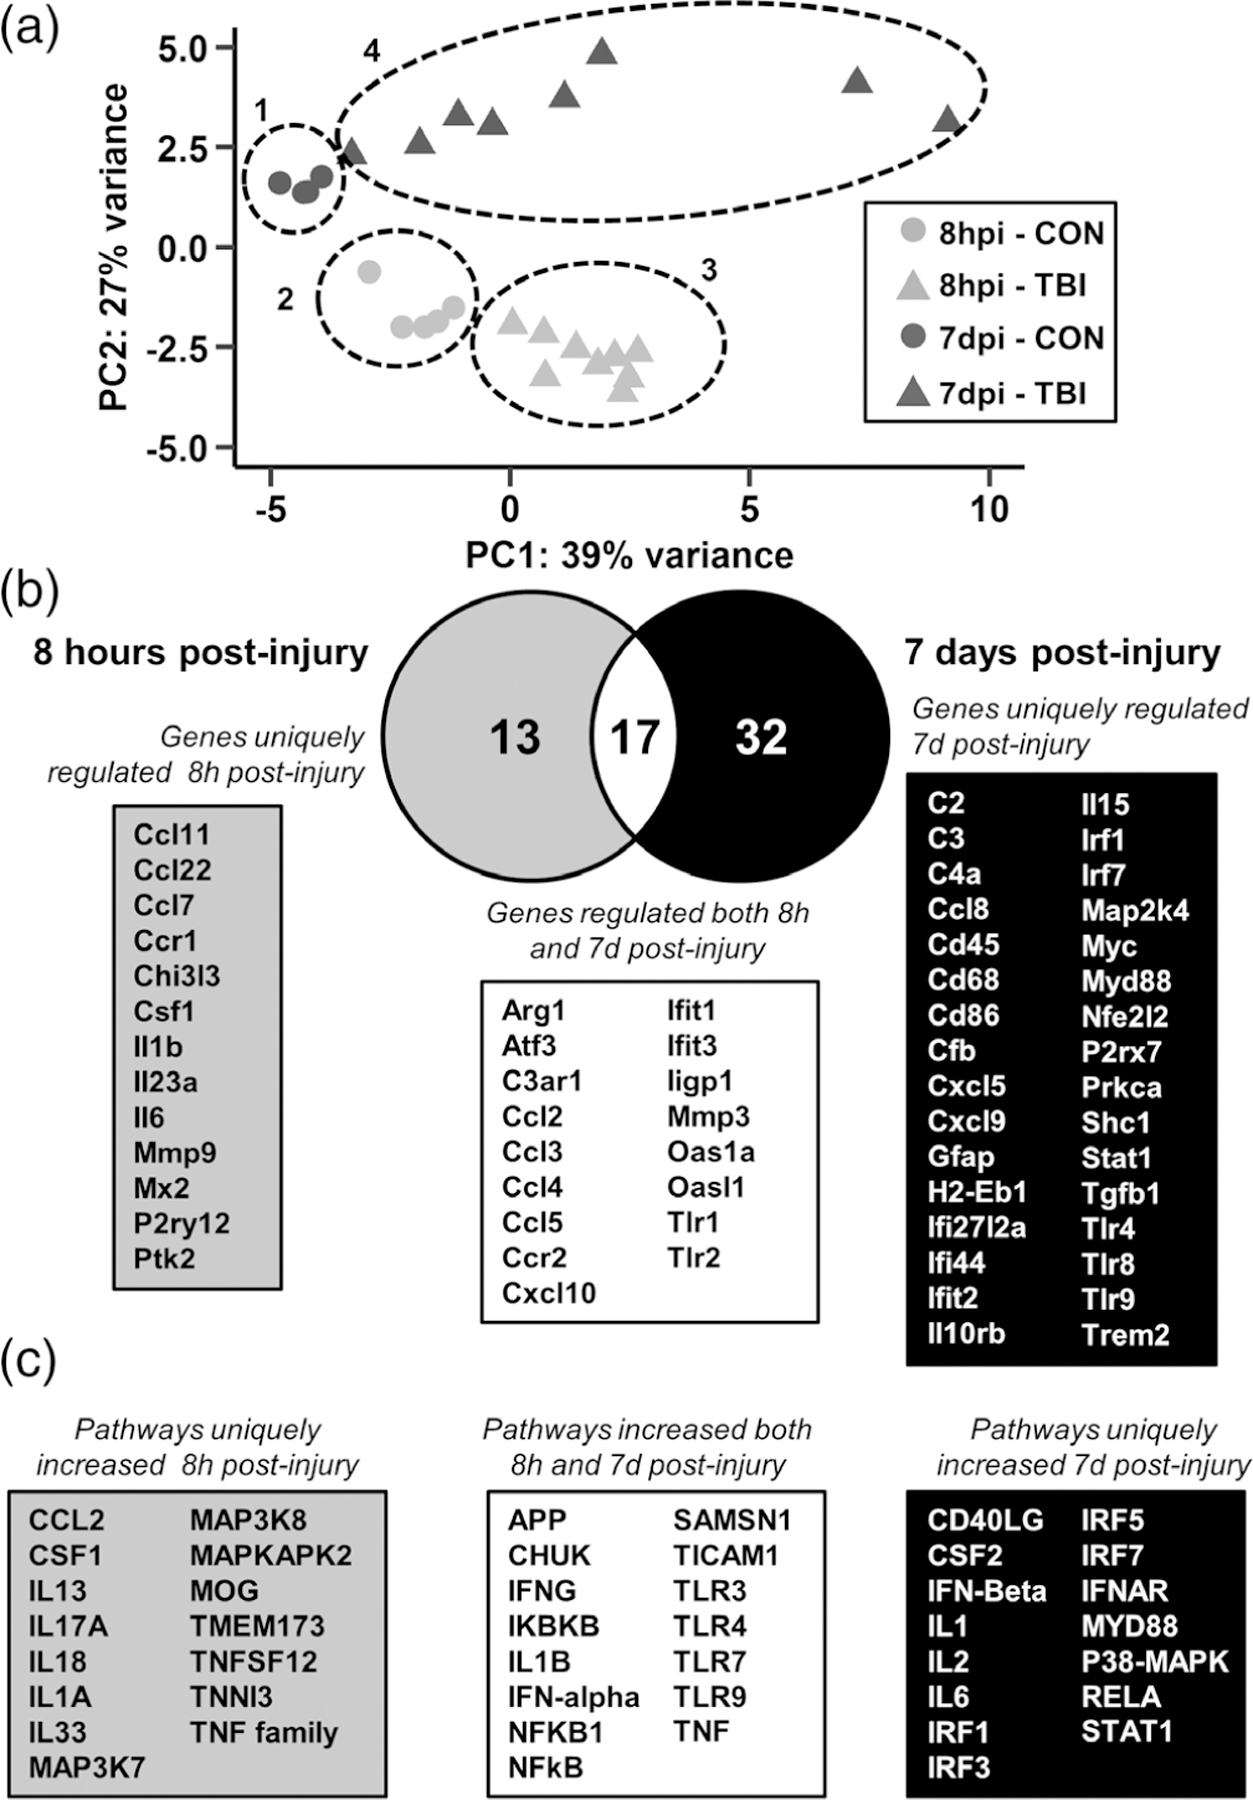
Distinct inflammatory pathways remained elevated in the lateral cortex 7 dpi compared to 8 hpi. Adult C57BL/6 mice were provided diets formulated with either vehicle or PLX5622 for 14 days. Next, mice were sham-injured (CON) or were subjected to midline fluid percussion injury (TBI). At either 8 hpi or 7 dpi (14–21 days of Veh or PLX diet), the cortex was dissected, flash-frozen, and RNA was extracted. mRNA copy number of 262 genes was determined by NanoString nCounter mouse inflammation v2 panel plus. (a) Principle component analysis of mice fed vehicle diet and sacrificed either 8 hr or 7 days postinjury (8 hpi-CON, 8 hpi-TBI, 7 dpi-CON, and 7 dpi-TBI). Circles denote sample clustering. (a) Differentially expressed gene lists for the 8hpi-TBI versus 8hpi-CON and 7dpi-TBI versus 7dpi-CON comparisons were compared by Venn diagram. (c) Differentially expressed genes for each comparison were used for Ingenuity Pathway Analysis (IPA) and the top 30 increased upstream regulators at 8 hpi, 7 dpi, or both are shown
To distinguish the effect of TBI at 8 hpi and 7 dpi, differential gene expression lists were generated for the 8 hpi-TBI versus 8 hpi-CON and 7 dpi-TBI versus 7 dpi-CON comparisons. The Venn diagram in Figure 10b reflects the number of differentially expressed genes in each comparison. There were 13 genes uniquely regulated 8 hpi, including Ccl7, Ccr1, Il1b, Il6, and Mmp9. Several genes were increased at both 8 hpi and 7 dpi, including Atf3, Ccl2, Ccr2, Mmp3, and Tlr1/2. Last, 32 genes were uniquely regulated 7 dpi, including C2, C3, Cd68, H2-Eb1, Gfap, P2rx7, Tgfb1, and Trem2. Next, these differential expression results were used for Ingenuity Pathway Analysis (IPA; QIAGEN Inc.) to determine significantly upregulated upstream regulators. Pathways were ranked based on magnitude of z-score and p value and the top 30 for each comparison (8hpi-TBI versus 8hpi-CON and 7 dpi-TBI versus 7 dpi-CON) are shown in Figure 10c. At 8 hpi, uniquely increased pathways included CCL2 (9 genes, p = 5E-16, z = 2.9), myelin oligodendrocyte glycoprotein (MOG; 12 genes, p = 1E-24, z = 3.1), and the TNF family of cytokines (11 genes, p = 3E-17, z = 3.1). At both 8 hpi and 7 dpi, pathways regulated by amyloid precursor protein (APP; 8 hpi: 15 genes, p = 6E-14, z = 3.5; 7 dpi: 22 genes, p = 8E-31, z = 3.0), IL-1β (8 hpi: 16 genes, p = 1E-21, z = 3.3; 7 dpi: 15 genes, p = 9E-31, z = 4.5), interferon-γ (8 hpi: 26 genes, p = 9E-29, z = 4.1; 7 dpi: 23 genes, p = 7E-49, z = 5.2), and toll-like receptor 4 (8 hpi: 17 genes, p = 4E-23, z = 3.1; 7 dpi: 17 genes, p = 9E-38, z = 4.8) were increased. Finally, pathways uniquely regulated 7 dpi included IFNβ (18 genes, p = 2E-26, z = 3.8), IL-6 (20 genes, p = 5E-34, z = 3.5), and Myd88 (15 genes, p = 4E-27, z = 3.9). These data indicate that while there was an inflammatory response conserved at both 8 hpi and 7 dpi, a unique inflammatory mRNA signature persisted up to 7 dpi.
Next, we characterized the gene expression changes caused by microglial elimination at baseline. The PCA plot in Figure 11a shows unsupervised clustering of cortical expression profiles from control mice fed either vehicle or PLX5622 diet. Differential gene expression results from the PLX-CON versus Veh-CON comparison from the 7 dpi experiment were used for Ingenuity Pathway Analysis of canonical pathway and upstream regulator alterations. The highest z-scores for the canonical pathway analysis are shown in Figure 11b. PLX caused a marked modification in baseline gene expression with reductions in neuroinflammatory signaling (12 genes, p = 2.4E-16), PAMP receptor signaling (7 genes, p = 1.4E-10), TREM1 Signaling (6 genes, p = 2.2E-10), dendritic cell maturation (5 genes, p = 2.3E-6), and NFκB signaling (4 genes, p = 5.0E-05). Figure 11c shows the upstream regulators most affected by PLX at baseline. This analysis shows PLX-dependent reductions in genes within the cortex associated with IL-10 (11 genes, p = 9.3E-14), TGFβ (17 genes, p = 1.8E-13), CSF2 (10 genes, p = 4.0E-11), IL-2 (10 genes, p = 3.0E-10), and IL-1β (10 genes, p = 2.2E-8). There were no significant pathways or upstream regulators detected that were increased following the elimination of microglia. Thus, these results are interpreted to indicate that microglia are the primary cell type mediating immune and inflammatory signaling pathways in the brain.
FIGURE 11.
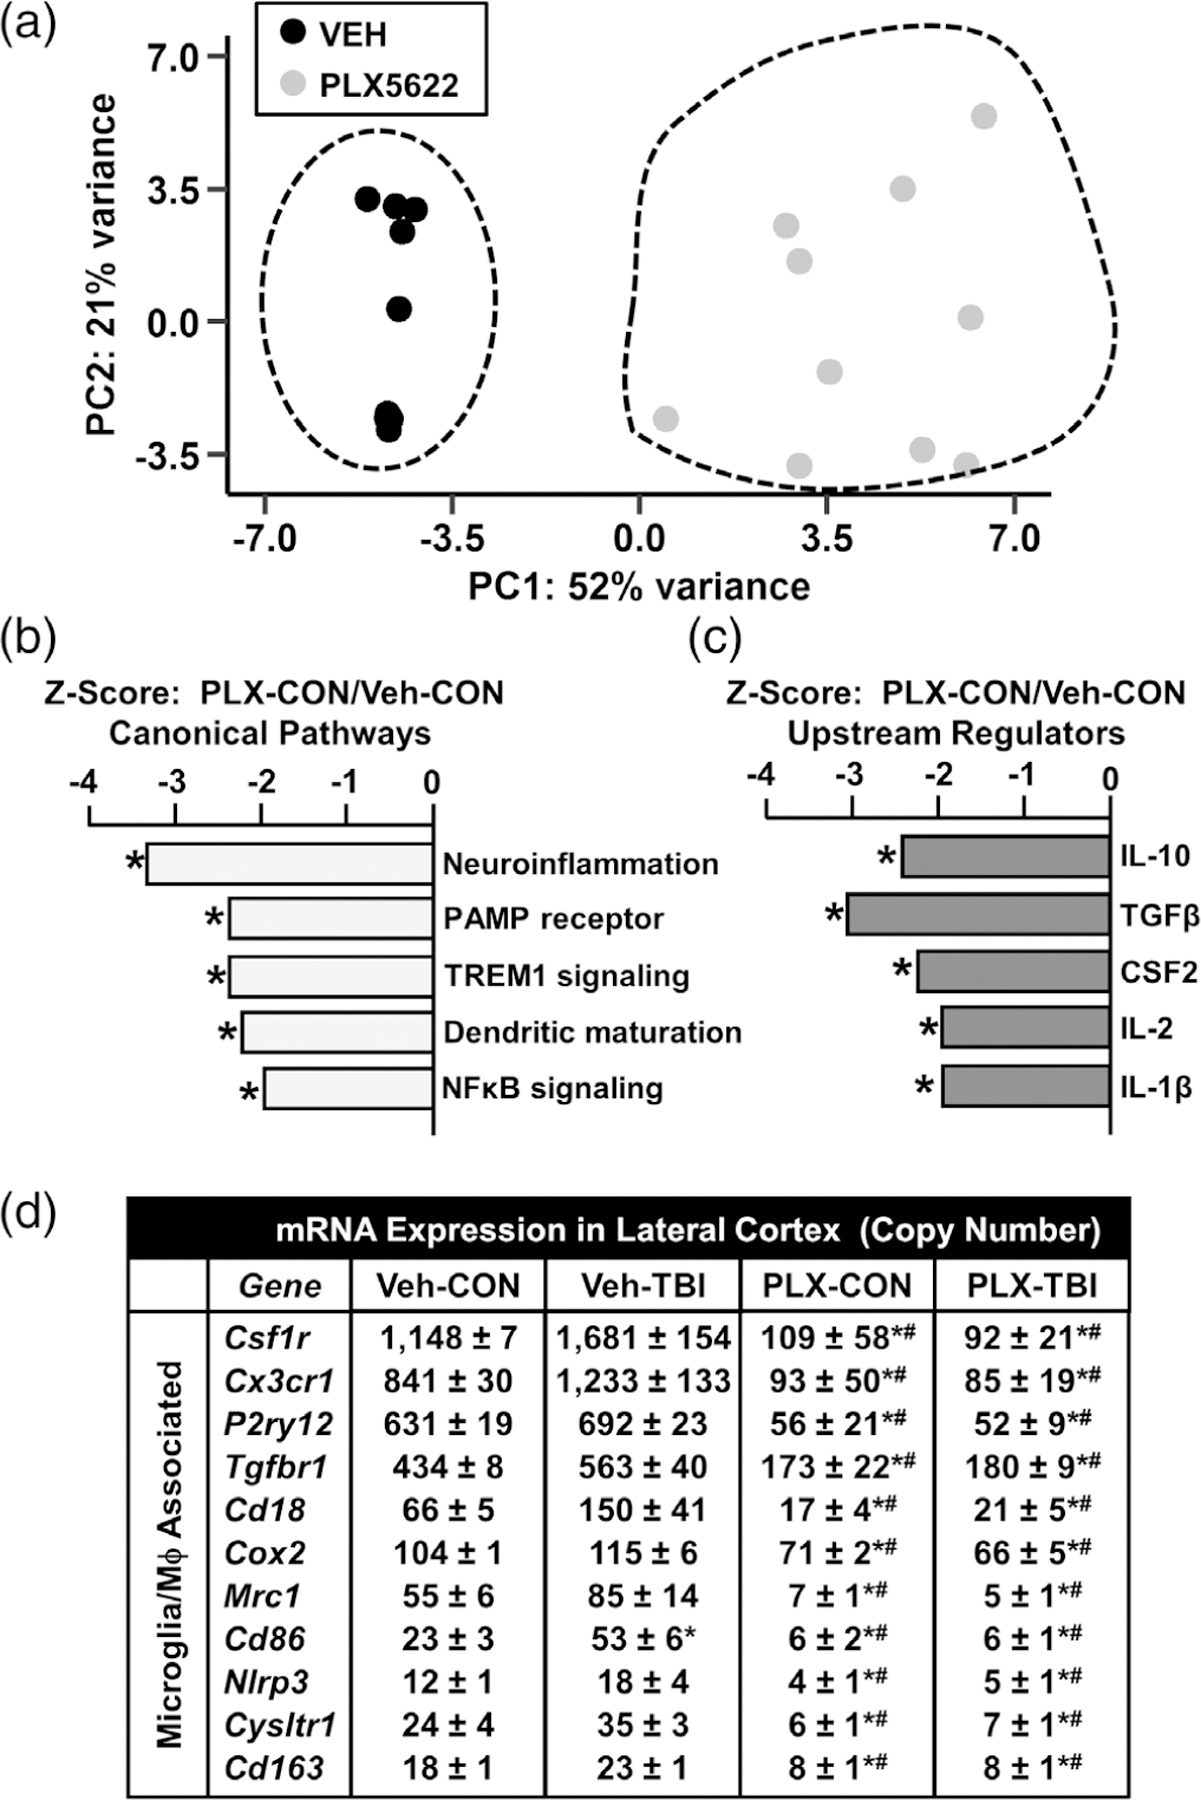
Distinct inflammatory signaling pathways were ablated in the lateral cortex by microglial elimination. As above, mice were provided diets formulated with either vehicle or PLX5622 for 14 days. Next, mice were sham-injured (control) or were subjected to midline fluid percussion injury (TBI). At either 8 hpi or 7 dpi (14–21 days of Veh or PLX diet), the cortex was dissected, flash-frozen, and RNA was extracted. mRNA copy number of 262 genes was determined by NanoString nCounter mouse inflammation v2 panel plus. (a) Principle component analysis of control mice fed either vehicle or PLX5622. Ingenuity Pathway Analysis (IPA) was used to determine significantly altered (b) canonical pathways and (c) upstream regulators for differentially expressed genes in the PLX-CON versus Veh-CON comparison 7 dpi. Bars represent pathway z-score and (*) denotes p < .05. (d) mRNA counts for genes associated with microglia/macrophages from the cortex 7 dpi. Data are presented as mean copy number ± SEM. Means with (*) are significantly different from Veh-CON (p-adj < .05) and means with (#) are significantly different from Veh-TBI (p-adj < .05)
Last, Figure 11d shows the mRNA copy number of genes robustly affected by CSF1R-antagonism with PLX5622. As expected, mRNA of microglial “signature” genes including Csf1r, Cx3cr1, and P2ry12 were highly expressed in cortical samples. These genes, however, were not significantly increased 7 days after TBI compared to controls. Consistent with the elimination of microglia, these three signature genes were ablated by PLX5622 (p-adj < .05, for each). There were several more microglia and inflammatory-related genes (Tgfbr1, Cd18, Cd163, Mrc1, and Cox2) that were not increased 7 dpi, but were robustly reduced by PLX5622 (p-adj < .05). These data highlight that microglial elimination by PLX5622 causes a dramatic reduction in microglial and inflammatory gene expression.
3.11 |. TBI-induced increases in mRNA expression of inflammatory genes were attenuated by PLX5622
Here, we highlight the differentially expressed genes in the Veh-TBI versus Veh-CON and Veh-TBI versus PLX-TBI comparisons in the mRNA NanoString data set generated 7 dpi. These results are presented as volcano plots (−log10 p value vs log2 foldchange) in which genes with the lowest p values are labeled. Figure 12a shows the main effect of TBI 7 dpi compared to controls (Veh-CON), with red points indicating p-adj < .05. Notably, inflammatory gene expression is primarily increased following TBI. Figure 12b shows the effect of PLX within injury (Veh-TBI vs PLX-TBI). Red points indicate genes that were significantly regulated by TBI (Figure 12a) while blue points indicate genes downregulated by PLX at baseline. Both genes related to microglial signature (P2ry12, Csf1r, Tgfbr1; blue) and injury-related inflammation (Cd86, Cd45, Ccl5; red) are significantly reduced by microglial elimination in the context of TBI.
FIGURE 12.
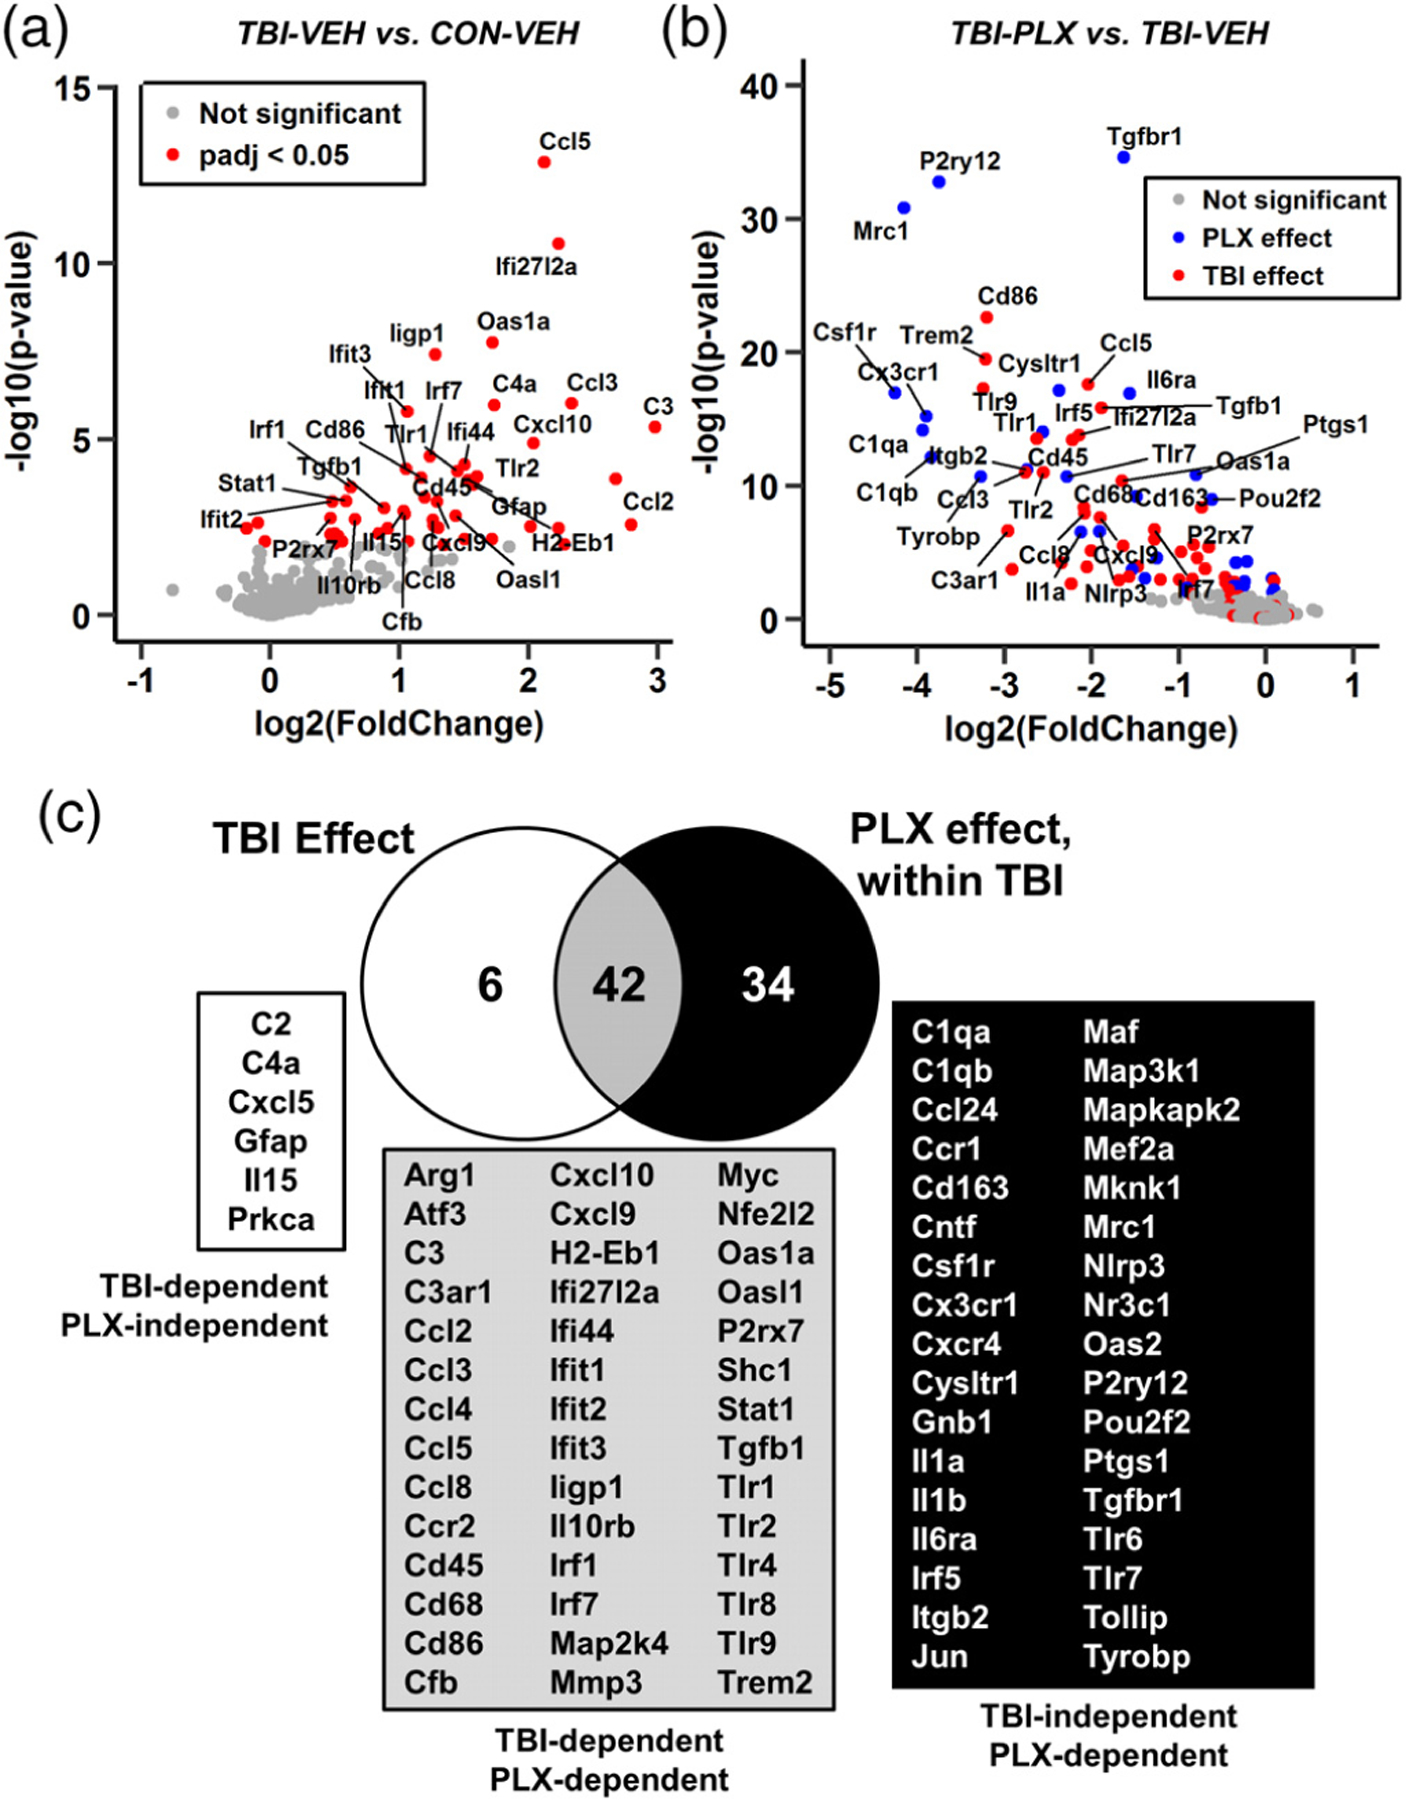
Inflammatory gene expression in the lateral cortex was influenced by TBI and PLX. Adult C57BL/6 mice were provided diets formulated with either vehicle or PLX5622 for 14 days. Next, mice were sham-injured (control) or were subjected to midline fluid percussion injury (TBI). At 7 dpi (21 days of Veh or PLX diet), the cortex was dissected, flash-frozen, and RNA was extracted. mRNA copy number of 262 genes was determined by NanoString nCounter mouse inflammation v2 panel (n = 4–8). a) Volcano plot of mRNA counts from Veh-TBI versus Veh-CON comparisons. Red points indicate genes with significant differential expression (p-adj < .05). (b) Volcano plot of mRNA counts from PLX-TBI versus Veh-TBI. Here, red points indicate genes increased by TBI (a) and blue points indicate other differentially expressed genes (p-adj < .05). (c) Venn diagram of differentially expressed genes in Veh-TBI versus Veh-CON and PLX-TBI versus Veh-TBI comparisons
The full lists of differentially expressed genes are reflected in the Venn diagram in Figure 12c, with the left circle reflecting genes from Veh-TBI versus Veh-CON and the right circle reflecting genes from PLX-TBI versus Veh-TBI. For example, there were 6 genes that were increased in the cortex 7 days after TBI that were unaffected by PLX5622. There were, however, 42 genes altered 7 dpi that were reduced by the elimination of microglia (p-adj < .05). Last, there were 34 genes reduced by PLX that were not significantly increased by TBI. Thus, 48 genes were significantly increased in the lateral cortex 7 dpi and 42 of these genes were microglia-dependent.
The mRNA counts of genes associated with microglia, chemokines/cytokines, repair, complement, and interferon signaling are shown in Figure 13. These genes are represented in the Venn diagram (Figure 12c) and significance is denoted based on adjusted p value. Consistent with the pathway analysis (Figure 10), there are myriad inflammatory-related genes that remain elevated 7 days after TBI in the lateral cortex. For example, microglia/macrophage-associated genes: Cd68, Trem2, CD45 (Ptprc), P2rx7, MHCII (H2-Eb1), and Tlr4 were increased in the lateral cortex 7 days after TBI compared to controls (p-adj < .05). Moreover, expression levels of these genes in the cortex 7 dpi were robustly reduced by microglial elimination (p-adj < .05, for each). It was also clear that expression of cytokines/chemokines were very low at baseline (<15 counts). Several cytokines and chemokines (Il15, Ccl2, Ccl5, Cxcl10) were increased in the lateral cortex 7 dpi and were attenuated by PLX (p-adj < .05 each). Notably, Cxcl5 and Il15 were increased 7 dpi, but were not significantly attenuated by PLX. A similar TBI-associated increase and reduction by PLX was apparent in multiple complement components (C1qa, C1qb, C3, C3ar1, Cfb) and interferon-responsive genes (Ifit3, Ifit2, Ifi27l2a, Irf1, Irf7, Oas1a). Several injury and repair-related genes were also increased in the lateral cortex 7 dpi and dependent on PLX intervention (Arg1, Il10rb, Tgfb1, Mmp3, Atf3). In conclusion, there was persistent inflammation in the cortex 7 dpi, which was associated with increased complement, cytokines, chemokines, and interferon signaling. The majority of the immune and inflammatory responses that persisted 7 dpi were attenuated in mice without microglia.
FIGURE 13.
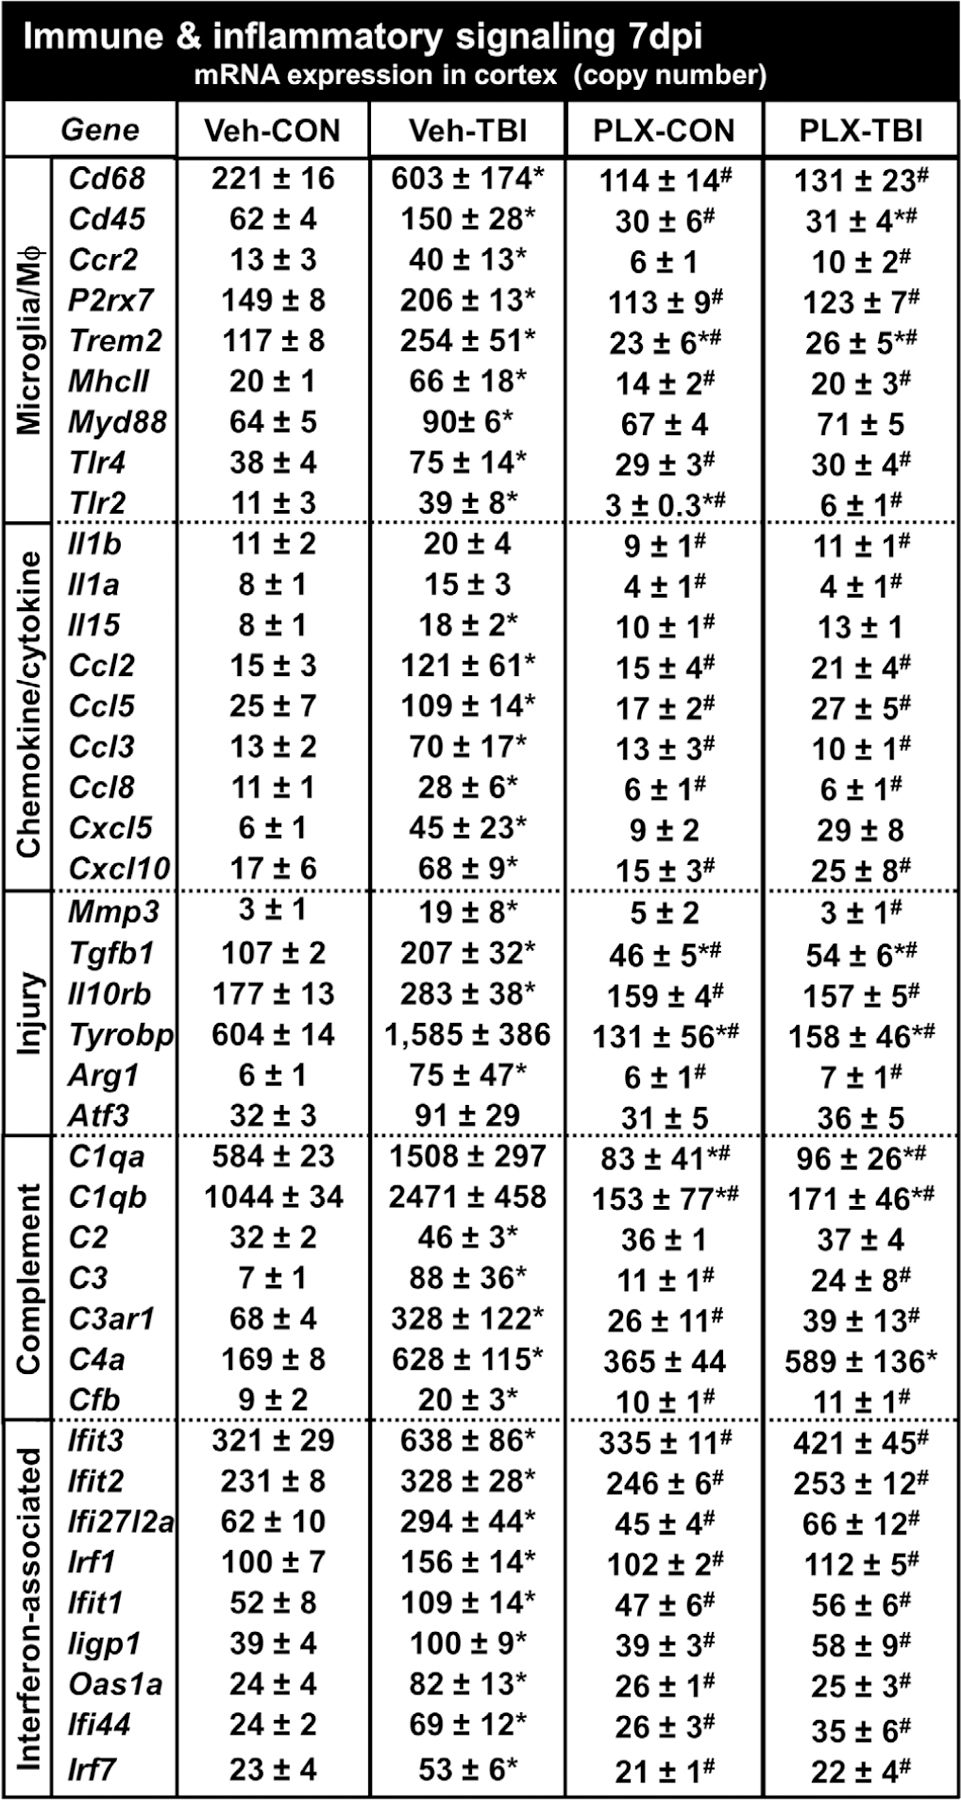
Prolonged neuroinflammation after TBI (7 dpi) was abrogated by microglial elimination. As above, mice were provided diets formulated with either vehicle or PLX5622 for 14 days and were sham-injured (control) or were subjected to midline fluid percussion injury (TBI). At 7 dpi (21d of Veh or PLX diet), the cortex was dissected, flash-frozen, and RNA was extracted. mRNA copy number of 262 genes was determined by NanoString nCounter mouse inflammation v2 panel plus (n = 4–8). Genes associated with microglia, chemokines/cytokines, injury, complement, or interferon are represented. Data are presented as average copy number ± SEM. Means with (*) are different from Veh-CON (p-adj < .05) and means with means with (#) are significantly different from Veh-TBI (p-adj < .05)
4 |. DISCUSSION
The purpose of this study was to further characterize rod microglia and the inflammatory cortical microenvironment after diffuse TBI to better assess the role of microglia in cortical neuropathology. Here, we build on existing data to show that rod microglia originate from resident microglia and form with limited proliferation. In addition, we provide supporting evidence that TBI-induced rod microglial formation in the cortex was in close proximity to axotomized (ATF3+) pyramidal neurons. For the first time, we showed that rod microglia aligned with apical dendrites of pyramidal neurons within the somatosensory cortex. Elimination of 96% of CNS microglia by CSF1R antagonism prior to TBI ablated rod microglial formation, astrogliosis, and prolonged neuroinflammation in the cortex. NanoString analysis of 262 genes showed stark immune activation and inflammation in the lateral cortex where rod microglia are present 7 dpi. This prolonged neuroinflammatory signature differs from the acute cytokine and chemokine response observed 8 hpi. Prolonged cortical inflammation was dependent on resident microglia and was ablated by PLX-mediated microglial elimination. Taken together, these findings indicate that resident microglia responded directly to neuronal injury, augmented neuroinflammatory signaling, and promoted astrogliosis following injury.
An advancement of this work is that we extend the initial characterization of rod microglia. Previous work established the presence of rod microglia within the lateral cortex after diffuse brain injury (Taylor et al., 2014; Ziebell et al., 2012). This anatomical location is selectively vulnerable to midline fluid percussion injury. For instance, the fluid pulse pushes the brain ventrally and it rebounds into the lateral curvature of the skull. This area of cortical injury is where rod microglia are detected after diffuse TBI and where layer V pyramidal axons are sheared following impact (Greer et al., 2011). We also show that resident microglia present at the time of injury were the primary source of rod microglia, rather than bone-marrow derived monocyte/macrophages. Notably, CD45 mRNA and protein were increased 7 dpi. CD45 is highly expressed by leukocytes and is commonly used as an indicator of leukocyte infiltration to the brain (Mattugini et al., 2018). While we did observe occasional monocyte infiltration after diffuse TBI, much of the CD45 protein was expressed by hypertrophied microglia ventral to rod microglial trains. GFP-BM chimera confirmed that this resulted from increased CD45 expression in microglia, rather than differentiation of infiltrating monocytes into parenchymal macrophages. This finding is significant because monocyte-derived macrophages differ from microglia in their neuroinflammatory profile (Cronk et al., 2018; McKim et al., 2017; Prinz & Priller, 2014) and microglia have CNS-specific and conserved responses to neuronal injury and neurodegeneration (Hong et al., 2016; Krasemann et al., 2017). It is also important to highlight that rod microglia formed with limited proliferation. This is in contrast to other contexts, such as retinal rod microglia following optic nerve crush, where rod microglia result from proliferation (Yuan et al., 2015). Collectively, these data show that rod microglia develop from resident microglia that were present at the time of injury and underwent structural transformation in response to neuronal injury.
Another important finding was that activation of diverse immune and inflammatory pathways persisted in the lateral cortex 7 dpi. This region was associated with dense rod microglial formation and astrogliosis (GFAP immunoreactivity). There was a significant correlation between extent of cortical astrogliosis and rod microglial formation. In fact, cortical images with 15 or more rod microglia accounted for the TBI-induced increase in GFAP labeling. Moreover, cortical regions with few rod microglia, even after TBI, expressed baseline levels of GFAP. This is interpreted to indicate a close spatial relationship between rod microglial formation and astrogliosis. Astrocytes and microglia dynamically communicate via cytokines and cell-surface markers in the context of traumatic CNS injury and aging (Norden, Fenn, Dugan, & Godbout, 2014; Villacampa et al., 2015). To determine cytokine and immune-signaling, we used NanoString mRNA profiling and confirmed that these morphological alterations were associated with robust and persistent increases in immune/inflammatory gene expression. Of note, the prolonged response to TBI differed from the acute inflammatory response 8 hpi and encompassed genes related to the interferon response, complement signaling, toll-like receptor signaling, antigen presentation, and phagocytosis. Upstream regulator analysis of the gene expression changes after TBI showed robust increase of genes associated with cytokine signaling pathways 7 dpi (IFNγ, IL-1β, IL-6, and TNF). It is important to note that gene-level analyses were corrected for multiple comparisons; therefore additional genes may be biologically meaningful despite failing statistical significance (e.g., Il1β, C1qa, C1qb). Nonetheless, these genes are in upregulated families, including cytokine-signaling and complement-signaling, which show increased expression into the subacute phase after TBI. Persistent immune-reactivity in the cortex has been previously reported to occur months after TBI in the cortex (Fenn et al., 2014; Muccigrosso et al., 2016). Notably, MHCII, an antigen presentation protein associated with microglial priming, is increased at the mRNA level 7 dpi and was previously reported to be expressed by rod microglia in the cortex (Ziebell et al., 2012). Taken together, these findings suggest that the presence of rod microglia reflect a transition to a more chronic phase of microglial reactivity in the cortex.
Another notable finding was that microglial elimination with PLX5622 prior to TBI limited the formation of rod microglia and attenuated astrogliosis in the somatosensory cortex 7 dpi. Of note, the stimulus to form rod microglia was robust after injury, and the few microglia that remain (4% of total) still formed rod microglia. Nonetheless, there was a significant overall reduction in rod microglia after TBI with PLX intervention. Microglial elimination did not affect axotomy, indicating that neuronal injury was caused by the mechanical force of the midline FPI and was microglia-independent. Notably, TBI-induced GFAP+ astrogliosis in the cortex was attenuated by PLX. It is important to highlight that there was increased astrocyte expansion with PLX alone (Elmore et al., 2014). We interpret this to suggest that astrocyte reactivity in the cortex was a response to microglia, perhaps selectively to rod microglia or to adjacent hypertrophied microglia. This is consistent with recent findings that astrocytes respond to activated microglia. Liddelow et al. (2017) determined that microglial production of IL-1α, TNFα, and C1q caused astrocytes to take on an inflammatory profile that was associated with increased neuronal death both in vitro and in vivo. Consistent with these previous data, our findings show that TBI-associated increases in IL-1α and C1q were prevented by PLX administration. Thus, microglial activation after injury drives increased GFAP expression in cortical astrocytes.
Our assessments here focused on the effect of PLX on rod microglial physiology and their cortical microenvironment. Notably, even with robust reductions in cortical inflammatory signaling and astrocyte reactivity, we did not detect any functional improvement between Veh-TBI and PLX-TBI in postinjury assessments of body mass, grooming behavior, or rotarod performance up to 7 dpi (data not shown). Nonetheless, these are only a few measures of immediate recovery within a limited time frame. In rats, regions where rod microglia form are implicated in late-onset changes in sensory sensitivity to whisker stimulation (McNamara, Lisembee, & Lifshitz, 2010). Thus, microglial elimination may impact sensory behaviors 7 dpi. Furthermore, somatosensory or motor deficits may progress over the weeks or months after injury; it is unclear if there will be long-term effects on these behaviors following microglial elimination. Related to this point, there was a clear heterogeneity of microglial structural responses and neuronal association evident in the Thy1-YFP reporter mice after TBI; microglial physiology is likely to be similarly heterogeneous. For instance, some microglia may be protective and augment recovery while others may be maladaptively responsive to injury. Future studies will aim to elucidate whether microglial structural heterogeneity corresponds with microglial transcriptional and functional diversity. This heterogeneity may also confound the behavioral response to TBI following PLX administration. Nonetheless, mRNA expression within the cortex 7 dpi showed profound increases in diverse inflammatory signaling pathways, all of which were microglia-dependent. While these inflammatory responses at 7 dpi may represent reparative microglial functions after injury, the progression into primed microglia 30 dpi is maladaptive (Fenn et al., 2014; Muccigrosso et al., 2016). Further assessments at chronic points with and without microglia, or with postinjury repopulation (Rice et al., 2017), are needed to determine the long-term impact of microglia-mediated inflammation following injury.
A final discussion point is that the mechanical forces of midline fluid percussion injury resulted in neuronal axotomy in the somatosensory cortex 7 dpi and were independent of microglia. The interpretation is that microglia respond to initial axonal injury and undergo significant morphological restructuring and alignment alterations. Here, we only assess rod microglia at their apex, 7 dpi, when they are aligned with apical dendrites of pyramidal neurons in the somatosensory cortex. It is unclear if this structural alignment represents a functional interaction, trophic relationship, or is an artifact of cortical structure. Due to the conserved structural and etiological phenotype of rod microglia (Bachstetter et al., 2017; Sierra et al., 2016; Ziebell et al., 2012), one can speculate that this response is intrinsically neuroprotective. Nonetheless, rod microglia exist within a highly inflammatory cortical microenvironment, with dense astrogliosis and increased immune/inflammatory signaling mediators. Although both microglia and astrocytes have been implicated in increased postinjury inflammatory signaling, our studies with PLX5622 indicate that microglia mediate the diverse and prolonged immune/inflammatory signaling after TBI. Astrocytes are clearly responding to these signals (e.g., astrogliosis), but their corresponding mRNA profile does not appear to be immune-related. Undoubtedly, the astrocyte profile in the cortex is important and needs to be further evaluated. Overall, the response of the rod microglia may be selectively neuroprotective, but they develop and persist within a cortical environment dominated by an inflammatory-related immune response and astrogliosis.
In summary, we provide novel data that microglia respond directly to neuronal injury following diffuse TBI and align closely with apical dendrites of pyramidal neurons. Furthermore, microglia augment astrocyte activation and mediate persistent neuroinflammation in the cortex in the subacute phase after diffuse TBI.
ACKNOWLEDGMENTS
This research was supported by an NINDS R56-NS-090311 (to JPG), a College of Medicine Dean’s Discovery Grant (to JPG), funding from the OSU Center for Brain and Spinal Cord Repair (to JPG), and an American Surgical Society Fellowship (to DSE). In addition, this work was supported by a P30 Core grant (NINDS P30-NS-045758). KGW was supported by a National Institute of Dental and Craniofacial Research Training Grant (T32-DE-01-4320) and PGP was supported by the Ray W. Poppleton Endowment. The authors thank Dr Brian West at Plexxikon Inc. for the use of PLX5622, Dr Paolo Fadda at the OSUCCC Genomics Shared Resource, and the Chronic Brain Injury Discovery Themes Initiative at Ohio State University.
Funding information
Ray W. Poppleton Endowment; National Institute of Dental and Craniofacial Research Training, Grant/Award Number: T32-DE-01-4320; National Institute of Neurological Disease and Stroke, Grant/Award Number: P30-NS-04758; American Surgical Society Fellowship; OSU Center for Brain and Spinal Cord Repair; College of Medicine Dean’s Discovery; NINDS, Grant/Award Number: R56-NS-090311
Footnotes
The authors declare no competing financial interests.
REFERENCES
- Alway Y, Gould KR, Johnston L, McKenzie D, & Ponsford J (2016). A prospective examination of Axis I psychiatric disorders in the first 5 years following moderate to severe traumatic brain injury. Psychological Medicine, 46(6), 1331–1341. 10.1017/S0033291715002986 [DOI] [PubMed] [Google Scholar]
- Bachstetter AD, Ighodaro ET, Hassoun Y, Aldeiri D, Neltner JH, Patel E, … Nelson PT (2017). Rod-shaped microglia morphology is associated with aging in 2 human autopsy series. Neurobiology of Aging, 52, 98–105. 10.1016/j.neurobiolaging.2016.12.028 [DOI] [PMC free article] [PubMed] [Google Scholar]
- Bachstetter AD, Rowe RK, Kaneko M, Goulding D, Lifshitz J, & Van Eldik LJ (2013). The p38alpha MAPK regulates microglial responsiveness to diffuse traumatic brain injury. The Journal of Neuroscience, 33(14), 6143–6153. 10.1523/JNEUROSCI.5399-12.2013 [DOI] [PMC free article] [PubMed] [Google Scholar]
- Cherry JD, Tripodis Y, Alvarez VE, Huber B, Kiernan PT, Daneshvar DH, … Stein TD (2016). Microglial neuroinflammation contributes to tau accumulation in chronic traumatic encephalopathy. Acta Neuropathologica Communications, 4(1), 112 10.1186/s40478-016-0382-8 [DOI] [PMC free article] [PubMed] [Google Scholar]
- Coughlin JM, Wang Y, Minn I, Bienko N, Ambinder EB, Xu X, … Pomper MG (2016). Imaging of glial cell activation and white matter integrity of brains of active and recently retired National Football League players. JAMA Neurology, 74(1), 67–74. [DOI] [PMC free article] [PubMed] [Google Scholar]
- Crane PK, Gibbons LE, Dams-O’Connor K, Trittschuh E, Leverenz JB, Keene CD, … Larson EB (2016). Association of traumatic brain injury with late-life neurodegenerative conditions and neuropathologic findings. JAMA Neurology, 73(9), 1062–1069. 10.1001/jamaneurol.2016.1948 [DOI] [PMC free article] [PubMed] [Google Scholar]
- Cronk JC, Filiano AJ, Louveau A, Marin I, Marsh R, Ji E, … Kipnis J (2018). Peripherally derived macrophages can engraft the brain independent of irradiation and maintain an identity distinct from microglia. The Journal of Experimental Medicine, 215, 1627–1647. 10.1084/jem.20180247 [DOI] [PMC free article] [PubMed] [Google Scholar]
- Elmore MR, Najafi AR, Koike MA, Dagher NN, Spangenberg EE, Rice RA, … Green KN (2014). Colony-stimulating factor 1 receptor signaling is necessary for microglia viability, unmasking a microglia progenitor cell in the adult brain. Neuron, 82(2), 380–397. 10.1016/j.neuron.2014.02.040 [DOI] [PMC free article] [PubMed] [Google Scholar]
- Faul M, Xu L, Wald MM, & Coronado VG (2010). Traumatic brain injury in the United States: Emergency department visits, hospitalizations and deaths 2002–2006. Retrieved from Atlanta, GA. [Google Scholar]
- Feng G, Mellor RH, Bernstein M, Keller-Peck C, Nguyen QT, Wallace M, … Sanes JR (2000). Imaging neuronal subsets in transgenic mice expressing multiple spectral variants of GFP. Neuron, 28(1), 41–51. [DOI] [PubMed] [Google Scholar]
- Fenn AM, Gensel JC, Huang Y, Popovich PG, Lifshitz J, & Godbout JP (2014). Immune activation promotes depression 1 month after diffuse brain injury: A role for primed microglia. Biological Psychiatry, 76(7), 575–584. 10.1016/j.biopsych.2013.10.014 [DOI] [PMC free article] [PubMed] [Google Scholar]
- Fenn AM, Skendelas JP, Moussa DN, Muccigrosso MM, Popovich PG, Lifshitz J, … Godbout JP (2015). Methylene blue attenuates traumatic brain injury-associated neuroinflammation and acute depressive-like behavior in mice. Journal of Neurotrauma, 32(2), 127–138. 10.1089/neu.2014.3514 [DOI] [PMC free article] [PubMed] [Google Scholar]
- Greer JE, Hanell A, McGinn MJ, & Povlishock JT (2013). Mild traumatic brain injury in the mouse induces axotomy primarily within the axon initial segment. Acta Neuropathologica, 126(1), 59–74. 10.1007/s00401-013-1119-4 [DOI] [PMC free article] [PubMed] [Google Scholar]
- Greer JE, McGinn MJ, & Povlishock JT (2011). Diffuse traumatic axonal injury in the mouse induces atrophy, c-Jun activation, and axonal outgrowth in the axotomized neuronal population. The Journal of Neuroscience, 31(13), 5089–5105. 10.1523/JNEUROSCI.5103-10.2011 [DOI] [PMC free article] [PubMed] [Google Scholar]
- Greer JE, Povlishock JT, & Jacobs KM (2012). Electrophysiological abnormalities in both axotomized and nonaxotomized pyramidal neurons following mild traumatic brain injury. The Journal of Neuroscience, 32(19), 6682–6687. 10.1523/JNEUROSCI.0881-12.2012 [DOI] [PMC free article] [PubMed] [Google Scholar]
- Hong S, Beja-Glasser VF, Nfonoyim BM, Frouin A, Li S, Ramakrishnan S, … Stevens B (2016). Complement and microglia mediate early synapse loss in Alzheimer mouse models. Science, 352(6286), 712–716. 10.1126/science.aad8373 [DOI] [PMC free article] [PubMed] [Google Scholar]
- Hong YT, Veenith T, Dewar D, Outtrim JG, Mani V, Williams C, …Menon DK (2014). Amyloid imaging with carbon 11-labeled Pittsburgh compound B for traumatic brain injury. JAMA Neurology, 71(1), 23–31. 10.1001/jamaneurol.2013.4847 [DOI] [PMC free article] [PubMed] [Google Scholar]
- Ji P, Schachtschneider KM, Schook LB, Walker FR, & Johnson RW (2016). Peripheral viral infection induced microglial sensome genes and enhanced microglial cell activity in the hippocampus of neonatal piglets. Brain, Behavior, and Immunity, 54, 243–251. 10.1016/j.bbi.2016.02.010 [DOI] [PMC free article] [PubMed] [Google Scholar]
- Kelley BJ, Farkas O, Lifshitz J, & Povlishock JT (2006). Traumatic axonal injury in the perisomatic domain triggers ultrarapid secondary axotomy and Wallerian degeneration. Experimental Neurology, 198(2), 350–360. 10.1016/j.expneurol.2005.12.017 [DOI] [PubMed] [Google Scholar]
- Kelley BJ, Lifshitz J, & Povlishock JT (2007). Neuroinflammatory responses after experimental diffuse traumatic brain injury. Journal of Neuropathology and Experimental Neurology, 66(11), 989–1001. 10.1097/NEN.0b013e3181588245 [DOI] [PubMed] [Google Scholar]
- Kramer A, Green J, Pollard J, & Tugendreich S (2014). Causal analysis approaches in ingenuity pathway analysis. Bioinformatics, 30(4), 523–530. 10.1093/bioinformatics/btt703 [DOI] [PMC free article] [PubMed] [Google Scholar]
- Krasemann S, Madore C, Cialic R, Baufeld C, Calcagno N, El Fatimy R, … Butovsky O (2017). The TREM2-APOE pathway drives the transcriptional phenotype of dysfunctional microglia in neurodegenerative diseases. Immunity, 47(3), 566–581 e569. doi: 10.1016/j.immuni.2017.08.008 [DOI] [PMC free article] [PubMed] [Google Scholar]
- Lafrenaye AD, Todani M, Walker SA, & Povlishock JT (2015). Microglia processes associate with diffusely injured axons following mild traumatic brain injury in the micro pig. Journal of Neuroinflammation, 12, 186 10.1186/s12974-015-0405-6 [DOI] [PMC free article] [PubMed] [Google Scholar]
- Lee Y, Messing A, Su M, & Brenner M (2008). GFAP promoter elements required for region-specific and astrocyte-specific expression. Glia, 56(5), 481–493. 10.1002/glia.20622 [DOI] [PubMed] [Google Scholar]
- Liddelow SA, Guttenplan KA, Clarke LE, Bennett FC, Bohlen CJ, Schirmer L, … Barres BA (2017). Neurotoxic reactive astrocytes are induced by activated microglia. Nature, 541(7638), 481–487. 10.1038/nature21029 [DOI] [PMC free article] [PubMed] [Google Scholar]
- Lifshitz J, Kelley BJ, & Povlishock JT (2007a). Perisomatic thalamic axotomy after diffuse traumatic brain injury is associated with atrophy rather than cell death. Journal of Neuropathology and Experimental Neurology, 66(3), 218–229. 10.1097/01.jnen.0000248558.75950.4d [DOI] [PubMed] [Google Scholar]
- Lifshitz J, & Lisembee AM (2012). Neurodegeneration in the somatosensory cortex after experimental diffuse brain injury. Brain Structure & Function, 217(1), 49–61. 10.1007/s00429-011-0323-z [DOI] [PMC free article] [PubMed] [Google Scholar]
- Lifshitz J, Rowe RK, Griffiths DR, Evilsizor MN, Thomas TC, Adelson PD, & McIntosh TK (2016). Clinical relevance of midline fluid percussion brain injury: Acute deficits, chronic morbidities and the utility of biomarkers. Brain Injury, 30(11), 1293–1301. 10.1080/02699052.2016.1193628 [DOI] [PMC free article] [PubMed] [Google Scholar]
- Lifshitz J, Witgen B, & Grady M (2007b). Acute cognitive impairment after lateral fluid percussion brain injury recovers by 1 month: Evaluation by conditioned fear response. Behavioural Brain Research, 177(2), 347–357. [DOI] [PMC free article] [PubMed] [Google Scholar]
- Love MI, Huber W, & Anders S (2014). Moderated estimation of fold change and dispersion for RNA-seq data with DESeq2. Genome Biology, 15(12), 550 10.1186/s13059-014-0550-8 [DOI] [PMC free article] [PubMed] [Google Scholar]
- Mandyam CD, Harburg GC, & Eisch AJ (2007). Determination of key aspects of precursor cell proliferation, cell cycle length and kinetics in the adult mouse subgranular zone. Neuroscience, 146(1), 108–122. 10.1016/j.neuroscience.2006.12.064 [DOI] [PMC free article] [PubMed] [Google Scholar]
- Mattugini N, Merl-Pham J, Petrozziello E, Schindler L, Bernhagen J, Hauck SM, & Gotz M (2018). Influence of white matter injury on gray matter reactive gliosis upon stab wound in the adult murine cerebral cortex. Glia, 66, 1644–1662. 10.1002/glia.23329 [DOI] [PubMed] [Google Scholar]
- McKim DB, Weber MD, Niraula A, Sawicki CM, Liu X, Jarrett BL, … Godbout JP (2017). Microglial recruitment of IL-1beta-producing monocytes to brain endothelium causes stress-induced anxiety. Molecular Psychiatry, 23, 1421–1431. 10.1038/mp.2017.64 [DOI] [PMC free article] [PubMed] [Google Scholar]
- McNamara KC, Lisembee AM, & Lifshitz J (2010). The whisker nuisance task identifies a late-onset, persistent sensory sensitivity in diffuse brain-injured rats. Journal of Neurotrauma, 27(4), 695–706. 10.1089/neu.2009.1237 [DOI] [PMC free article] [PubMed] [Google Scholar]
- Morrison H, Young K, Qureshi M, Rowe RK, & Lifshitz J (2017). Quantitative microglia analyses reveal diverse morphologic responses in the rat cortex after diffuse brain injury. Scientific Reports, 7(1), 13211 10.1038/s41598-017-13581-z [DOI] [PMC free article] [PubMed] [Google Scholar]
- Muccigrosso MM, Ford J, Benner B, Moussa D, Burnsides C, Fenn AM, … Godbout JP (2016). Cognitive deficits develop 1 month after diffuse brain injury and are exaggerated by microglia-associated reactivity to peripheral immune challenge. Brain, Behavior, and Immunity, 54, 95–109. 10.1016/j.bbi.2016.01.009 [DOI] [PMC free article] [PubMed] [Google Scholar]
- Nimmerjahn A, Kirchhoff F, & Helmchen F (2005). Resting microglial cells are highly dynamic surveillants of brain parenchyma in vivo. Science, 308(5726), 1314–1318. 10.1126/science.1110647 [DOI] [PubMed] [Google Scholar]
- Norden DM, Fenn AM, Dugan A, & Godbout JP (2014). TGFbeta produced by IL-10 redirected astrocytes attenuates microglial activation. Glia, 62(6), 881–895. 10.1002/glia.22647 [DOI] [PMC free article] [PubMed] [Google Scholar]
- Prinz M, & Priller J (2014). Microglia and brain macrophages in the molecular age: From origin to neuropsychiatric disease. Nature Reviews. Neuroscience, 15(5), 300–312. 10.1038/nrn3722 [DOI] [PubMed] [Google Scholar]
- Ramlackhansingh AF, Brooks DJ, Greenwood RJ, Bose SK, Turkheimer FE, Kinnunen KM, … Sharp DJ (2011). Inflammation after trauma: Microglial activation and traumatic brain injury. Annals of Neurology, 70(3), 374–383. 10.1002/ana.22455 [DOI] [PubMed] [Google Scholar]
- Rice RA, Pham J, Lee RJ, Najafi AR, West BL, & Green KN (2017). Microglial repopulation resolves inflammation and promotes brain recovery after injury. Glia, 65(6), 931–944. 10.1002/glia.23135 [DOI] [PMC free article] [PubMed] [Google Scholar]
- Rice RA, Spangenberg EE, Yamate-Morgan H, Lee RJ, Arora RP, Hernandez MX, … Green KN (2015). Elimination of microglia improves functional outcomes following extensive neuronal loss in the hippocampus. The Journal of Neuroscience, 35(27), 9977–9989. 10.1523/JNEUROSCI.0336-15.2015 [DOI] [PMC free article] [PubMed] [Google Scholar]
- Rowe RK, Griffiths DR, & Lifshitz J (2016). Midline (central) fluid percussion model of traumatic brain injury. Methods in Molecular Biology, 1462, 211–230. 10.1007/978-1-4939-3816-2_13 [DOI] [PubMed] [Google Scholar]
- Selassie AW, Zaloshnja E, Langlois JA, Miller T, Jones P, & Steiner C (2008). Incidence of long-term disability following traumatic brain injury hospitalization, United States, 2003. The Journal of Head Trauma Rehabilitation, 23(2), 123–131. 10.1097/01.HTR.0000314531.30401.39 [DOI] [PubMed] [Google Scholar]
- Sierra A, de Castro F, Del Rio-Hortega J, Rafael Iglesias-Rozas J, Garrosa M, & Kettenmann H (2016). The “big-bang” for modern glial biology: Translation and comments on Pio del Rio-Hortega 1919 series of papers on microglia. Glia, 64(11), 1801–1840. 10.1002/glia.23046 [DOI] [PubMed] [Google Scholar]
- Taylor SE, Morganti-Kossmann C, Lifshitz J, & Ziebell JM (2014). Rod microglia: A morphological definition. PLoS One, 9(5), e97096 10.1371/journal.pone.0097096 [DOI] [PMC free article] [PubMed] [Google Scholar]
- Villacampa N, Almolda B, Vilella A, Campbell IL, Gonzalez B, & Castellano B (2015). Astrocyte-targeted production of IL-10 induces changes in microglial reactivity and reduces motor neuron death after facial nerve axotomy. Glia, 63(7), 1166–1184. 10.1002/glia.22807 [DOI] [PubMed] [Google Scholar]
- Whelan-Goodinson R, Ponsford J, Johnston L, & Grant F (2009). Psychiatric disorders following traumatic brain injury: Their nature and frequency. The Journal of Head Trauma Rehabilitation, 24(5), 324–332. 10.1097/HTR.0b013e3181a712aa [DOI] [PubMed] [Google Scholar]
- Wickham H (2009). Ggplot2: Elegant graphics for data analysis. New York: Springer. [Google Scholar]
- Witgen B, Lifshitz J, & Grady M (2006). Inbred mouse strains as a tool to analyze hippocampal neuronal loss after brain injury: A stereological study. Journal of Neurotrauma, 23(9), 1320–1329. [DOI] [PubMed] [Google Scholar]
- Wofford KL, Harris JP, Browne KD, Brown DP, Grovola MR, Mietus CJ, … Cullen DK (2017). Rapid neuroinflammatory response localized to injured neurons after diffuse traumatic brain injury in swine. Experimental Neurology, 290, 85–94. 10.1016/j.expneurol.2017.01.004 [DOI] [PMC free article] [PubMed] [Google Scholar]
- Wohleb ES, Powell ND, Godbout JP, & Sheridan JF (2013). Stress-induced recruitment of bone marrow-derived monocytes to the brain promotes anxiety-like behavior. The Journal of Neuroscience, 33(34), 13820–13833. [DOI] [PMC free article] [PubMed] [Google Scholar]
- Yuan TF, Liang YX, Peng B, Lin B, & So KF (2015). Local proliferation is the main source of rod microglia after optic nerve transection. Scientific Reports, 5, 10788 10.1038/srep10788 [DOI] [PMC free article] [PubMed] [Google Scholar]
- Ziebell JM, Taylor SE, Cao T, Harrison JL, & Lifshitz J (2012). Rod microglia: Elongation, alignment, and coupling to form trains across the somatosensory cortex after experimental diffuse brain injury. Journal of Neuroinflammation, 9, 247 10.1186/1742-2094-9-247 [DOI] [PMC free article] [PubMed] [Google Scholar]


