Abstract
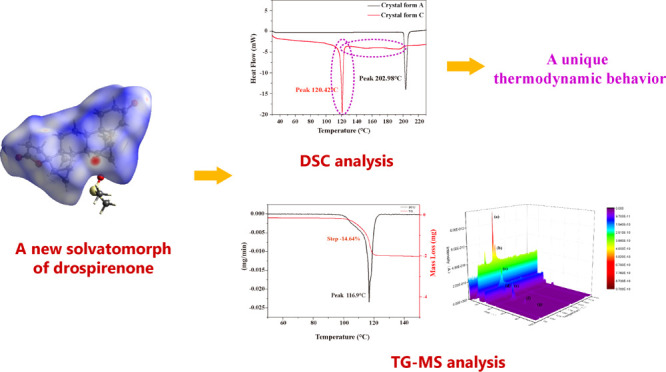
Drospirenone (DE) is a fourth-generation progesterone that has been widely used in oral contraceptives for women because of its safety and few side effects in terms of pharmacological activity. A new solvatomorph (crystal form C) of DE with dimethyl sulfoxide was identified and characterized for the first time through a thermogravimetry–mass spectrometry (TG–MS) coupling system. The thermodynamic property of the new solvatomorph of DE was different from those of most pharmaceutical solvatomorphs, and it was revealed via the skimmer-type interfaced TG–MS system and differential scanning calorimetry. This new solvatomorph and a polymorph of DE obtained without solvent (crystal form A) were well characterized by X-ray crystallography and vibrational spectroscopic analysis. Computational studies based on their single-crystal structures, such as Hirshfeld surface analyses, were used to determine the intermolecular interactions in the crystal network. The single-crystal structure of crystal form C of DE was determined and reported for the first time.
Introduction
Drospirenone [DE; 6β,7β:15β,16β-dimethylene-3-oxo-17α-pregn-4-ene-21,17-carbolactone], also known as dihydrospirorenone, drospirenona, and dehydrospirorenone, is an analogue of spironolactone, and its biochemical and pharmacologic profiles are similar to those of endogenous progesterone. The formula structure of DE is shown in Figure 1. As a fourth-generation progesterone, DE has been widely applied in contraception and hormone replacement therapy for women. DE can potentially reduce body weight and blood pressure in postmenopausal women and decrease the incidence of cardiovascular disease in women using oral contraceptives or postmenopausal hormone treatment. DE-containing oral contraceptive formulations have shown improvement and high tolerability as a treatment for premenstrual dysphoric disorder and have positive effects on bone turnover and bone sparing in young postadolescent women.1−5 The antiadipogenic effect of DE and its mechanism were studied previously,6 that also bring additional therapeutic options for the control of excessive adipose tissue deposition and its related metabolic complications.
Figure 1.
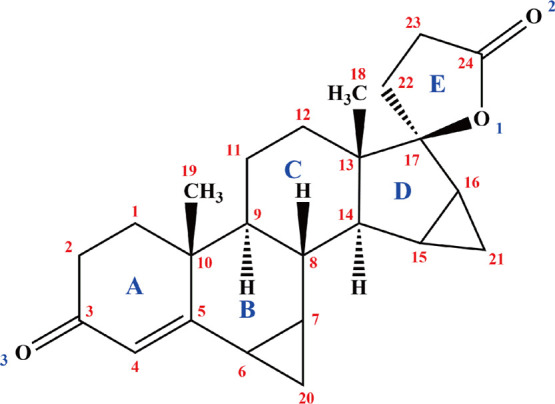
Formula structure of DE.
Two different solid states of DE, a polymorphism without solvents (crystal form A) and an amorphism (crystal form B), have been reported previously.7 However, the solvatomorphism phenomenon of DE has not been reported before. Solvatomorphism, also called pseudopolymorphism, is considered as crystal systems with different crystal structures of the same substance combined with various amounts or types of solvent molecules. Polymorphism is deemed as crystal systems of substances with different unit cells and with the same elemental composition.8 In general, crystal forms without solvents can be obtained after the desolvation process of solvatomorphs. Solvatomorphs are significant in crystal engineering and pharmaceutical science. For some active pharmaceutical ingredients (APIs), solvatomorphs are the only kind of crystalline forms available for use in single-crystal X-ray diffraction (SXRD) studies.9 Solvatomorphs could also be the ultimate pharmaceutical form for clinical use because of their advantages in improving the solubility or stability of APIs. For instance, Jevtana, an anticancer drug composed of cabazitaxel solvate with acetonate and developed by Sanofi-Aventis, was used for the treatment of prostate cancer.
Common pharmaceutical solid-state analytical techniques, including spectroscopy methods (powder X-ray diffraction or PXRD, SXRD, Fourier transform infrared or FT-IR, and Raman spectroscopy) and thermal analytical methods (differential scanning calorimetry or DSC and thermogravimetric analysis) are used to characterize various pharmaceutical solvatomorphs.10 However, except for SXRD analysis, other methods cannot provide accurate qualitative information of solvatomorphs. With the development of technology, some powerful coupling techniques have gradually shown excellent characteristics in the field of pharmaceutical analysis. Thermogravimetry–mass spectrometry (TG–MS) coupling analysis, as an advanced technique for analyzing evolved gases, has been widely applied in chemical engineering, energy industry, and thermophysics research to analyze the pyrolysis of the polymer, coal, and various inorganic substances,11−15 as well as in characterizing solvates.16−23 Detailed information about the thermodynamics reaction of samples during the measurement can be obtained by this system. In the present study, a crystal form of DE without solvent (crystal form A) and a new solvatomorph of DE (crystal form C) were obtained by designing a series of crystal growth experiments through single and multiple organic solvent systems based on DE solubility. This new solvatomorph contains DE and dimethyl sulfoxide (DMSO) with a 1:1 stoichiometric ratio. This work reported the preparation of this new solvatomorph and its TG–MS, DSC, X-ray structure analysis, computational study, PXRD, and vibrational spectroscopic analysis for the first time.
Experiment
Materials
The white powder of DE raw material was purchased from Wuhan Yuancheng Technology, Inc. (batch number: BEA201104211; Hubei, China) and used without further purification. The purity determined by high-performance liquid chromatography was greater than 0.990 mass fractions. All of the solvents used for crystallization were of analytical reagent grade and purchased from Beijing Chemical Works (Beijing, China).
Preparation of Samples
(Crystal form A) Approximately, 200 mg of DE raw material was added to 10 mL of ethanol. The solutions were stirred overnight at an ambient temperature and filtered to obtain clear and transparent solutions. The solutions were placed in a refrigerator for crystallization for approximately 10 days at 10 °C to obtain single crystals without solvents. Several small pieces of single crystals were ground to powder. The obtained powder was sifted by a 100-mesh sieve to meet the requirements of analysis.
(Crystal form C) For this solvatomorph of DE, the process basically follows the procedure for crystal form A, but the solvent in the first step was replaced by DMSO, and the solutions were placed for crystallization for approximately 30 days at 20 °C to obtain single crystals of solvatomorphs.
TG–MS
The TG–MS measurements were performed on a Thermo Mass Photo/H instrument (Rigaku, Tokyo, Japan). This skimmer sampling interfaced TG–MS system can successfully overcome the recrystallization problem of evolved gases from the pyrolysis of samples.24 Therefore, the recondensation problem of evolved gases from solvatomorph desolvation can be remarkably avoided. The onsite and real-time measurements for solvatomorphs can be achieved. Detailed information about this TG–MS system has been previously described.25−27
Evolved gases are ionized using the standard electron ionization (EI) method at 70 eV. Approximately 5–8 mg of the powder of crystal form C of DE was used for the TG–MS measurements. The sample was weighed in an alumina crucible and heated up to 300 °C with a controlled temperature program. The measurement was performed at a heating rate of 5 °C min–1 under high purity analytical grade dry helium (He) gas (99.999%) with a flow rate of 200 mL min–1.
DSC
DSC curves were recorded with a DSC 1 (Mettler Toledo, Switzerland) calorimeter and processed by the STARe Evaluation software 13.0. Approximately, 3–5 mg was placed on an aluminum crucible and heated at a series of constant rates of 10 °C min–1 over the temperature range of 30–230 °C under air ambience.
SXRD
SXRD experiments were carried out on a Rigaku MicroMax-002+ CCD diffractometer (Rigaku, Americas, the Woodlands, Texas) with Cu Kα radiation (wλ = 1.54178 Å). The intensity data of solvatomorphs were collected at 293 K. Absorption correction and integration of the collected data were handled using the CrystalClear software package (Rigaku Americas), and the crystal structures of the analytes were solved by the direct method followed by Fourier syntheses with SIR2008.28 They were refined by full-matrix least-squares procedures by using SHELXL29 on F2 with anisotropic displacement parameters for nonhydrogen atoms on the Olex2 crystallography software platform.30 Hydrogen atoms were refined isotropically with isotropic atomic displacement parameters (Uiso) having 1.2 times the value of the parent atom. The hydrogen atoms of methyl groups were assigned at 1.5 times that of the parent atom. Hydrogen atoms were placed in ideal positions and refined within the riding model. Disorders with restraints were refined to help data in convergence.31
PXRD Pattern
Simulated PXRD patterns were calculated using Mercury software (Version 2020.1, Cambridge Crystallographic Data Center, UK)32 with a starting angle of 3°, final angle of 80°, step size of 0.02°, and full width at half-maximum of 0.15°.
Hirshfeld Surface Analysis
Hirshfeld surface (HS) analysis was carried out using the CrystalExplorer 17 program33 to display HSs and intermolecular interactions in molecular crystals. The program accepts a structure input file in the CIF format.
Vibrational Spectroscopy Analysis
FT-IR Spectroscopy
Infrared spectra were recorded using a PerkinElmer Spectrum 400 FT-IR spectrophotometer (PerkinElmer, Massachusetts) with an attenuated total reflectance sampling accessory. The scanning range was set from 650 to 4000 cm–1 with a 4 cm–1 resolution. The spectra were recorded and processed using Spectrum software suite (PerkinElmer, US).
Raman Spectroscopy
The (22–25 °C) room temperature Raman spectra were recorded on a Jobin Yvon LabRam HR Evolution Raman spectrometer (HORIBA Scientific, France). The Raman effect was obtained using 785 nm line from a semiconductor laser. An Olympus BX41 confocal microscope with 100× objective for magnification was selected. The spectral resolution was set to 4 cm–1. A confocal hole of approximately 2 μm in diameter was used, and the position on the sample surface was adjusted using a motorized x–y stage to focus the laser beam. The Raman shift was calibrated using the Raman peak of silica located at 520.7 cm–1. The acquisition time and accumulation were set to 10 s and 2 scans, respectively.
Results and Discussion
TG–MS Analysis
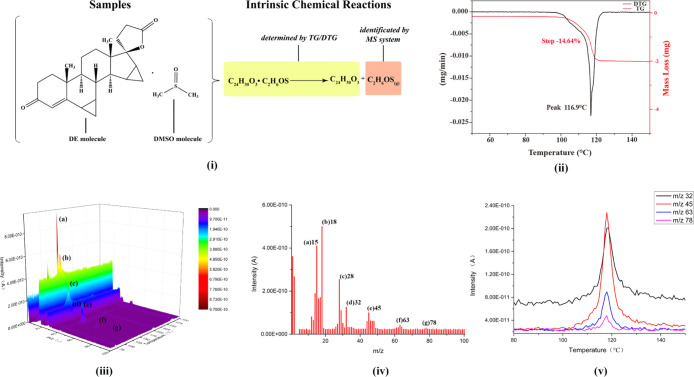
The mechanism of TG–MS for the solvatomorph of DE is exhibited in Figure 2(i). The peak temperature of differential thermogravimetry (DTG) was at 116.9 °C, where the mass-less rate is maximum in TG. This temperature (116.9 °C) is close to the temperature of the maximum mass spectrum signal intensity (115.4 °C). Figure 2(ii) shows the TG and DTG curves of crystal form C.
Figure 2.
Mechanism of TG–MS analysis for the solvatomorph of DE (i); TG and DTG curves of crystal form C (ii); mass spectrum of the evolved gases at 115.4 °C (iii); characteristic fingerprint of the mass spectrum of evolved gases from crystal form C (iv); mass ion curves of the four main characteristic fragment ions of DMSO (v).
The complete 3D mass spectrum characteristic fingerprint graph of evolved gases from crystal form C was obtained through TG–MS analysis (Figure 2(iii)). After deducting the helium background spectrum, every characteristic fragment peak of the evolved gas within the range of m/z 1–100 became visible. Furthermore, Figure 2(iv) shows the mass spectrum of the evolved gases at a temperature of 115.4 °C when the signal intensity of mass spectrum was the highest. After assigning the characteristic peaks, the main fragment ions were identified as (a) CH3+ (m/z 15), (b) H2O+ (m/z 18), (c) CO+ (m/z 28), (d) S+ (m/z 32), (e) CHS+ (m/z 45), (f) CH3SO+ (m/z 63), and (g) (CH3)2SO+ (m/z 78). The assignment of fragment ions in MS was fulfilled using the NIST library database.34 Every detected fragment ion was produced by the ionization of DMSO molecules at the EI method, except the fragment ion at m/z 18 (H2O+), which might be caused by the secondary reactions during desolvation. Figure 2(v) shows the mass ion curves of the four main characteristic fragment ions of DMSO, including [(d) S+ (m/z 32), (e) CHS+ (m/z 45), (f) CH3SO+ (m/z 63), and (g) (CH3)2SO+ (m/z 78)] during the measurements.
Therefore, the main ingredient of evolved gas from crystal form C was DMSO, and the mass-loss stage in the temperature range of 90–130 °C in the TG curve of crystal form C was caused by the evolution process of DMSO in crystal form C.
DSC Analysis
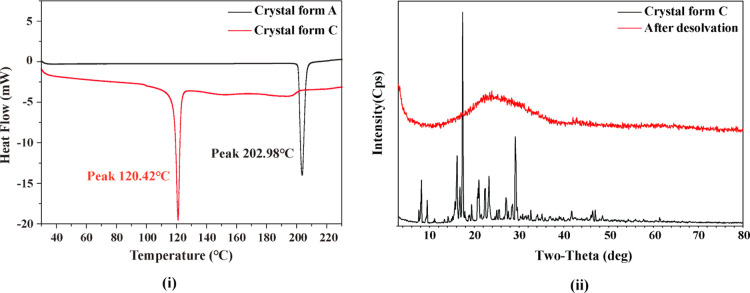
Figure 3(i) shows the DSC curves of crystal forms A and C of DE. There is a single sharp endothermic peak at approximately 120 °C in the DSC curve of crystal form C, whereas no other endothermic or exothermic peaks appeared in the DSC curve of crystal form C. The results indicated that the single endothermic peak at 120 °C in the DSC curve of crystal form C was caused by its desolvation behavior according to the temperature range of desolvation process of crystal form C determined by TG–MS before. Meanwhile, after the one single sharp endothermic peak, the DSC curve of crystal form C started to become less smooth and straight, and the sharp endothermic peak at approximately 203 °C (melting point of DE) in the DSC curve of crystal form A disappeared in the DSC curve of crystal form C. The solid state of crystal form C might transform from solvatomorphism to amorphous after desolvation during the measurements. To investigate the process of this transformation, the sample of crystal form C was analyzed before and after desolvation by the PXRD method. (The sample of crystal form C after desolvation was the sample at 180 °C during the DSC measurement). The PXRD patterns of the sample before and after desolvation are shown in Figure 3(ii). Results confirm that the solid-state transformation occurred before and after the desolvation process of crystal form C. This phenomenon is different from the thermodynamic properties of most pharmaceutical solvatomorphs.35−40 The DSC curve of pharmaceutical solvatomorphs usually possesses more than one endothermic peak. One or more relatively small and blunt endothermic peak at a low temperature is caused by desolvation, and one relatively sharp and large endothermic peak at high temperatures is caused by API melting.
Figure 3.
DSC curves of crystal form A and C (i); the PXRD patterns of crystal form C before and after desolvation (ii).
SXRD Analysis
The prism crystals of crystal forms A and C suitable for crystal structure determined by the SXRD experiment were obtained from their solutions by slow evaporation. The absolute structure of crystal form A could not be determined from diffraction data, but it was known from synthesis, and the absolute structure of crystal form C can be determined from the Flack’s parameter. The SXRD results suggested that crystal forms A and C are crystallized in the space group P212121. The molecules in crystal forms A and C were arranged loosely in a unit cell, resulting in relatively lower density values (approximately 1.2 g/cm3) than other pharmaceutical crystalline compounds. For the single crystal of crystal form C, the stoichiometric ratio between DE and DMSO molecules was 1:1 in an asymmetric unit. Classic hydrogen bonds were absent between DE and DMSO molecules. Weak hydrogen bonds via C9–H9···O1D existed between DE and DMSO molecules, which only formed feeble intermolecular interactions with relatively long D···A distances (3.281 Å) and small D–H···A angles (151°). Crystallographic data for crystal forms A and C were deposited at the Cambridge Crystallographic Data Centre (CCDC). The crystal parameters, data collections, and refinement details of the two single crystals are listed in Table 1.
Table 1. Crystallographic Data and Refinement Details for Two Crystal Forms of DE.
| parameters | crystal form A | crystal form C |
|---|---|---|
| empirical formula | C24H30O3 | C24H30O3·C2H6OS |
| molecule weight | 366.48 | 444.61 |
| crystal size (mm) | 0.24 × 0.31 × 0.67 | 0.19 × 0.35 × 0.40 |
| temperature (K) | 293(2) | 293(2) |
| crystal system | orthorhombic | orthorhombic |
| space group | P212121 | P212121 |
| a (Å) | 12.220(4) | 6.3541(3) |
| b (Å) | 12.600(5) | 11.5712(3) |
| c (Å) | 12.894(4) | 32.2251(4) |
| Z | 4 | 4 |
| volume (Å3) | 1985.2(11) | 2369.34(13) |
| calc density (g cm–3) | 1.226 | 1.246 |
| absorption coefficient (mm–1) | 0.622 | 1.443 |
| θ range for data collection (deg) | 4.907, 72.354 | 4.059, 72.115 |
| goodness-of-fit on F2 | 1.016 | 0.994 |
| Rint | 0.0432 | 0.0459 |
| final R, wR (F2) values [I > 2σ(I)] | 0.0355, 0.0946 | 0.0406, 0.1073 |
| final R, wR (F2) values (all) | 0.0398, 0.0987 | 0.0450, 0.1114 |
| completeness | 0.997 | 0.983 |
| CCDC deposition no. | 1994085 | 1994086 |
PXRD Pattern Analysis
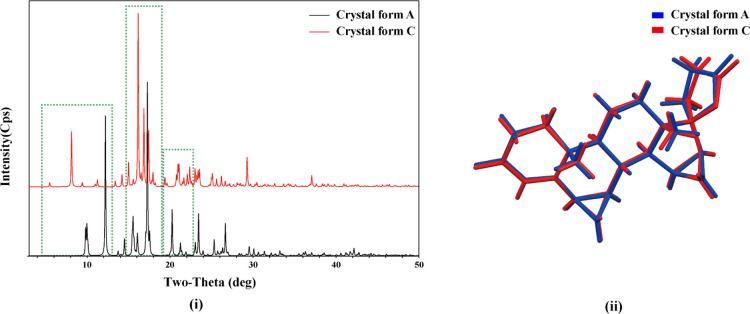
As a result of unique structures of different crystals, their calculated PXRD patterns are distinct. Therefore, their solvatomorphs and polymorphs can be identified through PXRD. The calculated PXRD patterns of crystal forms A and C are shown in Figure 4(i). The peak positions of their patterns in the green dashed frames are different, especially in the 2θ angle range of 5–13, 15–19, and 19–23°.
Figure 4.
Calculated PXRD patterns of crystal forms A and C of DE (i); the molecule overlay image of crystal forms A and C of DE (ii).
Conformational Analysis
For the DE molecule in the solvatomorph, six-membered rings (rings A and B) showed sofa conformations and five-membered rings (rings D and E) showed envelope conformations, whereas the six-membered ring (ring C) showed a chair conformation. The conformational differences were observed by overlaying the two DE molecules in these two different single-crystal structures, and their difference was not significant. Their molecule overlay image is shown in Figure 4(ii).
HS Analysis
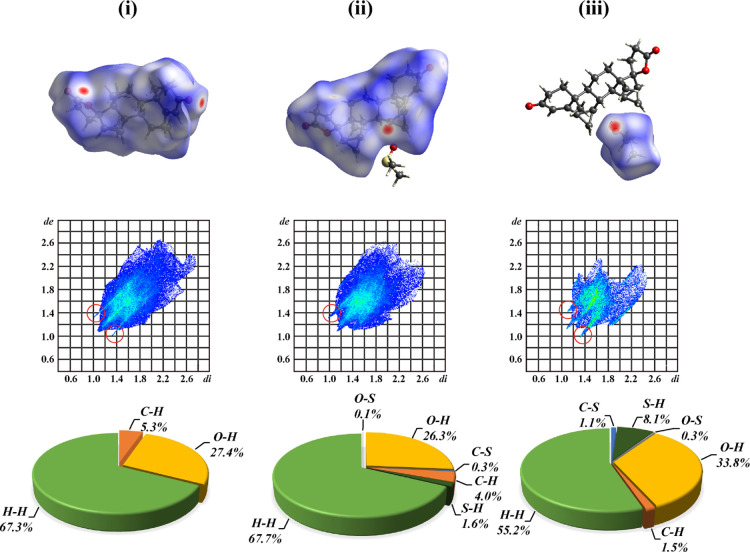
HS analysis and fingerprint plots are powerful and effective tools for explicating and comparing intermolecular interactions through molecule environment analysis from a different angle. HSs (mapped with dnorm), 2D fingerprint plots, and percentage contributions to the HSs area are shown in Figure 5, where (i) is for crystal form A, (ii) is for DE in crystal form C, and (iii) is for DMSO in crystal form C. The fingerprint plots summarized the information regarding intermolecular interactions, including the plot of di versus de, where di is the distance to the nearest atom center interior to the surface, de is the distance to the nearest atom center exterior to the surface, and dnorm is the normalized contact distance, which is based on de and di and the vdW radii of the atom. de and di reflect the distance from the surface to the nearest external and internal atoms, respectively. HSs provide a 3D image of close contacts in a crystal, and these contacts can be summarized in a fingerprint plot. Percentage contributions to the HS area for various close intermolecular contacts for molecules in crystal forms A and C are given using pie charts.
Figure 5.
HSs (mapped with dnorm), 2D fingerprint plots, and percentage contributions to the HSs area for DE molecules in crystal form A (i) and DE molecules (ii) and DMSO molecules (iii) in crystal form C.
A range of 0.7 Å (red) and 2.6 Å (blue) for surface mapping of de was used. The large circular depressions (deep red) visible on the surfaces of molecules indicated hydrogen bonding contacts. Figure 5 shows the distinct HS of DE molecules in crystal forms A and C. The location of hydrogen bonding contacts changed. Inside the red circles of 2D fingerprint plots (Figure 5 lower), the upper spike (de > di) corresponded to the hydrogen bond donor and the lower spike (de < di) indicated the hydrogen bond acceptor in each case. In general, the sharp spikes on both sides of each plots are due to the dimeric H···O hydrogen bonds. Two sharp spikes appeared in the DE molecule in crystal form A, which means that the DE molecule in crystal form A acted as a hydrogen bond donor and a hydrogen bond acceptor. However, only one upper spike (de < di) appeared in the DE molecules of crystal form C. So, the DE molecule acted only as a hydrogen bond donor in crystal form C. The fingerprint plot of the DMSO molecule showed two sharp spikes (de > di and de < di) because of the interactions of the H···O/O···H hydrogen bonds. Thus, the DMSO molecule in crystal form C acted as a hydrogen bond donor and a hydrogen bond acceptor.
SXRD analysis indicated that classical hydrogen bonds between DE molecules and DMSO molecules in crystal form C were absent, and only weak hydrogen bonds via C9–H9···O1D existed between them. These weak hydrogen bonds have relatively long H···A distances (2.39), D···A distances (3.281 Å), and small D–H···A angles (151°). This intermolecular interaction is weaker than other classical hydrogen bonds. This phenomenon may explain the lower temperature of desolvation of this solvatomorph of DE compared with most other solvatomorphs with DMSO. HS analysis indicated that the mode of the hydrogen bond network in crystal form C was remarkably distinct compared with that in crystal form A because of the introduced solvent molecules for crystal form C.
Vibrational Spectroscopy Analysis
FT-IR Spectroscopy Analysis
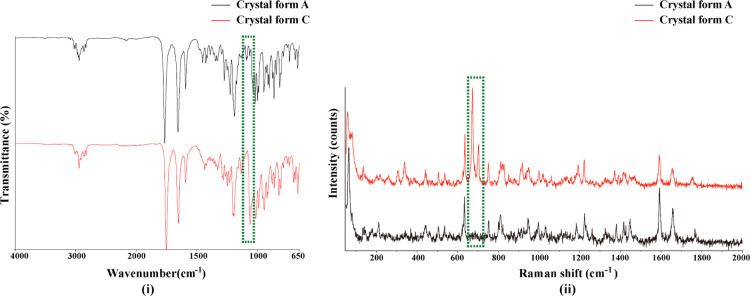
The IR spectra of crystal forms A and C are shown in Figure 6(i). In general, the peaks in the 1060–1040 cm–1 region are attributed to the S=O stretching vibrations in sulfoxide. For crystal form C, the S=O stretching vibrations of DMSO showed an obvious obtuse peak at 1059 cm–1 in the green dashed frame, whereas similar peaks did not appear in the IR spectra of crystal form A.
Figure 6.
IR spectra of crystal forms A and C (i); Raman spectra of crystal forms A and C (ii).
Raman Spectroscopy Analysis
The Raman spectra of crystal forms A and C differed obviously, as shown in Figure 6(ii). For crystal form C, the telescopic vibrations of the C–S bonds (671 and 702 cm–1) were strong but were inconspicuous in crystal form A. The differences were marked with green-dashed frames.
The results of vibrational spectroscopy analysis indicated the differences of two crystal forms in vibrational energy level in the molecules.
In general, a new solvatomorph of DE with DMSO and a polymorph of DE without solvents were obtained through solvent evaporation method A series characterization for them was fulfilled by various pharmaceutical solid-state analysis techniques. SXRD analysis, as the most authoritative and accurate crystal structure analysis method, provided their precise structural information. Notably, the thermodynamic property of this new solvatomorph of DE is different from most reported pharmaceutical solvates. Through TG–MS and DSC analyses, the relatively low desolvation temperature and the disappearance of original melting point of DE caused by transformation to amorphous after desolvation behavior were confirmed. These phenomena do not usually occur for pharmaceutical solvates. The results provides meaningful reference for the subsequent solid-state research, manufacture, and preparation of DE. Finally, this skimmer-type interfaced TG–MS system provides an authoritative and potential strategy for the performance of an in-depth investigation of the deep thermodynamic reaction mechanism of different pharmaceutical solvates. The powerful onsite and real-time analytical capabilities of this system can prevent errors for reaction properties and progresses caused by insufficient information in traditional thermal analysis. The desolvation behavior of solvatomorphs usually leads to their solid-state transformation and production of new crystalline form. As such, this technique can provide detailed information about the transformation process, which is significant for revealing the formation law of different crystal forms.
Conclusions
In this present study, a new DMSO solvatomorph of DE as well as the characterization for this solvatomorph by the TG–MS system with the skimmer-type interface was reported for the first time. This solvatomorph and a polymorph of DE were analyzed by DSC, X-ray crystallography, computational studies, and vibrational spectroscopy. The evolved volatile gas from the solvatomorph of DE containing C2H6OS (DMSO) as the main volatile gaseous species during desolvation was identified using the TG–MS system with the skimmer-type interface. The thermodynamic property of this new solvatomorph of DE is distinct from those of most pharmaceutical solvates, and the solid state of this solvatomorph will transform into an amorphous one after the desolvation behavior. Through X-ray crystallography and computational studies, the weak intermolecular interactions between the DE molecules and the DMSO molecules are elucidated.
Traditional pharmaceutical solid-state characterizations methods, such as TG, DSC, PXRD, FT-IR, and Raman spectroscopy, do not provide sufficient information for identifying pharmaceutical solvatomorphs. SXRD analysis can provide the most accurate information on the crystal structures of solvatomorphs, but it is a static analysis for single crystals and cannot be used for the dynamic reaction process of solvatomorphs. By contrast, the TG–MS coupling system with a skimmer-type interface has shown its superiority and facility for pharmaceutical solvatomorphs. The in-depth thermodynamic reaction process of pharmaceutical solvatomorphs can be revealed using this technique. The skimmer-type interfaced TG–MS system may serve as a powerful technique for identification, characterization, and in-depth study of various pharmaceutical solvatomorphs in the future.
Acknowledgments
This work was financially supported by the National Key R&D Program of China (grant no. 2016YFC1000900), the National Science and Technology Major Project of China (grant nos. 2017ZX09101001003, 2018ZX09711001-001-013, and 2018ZX09711001-010), the National Natural Science Foundation of China (NSFC) (grant no. 81703473), and CAMS Innovation Fund for Medical Sciences (grant no. 2017-I2M-3-010). We are very grateful to Professor Hongde Xia (Institute of Engineering Thermophysics, Chinese Academy of Sciences) for his general guidance and help.
Supporting Information Available
The Supporting Information is available free of charge at https://pubs.acs.org/doi/10.1021/acsomega.0c03531.
The authors declare no competing financial interest.
Supplementary Material
References
- Krattenmacher R. Drospirenone: pharmacology and pharmacokinetics of a unique progestogen. Contraception 2000, 62, 29–38. 10.1016/s0010-7824(00)00133-5. [DOI] [PubMed] [Google Scholar]
- Rapkin A. J.; Winer S. A. Drospirenone: a novel progestin. Expet Opin. Pharmacother. 2007, 8, 989–999. 10.1517/14656566.8.7.989. [DOI] [PubMed] [Google Scholar]
- Oelkers W. Drospirenone, a progestogen with antimineralocorticoid properties A short review. Mol. Cell. Endocrinol. 2004, 217, 255–261. 10.1016/j.mce.2003.10.030. [DOI] [PubMed] [Google Scholar]
- Lopez L. M.; Kaptein A. A.; Helmerhorst F. M. Oral contraceptives containing drospirenone for premenstrual syndrome. Cochrane Database Syst. Rev. 2009, 2, CD006586. 10.1002/14651858.CD006586.pub3. [DOI] [PubMed] [Google Scholar]
- Li M.; Wang A.; Hu L.; Song Z.; Zhao Y.; Sun Y.; Yan L.; Li X. Effects of estradiol-drospirenone on menopausal symptoms, lipids and bone turnover in Chinese women. Climacteric 2015, 18, 214–218. 10.3109/13697137.2014.978753. [DOI] [PubMed] [Google Scholar]
- Caprio M.; Antelmi A.; Chetrite G.; Muscat A.; Mammi C.; Marzolla V.; Fabbri A.; Zennaro M.-C.; Fève B. Antiadipogenic effects of the mineralocorticoid receptor antagonist drospirenone: potential implications for the treatment of metabolic syndrome. Endocrinology 2011, 152, 113–125. 10.1210/en.2010-0674. [DOI] [PubMed] [Google Scholar]
- Parisi M.; Freire E.; Rusjan M.; Moreno J. M.; Bonadeo H.; Vega D. Solid state modifications of drospirenone. J. Mol. Struct. 2013, 1040, 83–89. 10.1016/j.molstruc.2013.01.040. [DOI] [Google Scholar]
- Brittain H. G. Polymorphism and solvatomorphism 2010. J. Pharm. Sci. 2012, 101, 464–484. 10.1002/jps.22788. [DOI] [PubMed] [Google Scholar]
- Byrn S. R.; Pfeiffer R. R.; Stowell J. G.. Solid-State Chemistry of Drugs, 2nd ed.; Academic Press: West Laffyette, 1999; pp 1–17. [Google Scholar]
- Chieng N.; Rades T.; Aaltonen J. An overview of recent studies on the analysis of pharmaceutical polymorphs. J. Pharm. Biomed. Anal. 2011, 55, 618–644. 10.1016/j.jpba.2010.12.020. [DOI] [PubMed] [Google Scholar]
- Worasuwannarak N.; Sonobe T.; Tanthapanichakoon W. Pyrolysis behaviors of rice straw, rice husk, and corncob by TG-MS technique. J. Anal. Appl. Pyrolysis 2007, 78, 265–271. 10.1016/j.jaap.2006.08.002. [DOI] [Google Scholar]
- Tang C.-W.; Wang C.-B.; Chien S.-H. Characterization of cobalt oxides studied by FT-IR, Raman, TPR and TG-MS. Thermochim. Acta 2008, 473, 68–73. 10.1016/j.tca.2008.04.015. [DOI] [Google Scholar]
- Otero M.; Diez C.; Calvo L.; Garcia A.; Moran A. Analysis of the co-combustion of sewage sludge and coal by TG-MS. Biomass Bioenergy 2002, 22, 319–329. 10.1016/s0961-9534(02)00012-0. [DOI] [Google Scholar]
- Ischia M.; Perazzolli C.; Dal Maschio R.; Campostrini R. Pyrolysis study of sewage sludge by TG-MS and TG-GC-MS coupled analyses. J. Therm. Anal. Calorim. 2007, 87, 567–574. 10.1007/s10973-006-7690-3. [DOI] [Google Scholar]
- Fushimi C.; Araki K.; Yamaguchi Y.; Tsutsumi A. Effect of heating rate on steam gasification of biomass. 2. Thermogravimetric-mass spectrometric (TG-MS) analysis of gas evolution. Ind. Eng. Chem. Res. 2003, 42, 3929–3936. 10.1021/ie0300575. [DOI] [Google Scholar]
- Fu Y.; Li G.; Liao F.; Xiong M.; Lin J. Two novel transition metal-organic frameworks based on 1,3,5-benzenetricarboxylate ligand: Syntheses, structures and thermal properties. J. Mol. Struct. 2011, 1004, 252–256. 10.1016/j.molstruc.2011.08.013. [DOI] [Google Scholar]
- Giron D. Applications of Thermal Analysis and Coupled Techniques in Pharmaceutical Industry. J. Therm. Anal. Calorim. 2002, 68, 335–357. 10.1023/a:1016015113795. [DOI] [Google Scholar]
- Holló B.; Rodić M. V.; Vojinović-Ješić L. S.; Živković-Radovanović V.; Vučković G.; Leovac V. M.; Szécsényi K. M. Crystal structure, thermal behavior, and microbiological activity of a thiosemicarbazide-type ligand and its cobalt complexes. J. Therm. Anal. Calorim. 2014, 116, 655–662. 10.1007/s10973-013-3489-1. [DOI] [Google Scholar]
- Macomber C. S.; Boncella J. M.; Pivovar B. S.; Rau J. A. Decomposition pathways of an alkaline fuel cell membrane material component via evolved gas analysis. J. Therm. Anal. Calorim. 2008, 93, 225–229. 10.1007/s10973-007-8930-x. [DOI] [Google Scholar]
- Shen J.; Bai H.; Zhou X.; Liu J.; Hu X.; Chu P. K.; Tang G. Spontaneous single-crystal to single-crystal transition with self-healing cracks involving solvent exchange. CrystEngComm 2019, 21, 1102–1106. 10.1039/c8ce02110d. [DOI] [Google Scholar]
- Stofella N. C. F.; Veiga A.; Oliveira L. J.; Montin E. F.; Andreazza I. F.; Carvalho Filho M. A. S.; Bernardi L. S.; Oliveira P. R.; Murakami F. S. Solid-State Characterization of Different Crystalline Forms of Sitagliptin. Materials 2019, 12, 2351. 10.3390/ma12152351. [DOI] [PMC free article] [PubMed] [Google Scholar]
- Suitchmezian V.; Jeß I.; Näther C. Investigations on the polymorphism and pseudopolymorphism of triamcinolone diacetate. Int. J. Pharm. 2006, 323, 101–109. 10.1016/j.ijpharm.2006.05.055. [DOI] [PubMed] [Google Scholar]
- Suitchmezian V.; Jeß I.; Näther C. Crystal structures and properties of two new pseudopolymorphic modifications of the glucocorticoide triamcinolone diacetate. Solid State Sci. 2006, 8, 1373–1379. 10.1016/j.solidstatesciences.2006.07.005. [DOI] [Google Scholar]
- Huang Q.; Wei K.; Xia H. Investigations in the recrystallization of evolved gases from pyrolysis process of melamine. J. Therm. Anal. Calorim. 2019, 138, 3897–3903. 10.1007/s10973-019-08338-x. [DOI] [Google Scholar]
- Arii T. Development of a simultaneous thermogravimetry-differential thermal analysis and photoionization mass spectroscopy instrument connected with a skimmer-type interface. Netsu Sokutei 2011, 38, 149–156. [Google Scholar]
- Celiz L. L.; Arii T. Study on thermal decomposition of polymers by simultaneous measurement of TG-DTA and miniature ion trap mass spectrometry equipped with skimmer-type interface. J. Therm. Anal. Calorim. 2014, 116, 1435–1444. 10.1007/s10973-014-3817-0. [DOI] [Google Scholar]
- Li R.; Chen Q.; Xia H. Study on pyrolysis characteristics of pretreated high-sodium (Na) Zhundong coal by skimmer-type interfaced TG-DTA-EI/PI-MS system. Fuel Process. Technol. 2018, 170, 79–87. 10.1016/j.fuproc.2017.10.023. [DOI] [Google Scholar]
- Burla M. C.; Caliandro R.; Camalli M.; Carrozzini B.; Cascarano G. L.; De Caro L.; Giacovazzo C.; Polidori G.; Siliqi D.; Spagna R. IL MILIONE: a suite of computer programs for crystal structure solution of proteins. J. Appl. Crystallogr. 2007, 40, 609–613. 10.1107/s0021889807010941. [DOI] [Google Scholar]
- Sheldrick G. M. A short history ofSHELX. Acta Crystallogr., Sect. A: Found. Crystallogr. 2008, 64, 112–122. 10.1107/s0108767307043930. [DOI] [PubMed] [Google Scholar]
- Dolomanov O. V.; Bourhis L. J.; Gildea R. J.; Howard J. A. K.; Puschmann H. OLEX2: A complete structure solution, refinement and analysis program. J. Appl. Crystallogr. 2009, 42, 339–341. 10.1107/s0021889808042726. [DOI] [Google Scholar]
- Müller P.; Herbst-Irmer R.; Spek A. L.; Schneider T. R.; Sawaya M. R.. Crystal Structure Refinement; Academic Press: Oxford University, 2006; pp 1–213. [Google Scholar]
- Macrae C. F.; Edgington P. R.; McCabe P.; Pidcock E.; Shields G. P.; Taylor R.; Towler M.; van de Streek J. Mercury: visualization and analysis of crystal structures. J. Appl. Crystallogr. 2006, 39, 453–457. 10.1107/s002188980600731x. [DOI] [Google Scholar]
- Jayatilaka D.; Wolff S. K.; Grimwood D. J.; Mckinnon J. J.; Spackman M. A. CrystalExplorer: a tool for displaying Hirshfeld surfaces and visualising intermolecule interactions in molecule crystals. Acta Crystallogr., Sect. A: Found. Crystallogr. 2006, 62, s90. 10.1107/s0108767306098199. [DOI] [Google Scholar]
- NIST Chemistry WebBook . NIST Standard Reference Database Number 69. Available at: http://webbook.nist.gov/chemistry/ (accessed July 20, 2020).
- De Villiers M. M.; Mahlatji M. D.; Malan S. F.; van Tonder E. C.; Liebenberg W. Physical transformation of niclosamide solvates in pharmaceutical suspensions determined by DSC and TG analysis. Pharmazie 2004, 59, 534–540. [PubMed] [Google Scholar]
- Shin J.-Y.; Sohn Y.-T. Solid state of a new flavonoid derivative DA-6034. J. Therm. Anal. Calorim. 2014, 115, 2457–2461. 10.1007/s10973-013-3380-0. [DOI] [Google Scholar]
- Gong J.; Zhang D.; Ran Y.; Zhang K.; Du S. Solvates and polymorphs of clindamycin phosphate:Structural, thermal stability and moisture stability studies. Front. Chem. Sci. Eng. 2017, 11, 220–230. 10.1007/s11705-017-1624-4. [DOI] [Google Scholar]
- Xiong X.; Du Q.; Zeng X.; He J.; Yang H.; Li H. Solvates and polymorphs of rebamipide: preparation, characterization, and physicochemical analysis. RSC Adv. 2017, 7, 23279–23286. 10.1039/c7ra02895d. [DOI] [Google Scholar]
- Wang X.; Gong N.; Yang S.; Du G.; Lu Y. Studies on Solvatomorphism of Betulinic Acid. J. Pharm. Sci. 2014, 103, 2696–2703. 10.1002/jps.23853. [DOI] [PubMed] [Google Scholar]
- Yang D.; Gong N.; Zhang L.; Lu Y.; Du G. Structural and Computational Study of 4 New Solvatomorphs of Betulin: A Combined X-Ray, Hirshfeld Surface, and Thermal Analysis. J. Pharm. Sci. 2017, 106, 826–834. 10.1016/j.xphs.2016.11.004. [DOI] [PubMed] [Google Scholar]
Associated Data
This section collects any data citations, data availability statements, or supplementary materials included in this article.


