Abstract
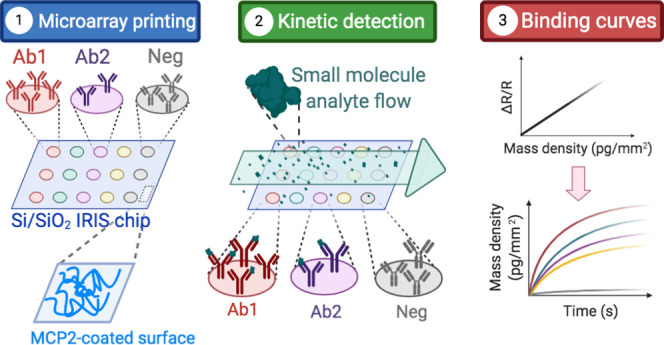
Investigating the binding interaction of small molecules to large ligands is a compelling task for the field of drug development, as well as agro-biotechnology, since a common trait of drugs and toxins is often a low molecular weight (MW). Here, we improve the limit of detection of the Interferometric Reflectance Imaging Sensor (IRIS), a label-free, highly multiplexed biosensor, to perform small-molecule screening. In this work, characterization of small molecules binding to immobilized probes in a microarray format is demonstrated, with a limit of detection of 1 pg/mm2 in mass density. First, as a proof of concept to show the impact of spatial and temporal averaging on the system noise, detection of biotin (MW = 244.3 Da) binding to a streptavidin-functionalized chip is performed and the parameters are tuned to achieve maximum signal-to-noise ratio (SNR ≈ 34). The optimized system is then applied to the screening of a 20-multiplexed antibody chip against fumonisin B1 (MW = 721.8 Da), a mycotoxin found in cereal grains. The simultaneously recorded binding curves yield an SNR ≈ 8. Five out of twenty antibodies are also screened against the toxin in a lateral flow assay, obtaining consistent results. With the demonstrated noise characteristics, further sensitivity improvements are expected with the advancement of camera sensor technology.
1. Introduction
The ability to measure small-molecule binding kinetics is a critical issue in pharmacology research. In 2019, the Federal Drug Administration (FDA) approved 48 new drugs, 73% of which belong to the category of small molecules, defined as an ensemble of the chemical compounds with a molecular weight (MW) below 1 kDa.1,2 On the same level, most of the microfungi-produced toxins that are commonly known to affect many varieties of crops also fit this description, which makes small-molecule detection ability of utmost importance in the food industry as well. Since the most established drug and toxin detection methods are antibody-based, both in point of care systems and in industry, characterization of the affinity of the small molecules to monoclonal antibodies is crucial to determine the best capture probe for the unambiguous screening of complex specimens, like bodily fluids or food samples.
The low molecular weight that characterizes these compounds facilitates access to the cell through the cellular membrane, where an effect (either beneficial for medicines or harmful for toxins) can be produced. However, while the small size of these molecules benefits function, it also makes detection difficult. In label-free sensing, molecular binding, especially for small-molecular weight (MW) analytes, generates a very small optical response. Labeling small molecules with either a fluorescent tag3,4 or a metallic nanoparticle5,6 makes them easier to detect. However, most of these techniques lack kinetic capabilities. Moreover, efficient labeling of such small compounds is an invasive process that can cause changes in the molecule’s functionality, especially if the tag is much larger in size.7
Label-free techniques are, therefore, preferred when it comes to evaluating the kinetic behavior of drugs, toxins, and small analytes in general, against specific capture probes. Among these methods, surface plasmon resonance (SPR) is one of the most widely employed.8 SPR achieves a good sensitivity, for both small and large molecules.9 However, SPR measurements can be challenging, due to environmental factors that inevitably increase the noise of the measurements, such as the change in the refractive index of the solution, caused by solvents, temperature changes, or pH variations. Moreover, traditional SPR instruments often lack multiplexing capabilities, making the comparison of different ligands difficult. Surface plasmon resonance imaging (SPRi), on the other hand, allows for multiplexing but in return sacrifices sensitivity, which worsens by an order for magnitude from traditional SPR, as broadly discussed in Section 3.2.10 These considerations emphasize both the challenge and the need for an effective and simple quantification of small-molecule–probe interactions.
Here, we demonstrate a highly sensitive optical method to detect the binding of small-molecule analytes to their ligands. By combining the well-known technique of the interferometric reflectance imaging sensor (IRIS)11 with noise reduction algorithms and procedures, we increase the signal-to-noise ratio and enable small-molecule sensitivity, shown for a small molecule of a molecular weight (MW) of 244.3 Da (biotin). The optimization process described in this work leads to a sensitivity of ≈1 pg/mm2 in terms of biomass accumulation detection, and the measured signal is shown to be shot noise-limited, which leaves even further potential for improvement with imaging sensor technology, as explained in Section 2.1.2. We show the application of the optimized sensor to the detection and characterization of a low-molecular-weight mycotoxin (fumonisin B1, MW = 721.8 Da) on a 20-multiplexed chip, achieving a signal-to-noise ratio of ≈8. On the 20-multiplexed chip, 20 spots were devoted to each probe, proving that the current IRIS system allows for characterization of up to 400 ligands on the same support, a level of multiplexing that could be even further extended through incorporation of a camera with a larger imaging sensor size.
2. Results
2.1. Noise Reduction and System Optimization
To detect small molecules binding to their ligands, the system noise must be lower than the change in signal that occurs due to the addition of the small MW analyte to the large MW ligand. The reflectance signal measured in the IRIS system is captured by a scientific-grade camera designed to have low noise characteristics. Despite this, CMOS sensors can be vulnerable to dark current noise (which is temperature-dependent), read noise (sensor design-dependent), and fixed pattern noise (fabrication quality-dependent). In addition to these, shot noise, which originates from the discrete nature of the electric charge, can dominate in bright images. In shot noise-limited operation, the signal-to-noise ratio (SNR) increases with √N, where N is the number of electrons; therefore, increasing the number of electrons captured can lead to drastic improvements in the SNR. In CMOS sensors, the number of electrons that we can collect corresponds to the full-well capacity (FWC) of the pixels. However, the FWC cannot be increased infinitely, and therefore, shot noise cannot be effectively reduced through imaging sensor selection alone. To improve noise beyond the FWC, electrons from nearby pixels in both time and space can be combined through averaging to further minimize the noise.
2.1.1. IRIS Characterization of Biotin–Streptavidin Interaction
Here, the biotin–streptavidin interaction is used as a proof of concept to demonstrate the level of detection of our sensor, as well as to optimize the acquisition and analysis parameters to achieve the best possible sensitivity. The biotin–streptavidin interaction is commonly utilized in a variety of biophysical methods to strongly anchor molecules to a surface, as it is one of the strongest noncovalent interactions in nature.12 Biotin belongs to the above-defined category of small molecules, with a molecular weight of only 244.3 Da.
For this experiment, streptavidin molecules were immobilized in a microarray modality on IRIS chips, at a spotting concentration of 18 μM. Biotin was flowed across the streptavidin spots at a 1 μM concentration for 20 min, at a flow rate of 200 μL/min. The binding of the biotin molecules to the streptavidin probes is extremely fast, as is expected if one considers the very low KD of the interaction (≈1 pM). Therefore, the obtained binding curve has the appearance of a step (Figure 1).
Figure 1.
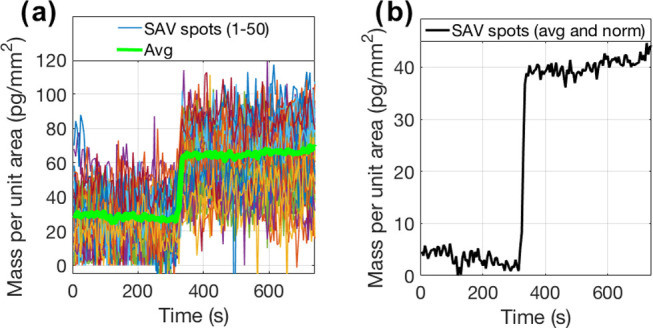
Effect of averaging on a streptavidin–biotin experiment. Biotin was flowed at a concentration of 1 μM across a chip where 50 streptavidin spots were previously printed. (a) Biotin signal without spatial averaging (single spots) (b) compared to biotin signal with spatial averaging (50 spots). Temporal averaging was fixed at 100 frames/image.
2.1.2. Temporal and Spatial Averaging
Temporal and spatial averaging were employed to minimize the noise, quantified as the standard deviation over the signal. Figure 2a,2b shows the theoretical noise reduction expected from temporal and spatial averaging in a shot noise-dominated model, as well as the actual noise reduction observed in the biotin–streptavidin experiment shown in Figure 1. Figure 2a depicts the standard deviation over the signal of a single pixel with an increasing number of averaged frames, confirming the noise dependence on √N. Using this information, 100 frames were chosen as the optimal number of frames for averaging to maximize noise reduction while maintaining sufficient temporal resolution. Figure 2b shows the standard deviation over the average signal when 100 frames were averaged, beginning with averaging the pixels within a single microarray spot (5024 pixels) and increasing the number of spots averaged, with each spot contributing an additional 5024 pixels of electrons. The deviation in the experimental trend from the theoretical trend in Figure 2b can be attributed to dynamic changes on the chip surface and fluidic movement of the system.
Figure 2.
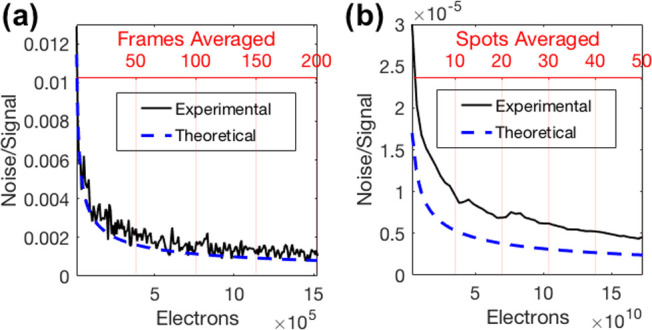
Effect of averaging on the IRIS signal. Theoretical and experimental reduction in the noise level due to (a) temporal averaging and (b) spatial averaging.
Figure 1 shows the SNR improvement from applying the studied noise reduction methods in the biotin–streptavidin experiment. One hundred frames were averaged in time for each image in the experiment, and 50 microarray spots (5024 pixels each) were analyzed. The data in Figure 1a shows the average signal value for each of these 50 microarray spots. When these 50 microarray spots are averaged together, the result, seen in Figure 1b, shows a clear binding step and an SNR of 34. The noise level achieved was 1 pg/mm2, which could be easily improved with more averaging (spatial or temporal).
2.2. Application of the Optimized IRIS System to Detection of Toxins
Toxins are poisonous substances produced by living organisms and many fall into the previously defined category of small molecules. In particular, mycotoxins are low-molecular-weight (<800 Da) secondary metabolites produced by microfungi (molds). These naturally produced compounds can be easily found in fresh produce, as a result of fungal infection of crops. Mycotoxins are harmful to both humans and animals, provoking diseases (mycotoxicoses), which might lead to cancer formation13,14 and sometimes death. Given the serious effects that they provoke on human health, the food industry is facing the critical issue of trying to detect the presence of these toxins in food products during quality control procedures.
2.2.1. Real-Time IRIS Screening of a 20-Multiplexed Chip against Fumonisin B1
In this work, we applied the noise-optimized IRIS system to the study of the binding kinetics of Fumonisin B1, a 721.8 Da mycotoxin produced by the Fusarium fungal species. This fungus usually attacks corn crops and acts by weakening the core structure of corn cobs.
For these experiments, twenty antibodies that tested positive to the toxin in an ELISA assay were immobilized onto an IRIS chip, where twenty spots were devoted to each antibody, for a total of 440 active spots that were imaged simultaneously (Figure 3, 20 antibodies, each printed on 20 equal spots and 40 control spots). Each antibody was spotted at a different spotting concentration, due to different purification yields, and the spots appear with different initial intensities, as shown in Figure 3; thus, the steady-state signal level may not be predictive of binding kinetics.
Figure 3.
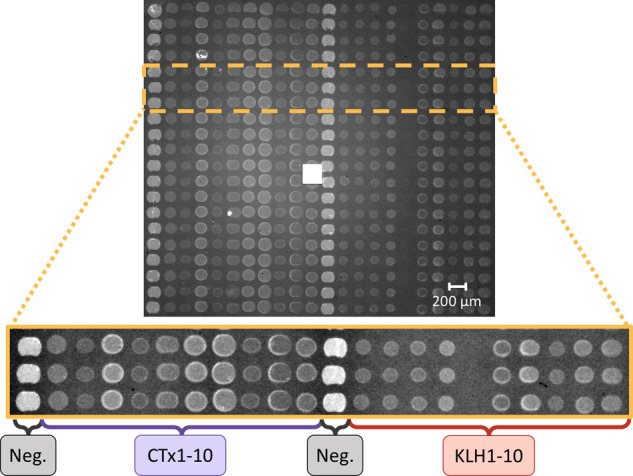
IRIS image of the 440 antibody spots on one of the chips used for the experiments. The first and 12th columns are devoted to the control (bovine IgG), columns 2–11 are devoted to fumonisin B1-CTxB antibodies (CTx1-10), and columns 13–22 are devoted to fumonisin B1-KLH antibodies (KLH1-10). The different intensity of the spots is due to differences in concentration of the spotted samples.
Fumonisin at a concentration C0 = 100 μM was flowed across the surface of the chip for 20 min at 200 μL/min, followed by PBS-1X at 200 μL/min for 20 more min. The binding was detected on 18 out of the 20 antibodies, and representative binding curves are reported in Figure 4. A simple 1:1 Langmuir model15 was used to fit the curves and obtain the association and dissociation constants (Table S1). The remaining 14 binding curves are reported in the Supporting Information (Figures S1 and S2).
Figure 4.
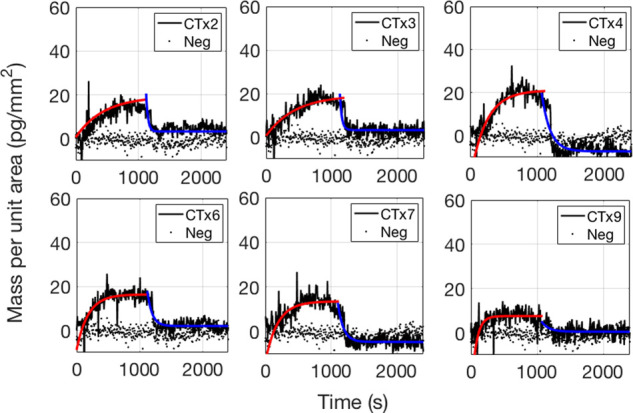
Binding and debinding curves of the fumonisin B1 toxin at a concentration of 100 μM to six different antibodies. The association part of the fit is shown in the red, solid line. The dissociation part is shown in the blue, solid line. The control spots’ trend is shown in the black, dotted line.
From our measurements, the antibodies produced with fumonisin B1-CTxB seem to have a higher affinity to fumonisin B1. Particularly, the antibody that we have labeled as CTx5 has the highest association constant and lower equilibrium constant (KD).
2.2.2. Lateral Flow Assay Measurements for Detection of Fumonisin B1 Toxin
A competitive lateral flow (LF) assay
was performed as a validation step to determine the reactivity of
the monoclonal antibodies to fumonisin B1. The results are reported
for five clones in Table S2. For these
experiments, the amount of fumonisin antibody-coated gold nanoparticles
bound to a fumonisin B1–IgG conjugate test line was quantified
in the absence and presence of 4.8 ppm (≈5.5 μM) of fumonisin
B1, as described in Experimental Section 5.5. The intensity of the quantified signal
in the absence and presence of the toxin is indicated as a percentage
( %). The lower the percentage, the higher
the sensitivity of the antibody to the toxin. These results demonstrate
that the antibodies from the CTxB subset have a higher sensitivity
for the toxin, in accordance with the IRIS data. Moreover, KLH2 and
KLH7 were the least reactive of the antibodies that were tested on
the lateral flow reader, as well as showing very little binding on
the IRIS platform.
3. Discussion
3.1. Analysis of the Noise Levels and Potential for Improvement
The signal measured in the IRIS system is electronic from the CMOS camera, lending itself to straightforward analysis in units of electrons. However, for a more practical quantification of sensitivity, these values are converted to biomass. The black-colored line in Figure 5 shows the relationship between the signal measured at the CMOS camera and the amount of biomass accumulation on the IRIS sensor surface.16 Both the change in signal as a result of a binding event and noise levels in relation to total signal are displayed in this figure. To observe a binding event, the binding signal must be higher than the signal noise. The noise level of a single pixel, without any improvements from spatial and temporal averaging, is labeled S0 in Figure 5. This noise level of 3 ng/mm2 prevents the observation of larger molecules such as antibodies (150 kDa). With the averaging optimizations explored in this study, the sensitivity improves by multiple orders of magnitudes to 1 pg/mm2, with the potential for further improvements.
Figure 5.
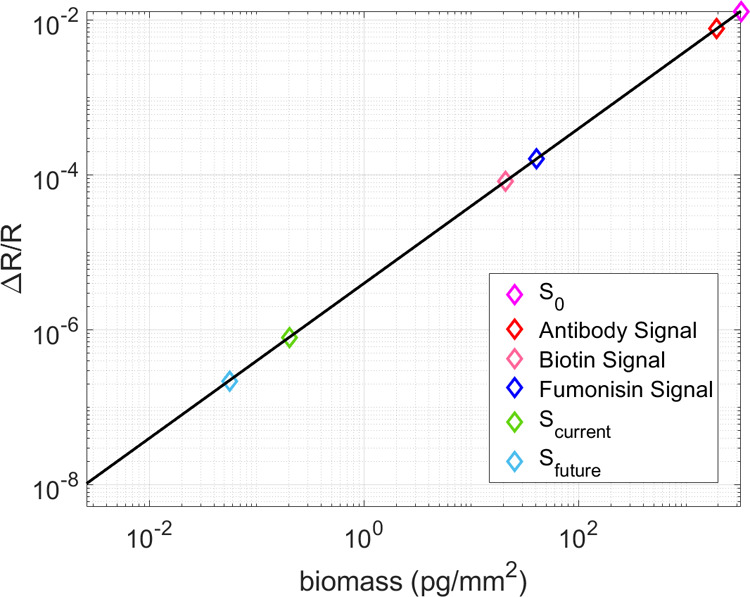
Change in the reflectance signal and the relation to biomass accumulation. S0 shows the sensitivity of IRIS without any spatial and temporal averaging. Scurrent marks the ultimate sensitivity in terms of noise achievable with the current camera (FLIR GS3-U3-51S5) and Sfuture marks the ultimate sensitivity achievable with the proposed new camera (FLIR BFS-U3-17S7M) discussed further in the text. These values are shown in relation to the signal levels measured for biotin and fumonisin found in these studies, as well as a typical IgG antibody.17
The camera used in these experiments (GS3-U3-51S5M-C) has an FWC of 10,361, a frame rate of 38 fps, and an image sensor size of 5,013,504 pixels, which dictate the potential for shot noise reduction in this system. The FWC describes the number of photons that can be collected by each pixel, and therefore, the base shot noise. The frame rate dictates the number of frames that can be averaged temporally and still maintain the temporal resolution needed to quantify the binding event of interest. The size of the image sensor determines how many pixels are available for spatial averaging; though, spatial averaging limits the number of different molecules that can be measured simultaneously, diminishing the multiplexing capabilities of IRIS. The results of this study provide guiding principles for optimizing IRIS experiments. The number of electrons needed for desired sensitivity levels, and therefore, the pixels and frames to average, determine the experimental parameters such as spot size (pixels) and temporal resolution (frames). When detecting small amounts of biomass accumulation, utilizing more of the sensor surface or lowering temporal resolution can allow for great increases in sensitivity.
In the proof-of-concept biotin–streptavidin experiments described above, only 271,286 out of the available 5,013,504 pixels were used to image the streptavidin spots, resulting in a fill factor of only 5% and a sensitivity defined by the noise floor of 1 pg/mm2. A 40% fill factor can be comfortably achieved, and therefore, with the currently implemented camera utilizing a 40% fill factor and filling the FWC to 75% and averaging 100 frames, the maximum sensitivity that can be achieved is 0.202 pg/mm2.
Future implementation of improved CMOS technology will greatly increase the SNR in these experiments. For example, the FLIR BFS-U3-17S7M, a 1.1″ format CMOS, has an FWC of 98,654, and therefore lower baseline shot noise. It also has a frame rate of 152 fps at 12 bit image capture, allowing for greater temporal averaging with the same experimental temporal resolution, and a camera sensor size of 1,760,000 pixels, allowing for significant spatial averaging. With this proposed camera, filling the FWC to 75%, utilizing a 40% fill factor, and averaging 400 frames (for the same temporal resolution), the maximum sensitivity that can be achieved is 0.0559 pg/mm2. Table S3 shows a more detailed comparison of the two above-mentioned camera technologies. Figure 5 shows the improvement in sensitivity for the camera used in these experiments and the proposed camera technology, as well as the signal levels for the biotin–streptavidin interaction and fumonisin achieved in these experiments, and the signal level for a typical IgG antibody.
The signal levels reached with the binding of biotin and fumonisin to the sensor surface as shown in Figure 5 are in good accordance with the expected values, as further described in Section 1 of the Supporting Information. There, a more deep discussion around the connection between the molecular structure of the probe, the chemical structure of the surface, and binding efficiency of the analyte is carried out.
3.2. Limit of Detection with Respect to Other Label-Free Technologies
In the world of label-free detection and small-molecule characterization, surface plasmon resonance (SPR) is by far the most widely employed technique. Other technologies1,7,18,19 are rapidly gaining popularity, but, nevertheless, SPR is still considered to be the gold standard of the field. Therefore, we have decided to focus our analysis on the comparison between the SPR and the IRIS technology.
As mentioned in the Introduction, SPR technology is based on signal amplification and therefore has a very high sensitivity, able to detect less than 1 pg/mm2 in mass density.9 However, SPR suffers from environmental factors, like refractive index changes caused by solvents or temperature shifts, requiring the use of an additional channel as a blank to correct for unwanted effects. Moreover, SPR cannot provide multiplexed measurements, and instead, a more complex version of SPR is normally used, namely, surface plasmon resonance imaging (SPRi). SPRi can provide multiplexed measurements up to thousands of probes. However, the limit of detection of SPRi increases to ≈7 pg/mm2 in spectral mode and ≈30 pg/mm2 in reflective mode.10 SPRi is therefore not suited for small-molecule characterization, which—depending on the affinity of the reaction—can lead to a total accumulated biomass below its limit of detection.
To compare these techniques to the IRIS, we will now summarize the results presented in Sections 2.1 and 2.2 to define its sensitivity and limit of detection. Thanks to the averaging procedures and optimization process described in Section 2.1.2, both binding measurements of a single analyte to a single probe and multiplexed measurements have demonstrated small-molecule sensitivity. An SNR of ≈34 has been obtained for binding of biotin to a streptavidin-functionalized chip, with a noise level of 1 pg/mm2, comparable to traditional SPR. For what concerns multiplexed measurements, a standard noise of 1.5 pg/mm2 has been demonstrated for a 20-multiplexed chip with 440 spots imaged simultaneously, achieving small-molecule sensitivity as well as multiplexing, a net improvement with respect to conventional SPRi.
Furthermore, the IRIS presents a non-negligible cost advantage. The cost of the whole IRIS cartridge is <$5, while SPR consumables are upward of $200. Si-based microfluidics has highly scalable production capabilities due to the well-established semiconductor fabrication industry, and as a result, the cost of each cartridge can be as little as $2 in large volumes.20
4. Conclusions
To conclude, we have demonstrated a multiplexed, highly sensitive label-free optical detection technique for measuring small-molecule binding kinetics achieved through noise reduction methods. Quantitatively, the results obtained with the IRIS in terms of biomass accumulation are in accordance with the theoretical predictions, as shown in Section 1 in the Supporting Information. The lateral flow findings—although limited—are in good accordance with the IRIS data, thus confirming the screening capabilities of the IRIS technology. Most importantly, the IRIS allowed us to accurately estimate the affinity of fumonisin for 18 out of 20 antibodies, information that the lateral flow reader was unable to provide.
Since our technique relies on improving the measurement fidelity through temporal and spatial averaging, further improvements in sensitivity are expected as camera technologies advance and provide a faster frame rate, larger full-well capacity per pixel, and larger camera sensor. The increased sensitivity afforded by these advancements would allow for detection of even smaller amounts of biomaterial accumulation, enabling characterization of smaller-sized molecules at lower concentrations.
5. Experimental Section
5.1. Interferometric Reflectance Imaging Sensor (IRIS)
The working principle of IRIS has been extensively described earlier.11 Briefly, a silicon substrate with a thin layer of SiO2 is illuminated from the top with a light-emitting diode (LED) in a common-path interferometer configuration, and the reflected image is captured with a camera (Figure S5). While a single color LED is used for data acquisition, four images are acquired prior to each experiment by subsequently illuminating the chip with each of four narrowband LEDs with distinct central wavelengths (457, 518, 595, and 632 nm). These four-color images are taken as a calibration step to allow for conversion from reflectance signal-to-mass density values.16 The color of the LED used for data acquisition is selected in accordance with the specific thickness of the oxide layer. For example, for 110 nm of oxide, blue (457 nm) produces the largest signal for biomass accumulation. An adhesive 130 μm-thick spacer and a coverglass are applied to the substrate, creating a fluidic chamber (Figure S6). Laser-drilled through-holes on each end of the SiO2/Si substrate allow for fluids to enter the chamber, flow across the chip, and exit. An antireflection coating is applied on the coverslip to minimize reflection from the air–glass interface. The cartridge thus composed is imaged through the solution, allowing for monitoring of unwanted effects such as refractive index changes. The images are acquired by a CMOS camera, in this study the FLIR Grasshopper GS3-U3-51S5M-C.
5.2. Image Analysis
The real-time videos are analyzed in ImageJ through a custom-made plugin. Briefly, two regions of interest are considered for each spot: the spot itself (Sspot) and a donut-shaped region around it, to be used as background (Sbg). By measuring the differential change in signal ΔS = Sspot – Sbg, the binding curves are generated. Further postprocessing analysis is performed in MATLAB, where the data are fitted with the model of choice (in the case of fumonisin, a simple Langmuir 1:1 binding model is used). Moreover, both during acquisition and in postprocessing, temporal and spatial averaging are applied to the acquired data to increase the signal-to-noise ratio and improve the limit of detection, as further discussed in Section 2.1.2.
5.3. Chip Surface Functionalization
The chips are functionalized by printing the molecular probes on the surface in a microarray modality. Spot printing is performed with the M2 iTWO-300P High precision microarray-dispensing instrument (Berlin, Germany). Prior to spotting, the surface of the chips is activated with an N,N-dimethylacrylamide (DMA)-based polymer, commercially known as MCP-2 (Lucidant Polymers, LLC, Sunnyvale, CA).21 Briefly, the chips are first activated with oxygen plasma for 10 min, then immersed in the aqueous polymer solution (1% w/v polymer in 20% saturated ammonium sulfate) for 30 min. The chips are then rinsed with DI water, gently dried with a nitrogen stream, and finally dried in a vacuum oven at 80 °C for 15 min. Spotting of the probes is subsequently performed, and after deposition, the chips are left in the spotter at 70% humidity overnight. Prior to starting the experiment, the chips are blocked with a 50 mM ethanolamine solution in 100 mM tris-HCl (pH = 9).
5.4. Chemical and Biological Materials
All buffers and reagents were purchased from Sigma-Aldrich (St. Louis, MO). Fumonisin and fumonisin antibody samples were provided by Neogen, Inc. Fumonisin B1 was provided as a powder and dissolved in 50/200 mM PBS (pH = 7.5) at a final concentration of 100 μM. Monoclonal antifumonisin antibodies were purified from cell culture supernatants by Protein-G chromatography. The antibodies were generated by immunizing mice with fumonisin B1 conjugated to either Cholera toxin B subunit (CTxB) or to Keyhole Limpet Hemocyanin (KLH). The antibodies were immobilized on the chips at purification concentration. Biotin was dissolved in DMSO at a concentration of 100 mM, diluted in PBS at 1 mM, and subsequently diluted at 1 μM.
5.5. Lateral Flow Reader
All lateral flow assay measurements were quantified with the Raptor Solo Integrated Analysis Reader (Neogen Corporation). The data was downloaded from the reader as an Excel file using the Data Manager application provided by Neogen.
In general, an LF device consists of a glass fiber pad (conjugate pad) overlapping a nitrocellulose membrane capped with an absorbent (wicking) pad (Figure S8). Antibody-coated gold nanoparticles are dispensed onto the conjugate pad and an antibody-specific binding reagent (test line) is dispensed on the nitrocellulose. The application of a liquid sample to the gold conjugate pad initiates the capillary flow of the sample through the pad and the wicking pad draws the sample through the conjugate pad and onto the nitrocellulose. In the absence of the analyte in the sample, the gold particles bind to the test line resulting in a dense colored line. If the sample contains the analyte, the antibody-coated gold particles will preferentially bind to the analyte, thus decreasing the amount of gold that can bind to the test line. The result is a less dense test line. The test line density will vary depending on the concentration of the analyte in the sample, as well as the binding affinity of the antibody-coated gold nanoparticle to the analyte.
With regards to the LF device used in the experiments described
herein, each antifumonisin B1 monoclonal antibody was passively coated
onto 40 nm gold nanoparticles (10 μg of antibody per OD of gold
solution), and 0.02 OD gold was dispensed onto the conjugate pad of
an LF device. The test line striped onto the nitrocellulose membrane
was a fumonisin B1–IgG conjugate (0.4 μg per device).
For the assay, nondetect (ND) corn matrix and corn matrix contaminated
with fumonisin B1 at 4.8 ppm (Trilogy Analytical Laboratory) were
extracted and the assay was performed according to the kit instructions
for the DON Q+ Lateral Flow Assay (Neogen). The assay was performed
at ambient temperature for 5 min. In the absence of fumonisin B1,
the test line (TL) forms a solid line. The TL intensity is diminished
in the presence of fumonisin B1. Test Line intensity in the absence
and presence of fumonisin B1 was quantified with the Lateral Flow
Reader, and the antibody sensitivity to fumonisin B1 was assessed
by calculating the binding percentage ( ), as shown in eq 1
| 1 |
where TLB1 indicates the TL intensity in the presence of fumonisin B1, while TLND is the intensity measured in the nondetectable (ND) extract.
Acknowledgments
This work was partially funded by the Boston University Ignition Program and by the National Science Foundation (NSF iCorps Award No. 2027109 and NSF-TT PFI Award No. 1941195). The TOC entry figure, as well as figures S4, S5a and S6b, were created with BioRender.
Supporting Information Available
The Supporting Information is available free of charge at https://pubs.acs.org/doi/10.1021/acsomega.0c03708.
Binding and debinding curves of fumonisin B1 to a multiplexed chip, and respective association and dissociation constants; lateral flow results; comparison with a model for theoretical mass accumulation values; schemes and pictures of the IRIS setup and of the lateral flow reader (PDF)
The authors declare the following competing financial interest(s): Prof. M. Selim Ünlü is the principal investigator of these technology translation grants. He is the founder of a start up company (iRiS Kinetics, Inc.) for the commercialization of the multiplexed affinity technique.
Supplementary Material
References
- Piehler J.; Brecht A.; Gauglitz G. Affinity Detection of Low Molecular Weight Analytes. Anal. Chem. 1996, 68, 139–143. 10.1021/ac9504878. [DOI] [PubMed] [Google Scholar]
- Mullard A. FDA Drug Approvals. Nat. Rev. Drug Discovery 2020, 19, 79–84. 10.1038/d41573-020-00001-7. [DOI] [PubMed] [Google Scholar]
- Joubert J.; Dyk S. V.; Malan S. F. Small molecule fluorescent ligands as central nervous system imaging probes. Mini-Rev. Med. Chem. 2013, 13, 682–696. 10.2174/1389557511313050005. [DOI] [PubMed] [Google Scholar]
- Mizukami S.; Hori Y.; Kikuchi K. Small-Molecule-Based Protein-Labeling Technology in Live Cell Studies: Probe-Design Concepts and Applications. Acc. Chem. Res. 2014, 47, 247–256. 10.1021/ar400135f. [DOI] [PubMed] [Google Scholar]
- Cao Y.; Griffith B.; Bhomkar P.; Wishart D. S.; McDermott M. T. Functionalized gold nanoparticle-enhanced competitive assay for sensitive small-molecule metabolite detection using surface plasmon resonance. Analyst 2018, 143, 289–296. 10.1039/C7AN01680H. [DOI] [PubMed] [Google Scholar]
- Lin P.-C.; Tseng M.-C.; Su A.-K.; Chen Y.-J.; Lin C.-C. Functionalized Magnetic Nanoparticles for Small-Molecule Isolation, Identification, and Quantification. Anal. Chem. 2007, 79, 3401–3408. 10.1021/ac070195u. [DOI] [PubMed] [Google Scholar]
- Fechner P.; Bleher O.; Ewald M.; Freudenberger K.; Furin D.; Hilbig U.; Kolarov F.; Krieg K.; Leidner L.; Markovic G.; et al. Size does matter! Label-free detection of small molecule-protein interaction. Anal. Bioanal. Chem. 2014, 406, 4033–4051. 10.1007/s00216-014-7834-4. [DOI] [PubMed] [Google Scholar]
- Papalia G. A.; Leavitt S.; Bynum M. A.; Katsamba P. S.; Wilton R.; Qiu H.; Steukers M.; Wang S.; Bindu L.; Phogat S.; et al. Comparative analysis of 10 small molecules binding to carbonic anhydrase II by different investigators using Biacore technology. Anal. Biochem. 2006, 359, 94–105. 10.1016/j.ab.2006.08.021. [DOI] [PubMed] [Google Scholar]
- Myszka D. G. Analysis of small-molecule interactions using Biacore S51 technology. Anal. Biochem. 2004, 329, 316–323. 10.1016/j.ab.2004.03.028. [DOI] [PubMed] [Google Scholar]
- Wang D.; Loo J.; Chen J.; Yam Y.; Chen S.-C.; He H.; Kong S.; Ho H. Recent Advances in Surface Plasmon Resonance Imaging Sensors. Sensors 2019, 19, 1266. 10.3390/s19061266. [DOI] [PMC free article] [PubMed] [Google Scholar]
- Daaboul G.; Vedula R.; Ahn S.; Lopez C.; Reddington A.; Ozkumur E.; Ünlü M. LED-based Interferometric Reflectance Imaging Sensor for quantitative dynamic monitoring of biomolecular interactions. Biosens. Bioelectron. 2011, 26, 2221–2227. 10.1016/j.bios.2010.09.038. [DOI] [PubMed] [Google Scholar]
- Chivers C. E.; Koner A. L.; Lowe E. D.; Howarth M. How the biotin-streptavidin interaction was made even stronger: investigation via crystallography and a chimaeric tetramer. Biochem. J. 2011, 435, 55–63. 10.1042/BJ20101593. [DOI] [PMC free article] [PubMed] [Google Scholar]
- Chu F. S.; Li G. Y. Simultaneous occurrence of fumonisin B1 and other mycotoxins in moldy corn collected from the People’s Republic of China in regions with high incidences of esophageal cancer. Appl. Environ. Microbiol. 1994, 60, 847–852. 10.1128/AEM.60.3.847-852.1994. [DOI] [PMC free article] [PubMed] [Google Scholar]
- Chamberlain W.; Bacon C.; Norred W.; Voss K. Levels of fumonisin B1 in corn naturally contaminated with aflatoxins. Food Chem. Toxicol. 1993, 31, 995–998. 10.1016/0278-6915(93)90009-N. [DOI] [PubMed] [Google Scholar]
- Dubiel E. A.; Martin B.; Vigier S.; Vermette P. Real-time label-free detection and kinetic analysis of Etanercept–Protein A interactions using quartz crystal microbalance. Colloids Surf., B 2017, 149, 312–321. 10.1016/j.colsurfb.2016.10.036. [DOI] [PubMed] [Google Scholar]
- Sevenler D.; Unlu S. Numerical techniques for high-throughput reflectance interference biosensing. J. Mod. Opt. 2016, 63, 1115–1120. 10.1080/09500340.2015.1117668. [DOI] [Google Scholar]
- Chiodi E.; Sola L.; Brambilla D.; Cretich M.; Marn A. M.; Unlu M.; Chiari M. Simultaneous evaluation of multiple microarray surface chemistries through real-time interferometric imaging. Anal. Bioanal. Chem. 2020, 412, 3477–3487. 10.1007/s00216-019-02276-1. [DOI] [PubMed] [Google Scholar]
- Pei Z.; Saint-Guirons J.; Käck C.; Ingemarsson B.; Aastrup T. Real-time analysis of the carbohydrates on cell surfaces using a QCM biosensor: a lectin-based approach. Biosens. Bioelectron. 2012, 35, 200–205. 10.1016/j.bios.2012.02.047. [DOI] [PubMed] [Google Scholar]
- Sultana A.; Lee J. E. Measuring Protein-Protein and Protein-Nucleic Acid Interactions by Biolayer Interferometry. Curr. Protoc. Protein Sci. 2015, 79, 19–25. 10.1002/0471140864.ps1925s79. [DOI] [PubMed] [Google Scholar]
- Ozkumur A. Y.; Kanik F. E.; Trueb J. T.; Yurdakul C.; Ünlü M. S. Interferometric Detection and Enumeration of Viral Particles using Si-Based Microfluidics. IEEE J. Sel. Top. Quantum Electron. 2019, 25, 1–7. 10.1109/JSTQE.2018.2854548. [DOI] [Google Scholar]
- Pirri G.; Damin F.; Chiari M.; Bontempi E.; Depero L. E. Characterization of A Polymeric Adsorbed Coating for DNA Microarray Glass Slides. Anal. Chem. 2004, 76, 1352–1358. 10.1021/ac0352629. [DOI] [PubMed] [Google Scholar]
Associated Data
This section collects any data citations, data availability statements, or supplementary materials included in this article.


