

Abstract
Macrophage fusion resulting in the formation of multinucleated giant cells (MGCs) is a multistage process that requires many adhesion-dependent steps and involves the rearrangement of the actin cytoskeleton. The diversity of actin-based structures and their role in macrophage fusion is poorly understood. In this study, we revealed hitherto unrecognized actin-based zipper-like structures (ZLSs) that arise between MGCs formed on the surface of implanted biomaterials. We established an in vitro model for the induction of these structures in mouse macrophages undergoing IL-4–mediated fusion. Using this model, we show that over time MGCs develop cell–cell contacts containing ZLSs. Live-cell imaging using macrophages isolated from mRFP- or eGFP-LifeAct mice demonstrated that ZLSs are dynamic formations undergoing continuous assembly and disassembly and that podosomes are precursors of these structures. Immunostaining experiments showed that vinculin, talin, integrin αMβ2, and other components of podosomes are present in ZLSs. Macrophages deficient in WASp or Cdc42, two key molecules involved in actin core organization in podosomes, as well as cells treated with the inhibitors of the Arp2/3 complex, failed to form ZLSs. Furthermore, E-cadherin and nectin-2 were found between adjoining membranes, suggesting that the transition of podosomes into ZLSs is induced by bridging plasma membranes by junctional proteins.
INTRODUCTION
Cell–cell fusion is a fundamental property of multicellular organisms and occurs in many physiological processes, such as fertilization, bone remodeling, skeletal muscle and placenta formation, and stem cell differentiation (Chen et al., 2007; Aguilar et al., 2013; Podbilewicz, 2014). In addition, cellular fusion has been observed in numerous pathological conditions. In particular, the homotypic fusion of macrophages, leading to the formation of multinucleated giant cells (MGCs), occurs in tissues affected by chronic inflammation, including infectious and noninfectious granulomas (Helming and Gordon, 2007b). Furthermore, MGCs are a prominent component of the foreign body reaction of the host to implanted biomaterials, and their accumulation at the tissue–material interface may persist throughout the lifetime of the implant (Anderson et al., 2008). MGCs adherent to biomaterials are known to produce potent cellular products that have been proposed to degrade the biomaterial, eventually leading to device failure (Zhao et al., 1991; Sheikh and Nash, 1996; Anderson et al., 2008). MGCs are formed from blood monocytes recruited from the circulation to implant surface, where they differentiate into macrophages that undergo fusion. The T-helper 2 cytokine interleukin-4 (IL-4) participates in macrophage fusion in vivo (Kao et al., 1995) and is broadly used to study monocyte/macrophage fusion in cell cultures (McInnes and Rennick, 1988; McNally and Anderson, 1995; Moreno et al., 2007; Skokos et al., 2011; Milde et al., 2015).
Cellular fusion is a multistage process that starts with the cytokine induction of intracellular signaling that programs cells into a fusion-competent state. Adhesion of fusion-competent cells to a permissive substrate, cytoskeletal rearrangements, cell motility, and cell–cell interactions are all important determinants of macrophage fusion (Helming and Gordon, 2009). Most, if not all, of the steps involved in macrophage fusion appear to rely on the actin cytoskeleton. It has long been known that cytochalasins B and D that prevent actin polymerization also inhibit macrophage fusion (DeFife et al., 1999; Faust et al., 2019). The polymerization of actin filaments is known to be involved in the formation of diverse cellular protrusions, including lamellipodia, filopodia, and podosomes (for a review see Ridley, 2011, and Svitkina, 2013). However, the precise targets of actin-disrupting agents that inhibit macrophage fusion have not been identified. Recently, we have characterized the early steps of IL-4–mediated macrophage fusion and showed that an actin-based protrusion at the leading edge initiates macrophage fusion (Faust et al., 2019). Furthermore, we have found that fusion-competent protrusions form at the sites enriched in podosomes.
Podosomes are dot-shaped adhesion complexes formed at cell–matrix contact sites that have been identified in many cell types. Podosomes are especially prominent in cells of the monocytic lineage, including macrophages and dendritic cells, where they are associated with cell adhesion, migration, and matrix degradation (for a review see Linder et al., 2011; Murphy and Courtneidge, 2011). Structurally, podosomes consist of a core of Arp2/3-mediated branched actin filaments and actin-regulatory proteins, including WASp and cortactin. The actin core is surrounded by a ring of cytoskeletal adaptor proteins, such as talin, vinculin, and paxillin. Moreover, integrin receptors have been localized in the ring (Zambonin-Zallone et al., 1989; Pfaff and Jurdic, 2001), with integrin αMβ2 being the predominant integrin in macrophages (van den Dries et al., 2013b) and dendritic cells (Burns et al., 2004). The core and ring are linked by a myosin IIA–containing network of unbranched actin filaments (Luxenburg et al., 2007; Akisaka et al., 2008; van den Dries et al., 2013b). An additional subset of unbranched actin filaments connects individual podosomes into groups (Bhuwania et al., 2012). Furthermore, a cap at the tip of the actin core consists of formins, fascin, and other proteins (Mersich et al., 2010; Bhuwania et al., 2012; Van Audenhove et al., 2015; Panzer et al., 2016). Podosomes are dynamic structures that give rise to different morphologies in diverse cells (for a review see Linder et al., 2011). In v-Src–transformed fibroblasts, podosomes form rosettes in cell extensions. In macrophage-derived osteoclasts, initial clusters of podosomes reorganize into rings, which then fuse and finally stabilize as a continuous sealing belt. Recent studies of murine macrophages undergoing osteoclastogenesis in the presence of RANKL and osteoclasts induced in mouse bone marrow cells by RANKL/M-CSF have demonstrated podosome-related actin-based zipper-like structures (ZLSs) (Takito et al., 2012, 2017) that form at the site of cell–cell contact. Podosomes are especially dynamic in macrophages, where they undergo continuous turnover. Studies on the reorganization of podosomes in mononuclear mouse and human macrophages under nonfusogenic conditions have shown that individual podosomes can fuse into larger structures and then disassemble into smaller clusters (Evans et al., 2003; Kopp et al., 2006; Poincloux et al., 2006). However, little is known about the fate of podosomes in MGCs as these cells undergo maturation in vitro and in vivo.
In this study, we revealed actin-based ZLSs that form over time between MGCs undergoing fusion on the surface of biomaterials implanted into mice. We established an in vitro model for the induction of these structures in MGCs formed by the IL-4–mediated fusion of mouse macrophages. Using this model, we found that podosomes were the precursors of ZLSs. Moreover, in addition to actin, ZLSs contained other proteins typically found in podosomes. The transition of podosomes into ZLSs appeared to be induced upon the bridging of two plasma membranes by the junctional proteins E-cadherin and nectin-2. Thus, a novel actin-based structure was identified in macrophages undergoing fusion on implanted biomaterials, which may provide a potential target for blocking MGC formation.
RESULTS
Zipper-like actin structures formed in MGCs following biomaterial implantation
While studying the foreign body reaction to implanted biomaterials in mice, we observed heretofore unrecognized actin-based structures formed at the contact sites between MGCs. In these experiments, polychlorotrifluoroethylene (PCTFE) sections were implanted into the peritoneal cavity of C57BL/6J mice, and the formation of MGCs was monitored after 3, 7, and 14 d by labeling recovered explants with Alexa Fluor 568–conjugated phalloidin and 4′,6-diamidino-2-phenylindole (DAPI). Analyses of the samples revealed a progressive accumulation of MGCs on the biomaterial surface (Figure 1A). Furthermore, many MGC–MGC contact sites in the samples retrieved after 7 or 14 d of implantation contained areas with a seemingly symmetric and periodic actin distribution that visually resembled a zipper (Figure 1B). On the basis of this appearance, we hereafter call this actin pattern the ZLS. The ZLSs were first observed on day 7 as assessed by the measurements of the total ZLS length per high-power field (0.15 mm2), and their numbers increased by day 14 (Figure 1C). The majority of ZLSs were observed between MGCs, although they were infrequently seen at the contact sites of MGCs with mononuclear macrophages.
FIGURE 1:
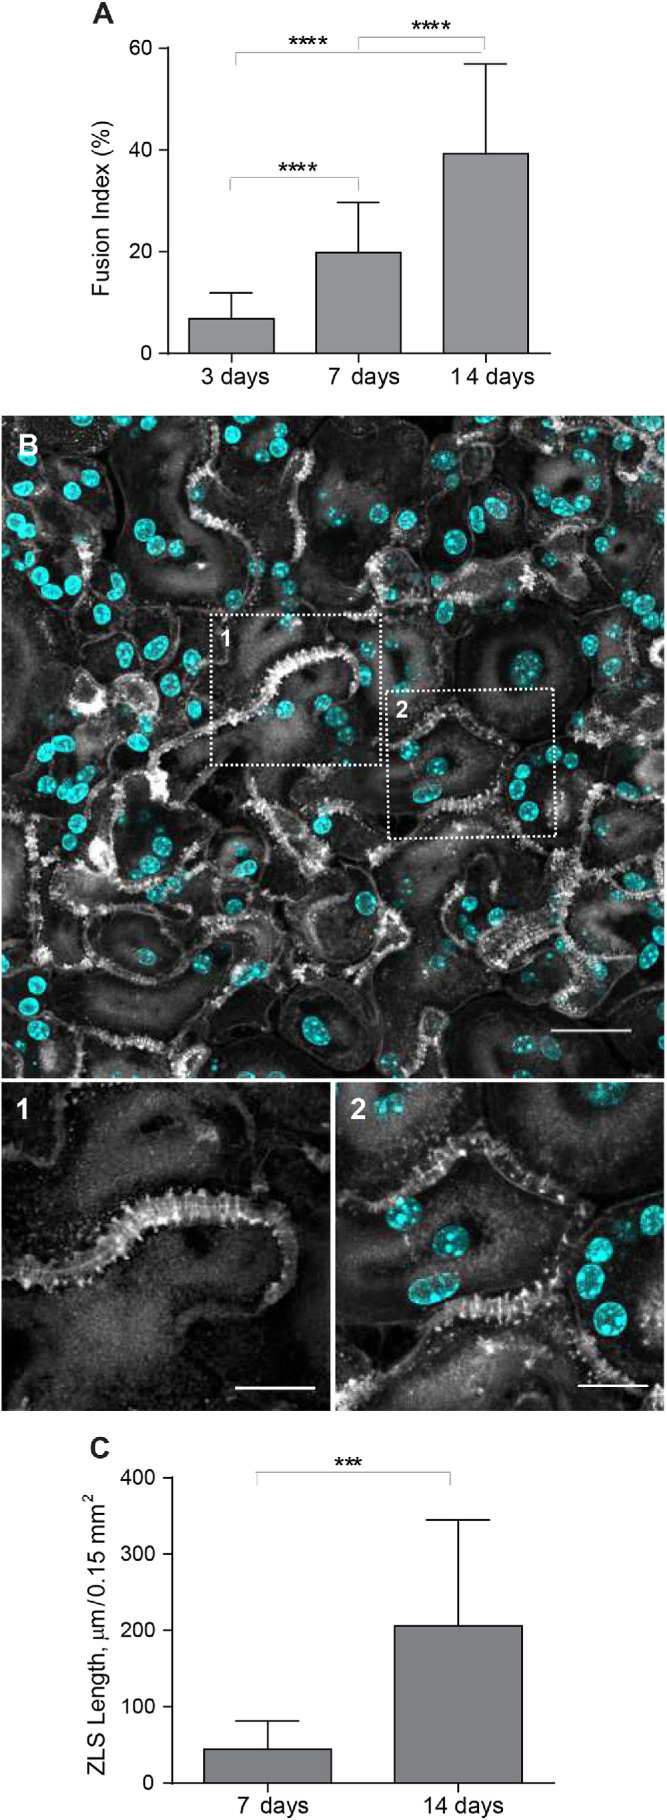
Formation of ZLSs in MGCs following biomaterial implantation. (A) Sections of the PCTFE implanted into the peritoneal cavity of mice were recovered 3, 7, and 14 d after surgery. Explants were fixed and labeled with Alexa Fluor 568–conjugated phalloidin (white) and DAPI (teal). Macrophage fusion was assessed as a fusion index, which determines the percent of cells with three or more nuclei. Results shown are mean ± SD of three independent experiments. Three to five random 20× fields were used per sample to count nuclei. ****p < 0.0001. (B) Top panel, Representative image of MGCs formed on the surfaces of the implants recovered at day 14 postsurgery. The scale bar is 20 µm. Bottom panels, High-magnification views of the boxed areas 1 and 2 shown in B. The scale bars are 10 and 15 µm for images 1 and 2, respectively. (C) Time-dependent formation of ZLSs on the PCTFE sections explanted at days 7 and 14 postsurgery. The formation of ZLSs was assessed as the total length of ZLSs per high-power field (0.15 mm2), and the determination was made using ImageJ. Results shown are mean ± SD of three independent experiments. ***p < 0.001.
Formation of ZLSs in vitro
To investigate the mechanism of ZLS formation, we established an in vitro system that allowed us to generate ZLSs reproducibly. Since PCTFE plastic is not amenable to most imaging techniques, we took advantage of recently developed optical-quality glass surfaces prepared by adsorption of long-chain hydrocarbons such as paraffin that promote high levels of macrophage fusion (Faust et al., 2017, 2018).In this series of experiments, rather than macrophage cell lines, we used primary macrophages isolated from the inflamed mouse peritoneum (Helming and Gordon, 2007a; Podolnikova et al., 2016; Faust et al., 2019) to avoid the robust proliferation observed in the cultures of macrophage cell lines. Using phase-contrast video microscopy, we determined that the kinetics of IL-4–induced macrophage fusion on paraffin-coated glass (P-surface) were similar to that on PCTFE (Figure 2, A and B). The cell fusion began 8–9 h on both surfaces after the addition of IL-4, and the maximum number of fusion events occurred after 16–20 h and then gradually declined. Furthermore, as determined by the measurements of the fusion index, the period between hours 9 and 24 was the most active period of fusion on both surfaces (Figure 2C). On the basis of this similarity, we used P-surfaces in subsequent experiments. Since we were unable to detect ZLSs after 48 h, the duration of incubation was extended to 5 d. Although the size of MGCs did not significantly change after 2 d (Supplemental Figure 1), they acquired a more round morphology by day 4 relative to the irregularly shaped MGCs formed at earlier times (Figure 2D). In addition, contacts between apposing MGCs became more frequent, with many regions displaying ZLSs (Figure 2, D, F, and F′). ZLS formation appeared to have correlated with the fusion index inasmuch as only the limited number of ZLSs was detected on poorly fusogenic acid–cleaned glasses (Figure 2, E, G, and H). The total length of ZLSs at day 5 ranged between a minimum of ∼50 µm and a maximum of ∼1460 µm/high power field (Figure 2I), and the average length of individual ZLSs was 35 ± 25 µm and varied between 6 and ∼150 µm (Figure 2J). Furthermore, increasing the seeding cell density increased the total ZLS length (Figure 2K), suggesting that contact between cells is essential for ZLS formation. After 5 d, the MGCs and mononuclear macrophages attached to the P-surface remained viable as determined by the trypan blue exclusion test (Supplemental Table 1). Based on the examination of confocal images (Figures 1B and 2, D and F), the pattern of actin distribution within ZLSs formed in vitro and in vivo appeared to be indistinguishable. In subsequent experiments, the 5-d time point was chosen to allow for sufficient ZLS formation.
FIGURE 2:

Kinetics of macrophage fusion and ZLS formation in vitro. (A, B) Macrophages were isolated from the mouse peritoneum 3 d after TG injection and plated on PCTFE sections (20 × 20 mm) or paraffin-coated cover glasses (P-surface) at 5000 cells/mm2 in DMEM/F12 supplemented with 10% FBS, and fusion was induced by the addition of IL-4 (10 ng/ml). The number of fusion events at different times was determined using phase-contrast video microscopy. Results shown are mean ± SD of three to four independent experiments. (C) Fusion indices of macrophages plated on PCTFE or P-surface determined at different time points. Results shown are mean ± SD of three independent experiments. Three to five random 20× fields were used per sample to count nuclei (total ∼6000 nuclei). (D, E) TG-elicited peritoneal macrophages were seeded at 5000 cells/mm2 on paraffin-coated (D) or acid-cleaned (E) cover glasses, and fusion was induced by the addition of IL-4 (10 ng/ml). Representative images of fusing macrophages taken at different time points are shown. The scale bars are 50 μm. (F) Representative image of an MGC formed in the 5-d culture of fusing macrophages on the P-surface. The scale bar is 30 μm. (F′) High-magnification view of a boxed area in F. The scale bar is 5 µm. (G) Time-dependent fusion of IL-4–induced macrophages on the P-surface or acid-cleaned glass. Results shown are mean ± SD of three independent experiments. (H) Total lengths of ZLSs in MGCs formed on the P-surface or acid-cleaned glass for 5 d. Results shown are mean ± SD of three independent experiments. Three to five random 20× fields were used per sample to determine the ZLS length by Image J. (I) Frequency distribution of the total ZLS lengths/high-power field in MGCs formed in the 5-d culture (n = 48). (J) Frequency distribution of individual ZLS lengths (n = 280). (K) Total lengths of ZLSs formed in the 5-d cultures of macrophages plated at different densities. Results shown are mean ± SD of three independent experiments. Three to five random 20× fields were used per sample to determine the length. ***p < 0.001; ns, nonsignificant.
The three-dimensional pattern of the actin distribution in ZLS
To examine whether ZLSs had a specific pattern, we determined their dimensional parameters using samples from 5-d MGC cultures labeled with Alexa Fluor 568–conjugated phalloidin. The periodicity of the actin distribution in ZLSs was determined from the x–y planes (Figure 3, A and B) and the height and width from the scans of fluorescence intensity of the x–z sections (Figure 3C). Actin was organized into large and small globules that formed two closely spaced “humps” originating from each MGC (Figure 3C). The average maximum height of the humps was 2.9 ± 0.5 µm (n = 64; 40 cells), and the average width was 4.8 ± 0.9 µm (n = 196; 30 cells). The distribution of the height and width values of the actin humps is shown in Supplemental Figure 2. The humps were closely abutting at the site of cell–cell contact. (Figure 3C). The average height of the region of close apposition was 1.2 ± 0.3 µm (n = 40; 20 cells). The average periodicity of the main actin foci seen in ZLSs was 2.1 ± 0.4 µm (n = 71; 30 cells) (Figure 3, B, arrowheads, and F). By fitting the diameter value distribution of the bottommost region of the large globules with a bimodal Gaussian formula, two populations were identified (Figure 3G) with average diameters of 1.2 ± 0.2 and 2.0 ± 0.3 µm (n = 100). Another feature observed in the x–y plane was the areas of actin organization that appeared as closely spaced small globules lying along the plasma membrane of two apposing MGCs (Figure 3B, arrows). The images acquired by structured illumination microscopy (SIM) showed additional details of this area (Figure 3, D and E). The space between the plasma membranes was clearly seen with small actin globules (0.24 ± 0.06 µm in diameter) positioned at seemingly regular intervals (0.2 ± 0.1 µm) at the cytosolic face of the membrane (Figure 3H). In the x–y plane, it appeared that large foci were connected to small foci by thin filaments, although such filaments were not clearly seen in some locations. Together, these analyses suggest that the actin distribution pattern in ZLS is relatively uniform.
FIGURE 3:

Three-dimensional pattern of actin distribution in ZLS. (A) MGCs formed in a 5-d culture were labeled with Alexa Fluor 568–conjugated phalloidin, and confocal images were used to analyze actin distribution in ZLSs. A representative deconvolved x–y confocal plane of a ZLS close to the substrate is shown. The scale bar is 5 μm. (B) High-magnification image of the boxed area in A. The arrowheads point to the main actin foci, and arrows point to small actin globules adjacent to the plasma membranes. The scale bar is 2.5 μm. (C) The z-scan through line 1 in B demonstrates a cross-section through the ZLS and illustrates the localization of actin in two adjacent humps. Numbers indicate the averaged dimensional parameters of the ZLS. (D) Imaging of MGCs labeled with Alexa Fluor 568–conjugated phalloidin using SIM. The scale bar is 5 μm. (E) High-magnification image of the boxed area in D. Arrowheads indicate membrane-adjacent actin globules. The scale bar is 2.5 μm. (F) Scan of fluorescence intensity (in arbitrary units) along dotted line 2 indicated in B. (G) Size distribution of the large actin globules. (H) Scan of the fluorescence intensity (in arbitrary units) along a dotted line shown in E.
ZLSs are transient actin-based arrangements formed from podosomes
Upon close examination of adjoining cells (Figure 4), we noticed that the regions of the plasma membranes just preceding the ZLSs contained actin puncta (Figure 4, enlarged boxes 1 and 2, arrows). Furthermore, actin puncta were seen in the vicinity of ZLSs (Figure 4, enlarged boxes 1 and 2, arrowheads). The actin puncta contained rings of vinculin and talin circumscribing a central actin core (Supplemental Figure 3), suggesting that these structures were podosomes, a characteristic feature of macrophages. Podosomes were often assembled into clusters of two or three podosomes, which were also surrounded by vinculin and talin. The size of individual podosomes (∼0.7 µm), as well as those in clusters, was in agreement with that determined previously in living MGCs and in fixed samples (Faust et al., 2019). Mononuclear macrophages that were observed close to MGCs also contained numerous circumferential podosomes (Figure 4, left bottom quadrant). While mononuclear macrophages occasionally formed short ZLSs with MGCs (Figure 4, enlarged box 3), they did not form ZLSs with each other. The presence of podosomes in close proximity to the site of the MGC–MGC apposition suggested that podosomes might be precursors of ZLSs.
FIGURE 4:

Podosomes as potential precursors of ZLSs. Representative image of MGCs formed in the 5-d culture of fusing macrophages. Cells were labeled with Alexa Fluor 488–conjugated phalloidin (white) and DAPI (teal). Many areas of contact between MGCs and MGC-mononuclear cells contain ZLSs, which are observed at the sites where two plasma membranes decorated with podosomes adjoin. The scale bar is 50 μm. High-magnification images of the boxed areas (1–3) illustrate the possible formation of ZLSs from podosomes. The scale bars are 5 μm.
To examine whether ZLSs originate from podosomes, we performed live-cell imaging using mRFP- or eGFP-LifeAct macrophages, which were fused by IL-4 induction for 5 d. Surprisingly, ZLSs were not as stable as appeared in the fixed specimens analyzed by immunofluorescence but were rather dynamic. The ZLSs formed from actin puncta remained seemingly stable for some time and then disassembled into actin puncta. As shown in Figure 5A and Supplemental Video 1, a nascent ZLS (00:00 min; yellow and white arrows show the top and bottom borders of the ZLS, respectively) was undergoing further organization and elongation (2:00–06:00 min). The subsequent growth of this ZLS downward from a pool of adjacent podosomes was concomitant with its disassembly upstream (Figure 5A, 10:00–22:00 min). A cloud of actin puncta emerging from the disassembled ZLS remained near the plasma membrane. Another area of the ZLS assembly and disassembly is shown in Figure 5B and Supplemental Video 2. The dismantlement of the ZLS, in this case, resulted in the separation of the two MGCs (Figure 5B, 35:00 min). The amount of time during which the membranes between different MGCs remained joined by ZLSs was 12.8 ± 3.5 min (n = 20). No correlation between the length of the ZLSs and time was found (Supplemental Figure 4).
FIGURE 5:

Live-cell imaging of ZLS formation. (A) Frames from a representative live-cell imaging experiment showing the formation of a ZLS between two MGCs formed in a 5-d culture of IL-4–induced macrophages isolated from mice expressing mRFP-LifeAct. Yellow and white arrows indicate the initial top and bottom boundaries of the nascent ZLS, respectively (00:00 min). After the period of maturation and elongation (02:00–10:00 min), the top part of the ZLS disassembles (10:00–22:00 min). The scale bar is 20 μm. See also Supplemental Video 1. (B) Frames from a movie showing the formation and disassembly of another ZLS between MGCs derived from eGFP-LifeAct macrophages. The scale bar is 5 μm. See also Supplemental Video 2.
FIGURE 10:

Analyses of E-cadherin expression in fusing macrophages and its role in ZLS formation. (A, B) Time course of E-cadherin mRNA expression in macrophages undergoing fusion in the presence of IL-4, as determined by reverse transcription PCR. Signal intensities were normalized to that of α-tubulin mRNA, and the fold change was determined relative to the control mRNA levels in freshly isolated TG-elicited macrophages (0). 0*, unstimulated macrophages adherent for 2 h before the addition of IL-4. Results shown are mean ± SD of three independent experiments. (C) Time-dependent expression of E-cadherin in fusing macrophages was quantified using immunofluorescence with anti–E-cadherin mAb followed by a secondary Alexa Fluor 546–conjugated goat anti-mouse antibody. Nuclei are stained with DAPI (teal). Representative images of E-cadherin expression for each time point are shown. The scale bar is 50 µm. (D) Quantification of fluorescence intensities of images of E-cadherin expression shown in C. Data shown are mean ± SD of three independent experiments. (E) Effect of EGTA on ZLS formation. Cells in the 5-d culture of IL-4–induced macrophages were treated with 1 mM EGTA for various periods (5–30 min). Vehicle buffer (0 min) was added to the control cells. Top panel, After being washed, samples were fixed and labeled with Alexa Fluor 546–conjugated phalloidin (white) and DAPI (teal). Bottom panel, High-magnification views of the boxed areas shown in the top panel. (F) Total lengths of ZLSs in the control (0 min) and EGTA-treated cells. Results shown are mean ± SD of three independent experiments. (G) Dose-dependent effect of EGTA on ZLS formation. Cells in the 5-d culture of IL-4–induced macrophages were treated with different concentrations of EGTA (0–0.5 mM) for 5 min, and the total lengths of ZLSs were determined. Results shown are mean ± SD of three independent experiments. (H) Effect of the anti–E-cadherin mAb DECMA-1 on ZLS formation. DECMA-1 (10 µg/ml) or isotype control IgG (10 µg/ml) was added to MGCs in the 5-d culture for 1 h before the cells were fixed. Results shown are mean ± SD of three independent experiments. ***p < 0.001.
Movie S1.
Live-cell imaging of ZLS formation. A representative time-lapse video showing the formation and disassembly of a ZLS between two MGCs formed in a 5-day culture of IL-4-induced macrophages isolated from mice expressing mRFP-LifeAct.
Movie S2.
Live-cell imaging of ZLS formation. A time-lapse video showing the formation and disassembly of another ZLS between two MGCs formed from eGFP-LifeAct-expressing macrophages.
To determine whether podosomes give rise to large actin globules in the ZLS, we conducted a series of live-cell imaging experiments performed with a better temporal resolution (∼7 s per image for 15–20 min). Tracking individual podosomes showed a single actin punctum moving toward the ZLS and then fusing with a nascent large globule, suggesting that large globules grow by sequential addition of actin from podosomes (Figure 6A and Supplemental Video 3). The large globules could also grow by accumulating small clusters consisting of two or three podosomes (Supplemental Figure 5). We also observed that large globules can be fragmented into actin puncta. As shown in Figure 6B and Supplemental Video 4, a large globule began to fragment into two smaller globules that were still associated with the ZLS. This behavior suggests that ZLSs are highly dynamic with large globules undergoing continuous turnover.
FIGURE 6:

Large globules in the ZLS grow by the addition of podosomes. (A) Frames from a representative live-cell imaging experiment (n = 9) showing fusion of a single podosome with a nascent large globule in the ZLS (top panel). Bottom panels, High-magnification images of the boxed areas. Arrows indicate two fusing actin puncta. The scale bars in the top panels are 5 µm and 1 µm in the bottom panels. (B) Frames from a representative live-cell imaging experiment (n = 10) showing fragmentation of a large globule (top panels). Bottom panels, High-magnification images of the boxed areas. Arrowheads indicate an initial large globule, which is fragmented giving rise to a smaller daughter globule (arrows). The scale bars in the top panels are 5 µm and 1 µm in the bottom panels.
Movie S3.
Large globules in the ZLS grow by the addition of podosomes. A representative video showing fusion of a single podosome with a nascent large globule within a ZLS.
Movie S4.
Large globules in the ZLS can disassemble into individual actin puncta. A representative video showing fragmentation of a large globule within the ZLS into smaller daughter globules.
ZLSs contain proteins found in podosomes
Further evidence for the podosome origin of ZLSs was obtained by immunofluorescence experiments using antibodies that recognize proteins usually found in podosomes. The defining feature of podosomes is the presence of the core of actin filaments (Linder et al., 2000; Kaverina et al., 2003) surrounded by adhesive plaque proteins, such as talin, vinculin, and integrins (Zambonin-Zallone et al., 1989; Pfaff and Jurdic, 2001). As shown in Figure 7, vinculin, talin, paxillin, cortactin, and integrin αMβ2 were detected in ZLSs. Furthermore, actin and podosome proteins were enriched on both sides of the plasma membranes. Among the podosome proteins, vinculin and talin localized in the humps, and both proteins encircled the large actin globules (Figure 7, A–F). No colocalization of vinculin or talin with actin was observed in the small globules (Figure 7, B and E). Paxillin was also found to surround the large globules (Figure 7, G and G′). Cortactin colocalized with actin in the large globules and was present in the small globules near the midline between the two MGC membranes (Figure 7, H and H′; arrowhead in the z section). The area between the humps corresponding to the site of close apposition between the plasma membranes appeared to be void of podosome-associated proteins, except for αMβ2 (Figure 7, I and I′). The integrin αMβ2 was present in the midline and also decorated the plasma membrane above the humps. Myosin II, which has been shown to localize in the area surrounding the actin core (Labernadie et al., 2010; van den Dries et al., 2013a) and to enrich in the regions of high podosome turnover (Kopp et al., 2006), was also found in ZLSs (Supplemental Figure 6A).
FIGURE 7:

Localization of podosome-specific proteins in ZLSs. Representative SIM images of MGCs in the 5-d culture induced by the addition of IL-4 (10 ng/ml) and incubated with anti-vinculin (A), anti-talin (D), anti-paxillin (G), anti-cortactin (H) and anti-αMβ2 (I) antibodies followed by corresponding secondary antibodies conjugated to Alexa Fluor 488. Actin was labeled with Alexa Fluor 568–conjugated phalloidin. Confocal x–y planes close to the substrate–attached cell surface show the distribution of actin and podosome-specific proteins. (B, E, G′, H′, I′) The z-scans across the horizontal dotted lines in the merged images shown in A, D, G, H, and I illustrate the distribution of actin and podosome-specific proteins in the humps. The midline, which defines the position of adjoining plasma membranes, is indicated by arrowheads. (C, F) Scans of fluorescence intensity of actin/vinculin and actin/talin, respectively, across the vertical dotted lines (x–y plane) shown in A and D. The scale bars are 5 μm in all x–y sections and 2 µm in all x–z sections.
It is known that the Arp2/3 complex and its activators Cdc42 and WASp nucleate the core of actin filaments in podosomes (Linder et al., 2000). We previously demonstrated that deficiency of WASp or Cdc42 or inhibition of Arp2/3 strongly reduces macrophage fusion and podosome formation (Faust et al., 2019). To examine the importance of these actin regulators in ZLS formation, we isolated macrophages from WASP–/– and myeloid cell–specific Cdc42–/– mice and tested their ability to assemble ZLSs. We observed that WASp- (Figure 8, A, B, E, and F) or Cdc42-deficient macrophages (Figure 8, C, G, and H) lost their capacities to form ZLSs in correlation with their reduced fusion capacities. In addition, the treatment of wild-type macrophages with wiskostatin, a specific inhibitor of WASp, decreased the fusion and total length of the ZLSs (Figure 8, D–F). Next, we examined whether inhibition of Arp2/3 impaired the ability of wild-type macrophages to form ZLS. As shown in Figure 8I, the Arp2/3-specific inhibitor CK-636 or CK-548 blocked ZLS formation in a dose-dependent manner. Together with live-cell video microscopy results, these data suggest that ZLSs originate from podosomes.
FIGURE 8:

Role of organizers of actin polymerization in ZLS formation. Formation of ZLS in the 5-d cultures of wild-type (A), WASp-deficient (B), or Cdc42-deficient (C) macrophages induced by the addition of IL-4 (10 ng/ml). The right panels in A and B show high-magnification images of the boxed areas in the left panels. The scale bars are 50 and 5 μm for the original and high-magnification images, respectively. (D) Effect of wiskostatin (1 µM) on the formation of ZLS. Wiskostatin was added simultaneously with IL-4. (E–H) Fusion index and the lengths of ZLSs in MGCs derived from WASp- or Cdc42-deficient macrophages or in macrophages treated with wiskostatin. Results shown are mean ± SD of three independent experiments. *p < 0.05, **p < 0.01, ***p < 0.001. (I) Effect of the Arp2/3 inhibitor CK-548 or CK-636 on ZLS formation. The total lengths of ZLSs per high-power field (0.15 mm2) were determined in MGCs formed in the 5-d cell culture.
Analyses of the junctional proteins within ZLS
Analyses of actin distribution shown in Figure 3 revealed a narrow space between adjoined MGCs, suggesting a very close apposition between the plasma membranes within ZLSs. To examine the interface between the membranes at a higher resolution, we performed transmission electron microscopy (TEM) to examine MGCs formed in the 5-d culture. Analyses of the sections taken parallel to the site of the cell attachment to substrate revealed segments of closely apposed plasma membranes with a spacing of 7.7 ± 1.3 nm (n = 30) (Figure 9A). Interestingly, the space between two membranes was not empty but was filled with a material that displayed striation in some areas (Figure 9A, inset in the left panel). To determine the nature of these electron-dense “ladders,” we performed confocal microscopy using antibodies against selected proteins, including E-cadherin, nectin-2, JAM-A, and connexin43, that are known to mediate homophilic cell–cell interactions (Figure 9, C–F). The presence of these proteins was previously reported in activated macrophages (Liu et al., 2000; Eugenin et al., 2003; Pende et al., 2006; Moreno et al., 2007; Van den Bossche et al., 2009). We also labeled cells with the lipophilic membrane stain DiD to mark the midline, which separates the two halves of the ZLS (Figure 9B, arrowhead in the right panel). Labeling with a mAb against the ectodomain of E-cadherin revealed this protein in the ZLSs (Figure 9C). E-cadherin was detected in the midline (x–y plane) and at the apposition site between the humps (x–z section). E-cadherin was also present at the ventral sides of the humps but was mainly excluded from the bodies of the humps. Both nectin-2 (Figure 9D) and JAM-A (Figure 9E) were detected in ZLSs. However, only nectin-2 was found both in the midline and at the apposition site, whereas JAM-A appeared to have colocalized with actin in the humps. Labeling for afadin, a cytosolic adaptor protein that associates with nectin-2 (Takai et al., 2008), showed its colocalization with actin in the humps (Figure 9F). Connexin43 was not detected in ZLSs. Since the tight junction protein ZO-1 has also been found in macrophages, we labeled ZLSs with anti–ZO-1 antibody; however, we were unable to detect this protein.
FIGURE 9:

Analyses of junctional proteins within ZLS. (A) Ultrastructural details of the intercellular junctions formed in a 5-d MGC examined by TEM. Representative TEM micrographs of the sections prepared by cutting the specimen parallel to the substratum. The scale bar is 100 nm. Inset in the left panel is a higher-magnification view of the boxed area. The scale bar is 20 nm. (B–F) MGCs in the 5-d culture were labeled with DiD (B) or incubated with anti–E-cadherin (C), anti–nectin-2 (D), JAM-A (E), or anti-afadin (F) antibody followed by corresponding secondary antibodies conjugated to Alexa Fluor 488. Actin was labeled with Alexa Fluor 568–conjugated phalloidin. The x–y confocal planes close to the cell–substratum attachment side (200 nm; left panels) and the x–z sections of the z stack (right panels) are shown. The scale bars are 5 and 2.5 μm for the x–y and x–z planes, respectively.
Investigations of E-cadherin and nectin-2 expression during macrophage fusion showed that E-cadherin (Figure 10A) and nectin-2 mRNAs (Supplemental Figure 7) were barely expressed in freshly isolated macrophages. E-cadherin transcript was detected 3 h after incubation of macrophages in the presence of IL-4. A ∼10-fold increase was observed after 12 h, and this level did not change after 5 d (Figure 10B). Likewise, E-cadherin was poorly expressed on the surface of macrophages before their treatment with IL-4 but gradually increased after the addition of IL-4 (Figure 10, C and D).
To investigate the contribution of E-cadherin to the adjoining of the plasma membranes within the ZLS, we treated the cells in a 5-d culture with 1 mM ethylene glycol-bis(2-aminoethylether)-N,N,N′ (EGTA). As shown in Figure 10, E and F, the treatment of cells with 1 mM EGTA for 5 min resulted in almost complete dissociation of ZLSs. The effect of EGTA was dose-dependent, with the concentration of EGTA as low as 0.06 mM reducing the formation of ZLSs by ∼90% (Figure 10G). As expected, anti–E-cadherin mAb DECMA-1 strongly inhibited the ZLS formation while isotype control immunoglobulin G (IgG1) was ineffective (Figure 10H). These data indicate that E-cadherin is required for generating ZLSs and suggest that this junctional molecule is the chief mediator of ZLS formation.
DISCUSSION
In this study, using an in vivo biomaterial implantation model we revealed actin-based ZLSs that arise at the sites of contact between large macrophage-derived MGCs. We reproduced the process of the formation of these structures in vitro and characterized their composition. Several lines of evidence indicate that ZLSs are transient dynamic structures that are formed from podosomes and disassembled into podosomes. First, the plasma membranes of two cells immediately preceding the ZLS are arrayed with podosomes. Second, podosome-specific proteins talin, vinculin, paxillin, cortactin, and integrin αMβ2 are the components of ZLSs. Third, live-cell imaging using macrophages isolated from eGFP- or mRFP-LifeAct mice enabled direct visualization of the origin of ZLS from podosomes. Finally, the organization of ZLSs requires the Arp2/3 nucleation-promoting factors WASp and Cdc42 and the Arp2/3 complex, three proteins that are also involved in podosome formation. The intercellular space between the apposing plasma membranes within ZLSs is filled with the junctional proteins E-cadherin and nectin-2, suggesting that homophilic interactions between these molecules induce ZLS assembly.
In three dimensions, ZLSs show a characteristic pattern of actin distribution. Actin is mainly concentrated in large globules that are distributed with a regular spacing of ∼2.1 µm on each side of the plasma membrane of two abutting cells (Figure 3 and schematically shown in Figure 11). In addition, actin forms the second array consisting of small globules positioned in the immediate proximity to the plasma membrane. Video recordings revealed that large actin globules are assembled from podosomes or small podosome clusters that concentrate in the vicinity of nascent ZLSs (Figures 5 and 6 and Supplemental Videos 1–3). Dynamic clusters of podosomes were previously reported in lipopolysaccharide (LPS)- and interferon gamma (INFγ)-stimulated IC-21 mouse macrophages in which podosomes fuse to form transient actin-containing clusters that vary in size (Evans et al., 2003). Likewise, LPS/IFNγ treatment of human monocyte–derived macrophages causes podosomes to cluster (Poincloux et al., 2006). The size heterogeneity of the actin core has also been observed in dendritic cells, in which a population of podosomes undergoes fusion or fission (van den Dries et al., 2013a). Therefore, it appears that large actin globules in ZLSs arise by acquiring new podosomes.
FIGURE 11:

Schematic drawing of the organization of actin and associated proteins in a ZLS. (A) Three-dimensional reconstruction of actin distribution in a ZLS formed by two abutting cells, based on confocal microscopy and SIM using cell labeling with Alexa Fluor–conjugated phalloidin. Left panel, Top view. Right panel, Bottom view. The representation of data as a heat map is shown on the right (µm). (B) Distribution of actin (red) within the large and small membrane-proximal globules in a ZLS. Based on live-cell video microscopy, large globules form from a pool of individual podosomes present in the vicinity of the plasma membranes. The podosome proteins vinculin (green) and talin (blue) surround the actin cores in large globules and individual podosomes. E-cadherin (orange) holds the two plasma membranes (black lines). Afadin (not shown in this figure) and other unknown scaffold proteins may organize actin and its associated proteins into highly symmetrical ZLS structures. (C) Vertical section across two large actin globules in a ZLS.
As determined from the fluorescence micrographs of fixed specimens (Figure 3G), two populations of large globules were identified with average diameters of 1.2 ± 0.2 and 2.0 ± 0.3 µm. These diameters are greater than that of individual podosomes (0.7 ± 0.2 µm), suggesting that at the cell–substrate surface, large globules may contain two to three individual podosomes. However, since the height of large globules is ∼2.9 µm and the reported height of podosomes is 0.4–0.6 µm (Linder, 2007; Labernadie et al., 2010), the calculated volume of large globules and podosomes is ∼1.2 and ∼0.17 µm3, respectively, based on the assumption of their shape as a circular, slightly truncated cone (Linder, 2007). These values imply that large globules can theoretically accumulate actin from approximately seven individual podosomes. However, while podosome clusterization at the cell–substrate surface can be readily envisioned, how large globules grow in the z dimension is unclear. Nonetheless, the relatively uniform dimensions of ZLSs suggest that only a limited number of podosomes can supply actin to large globules, indicating that their size is regulated.
A striking feature of ZLSs is that actin foci, large or small, are correctly aligned against each other on both sides of the cell–cell interface and equidistant from the plasma membrane, implicating undefined scaffold proteins in ZLS formation. It is worth noting that a distinctive pattern of actin distribution is clearly seen only in the x–y plane and cannot be easily discerned in the z-direction, especially in the region adjacent to the plasma membrane (Figure 3 and schematically shown in Figure 11). The z scans show that actin within large globules is connected with actin in small globules, although its nature, as well as that of small globules, is not clear. The humps formed of large and small actin globules also contain proteins typically found in podosomes, including talin, vinculin, paxillin, cortactin, and integrin αMβ2 (Figures 7 and 11). Among these proteins, talin and vinculin encircle actin cores in large foci (Figure 7, A–F). The distribution of cortactin and αMβ2 differs from that of other proteins (Figure 7). Interestingly, both cortactin and αMβ2 were observed in the midline, suggesting that these proteins are positioned close to the membrane. However, since αMβ2 was detected using mAb M1/70 directed against the ligand-binding domain of integrin, these data indicate that αMβ2 is present in the intercellular space. In the scheme shown in Figure 11, we take this distribution of actin and ZLS-associated vinculin and talin into account, although further studies are required to determine the complex organization of a ZLS.
The ZLSs formed only after a prolonged period of adhesion of MGCs to the surface of biomaterials in vivo and after several days of incubation with IL-4 in a culture medium in vitro. By this time, the majority of MGCs appear as large spread cells that form extensive contacts with each other, apparently facilitating ZLS formation. Our live-cell imaging analyses revealed that ZLSs are dynamic structures with an average lifespan of ∼13 min. Notably, the assembly of ZLSs seems to occur in a sequential manner, visually resembling a fastener that moves in one direction, “zippering up” plasma membranes. The zippering mechanism is apparently enacted by E-cadherin and nectin-2, which are detected in the intercellular space of ZLSs. In agreement with previous data (Moreno et al., 2007; Van den Bossche et al., 2009), E-cadherin mRNA was poorly detected in freshly isolated macrophages but was gradually expressed and peaked within 12 h of IL-4 addition and remained stable after 5 d. Moreover, while the protein was weakly expressed on the surface of freshly plated macrophages, its expression was readily detectable by 24 h and gradually up-regulated over 5 d (Figure 10). Since ZLSs were first detected at day 4, either the critical level of E-cadherin or the required level of cell spreading or both may be an essential requisite of ZLS formation. Similar to E-cadherin, nectin-2 mRNA was not detected in freshly isolated macrophages but was expressed several hours after incubation in the presence of IL-4. Nonetheless, E-cadherin appears to play a dominant role in ZLS formation inasmuch as sequestration of Ca2+ by EGTA or blocking E-cadherin with an anti–E-cadherin antibody effectively disrupted ZLSs (Figure 10).
E-cadherin and nectin-2 are typical components of adherens junctions (AJs) in epithelial and other cells (Takai et al., 2008; Harris and Tepass, 2010; Takeichi, 2014). In AJs, Ca2+-dependent cadherin molecules associate with the actin cytoskeleton, strengthening intercellular adhesions. Moreover, another intercellular adhesion system consisting of the Ca2+-independent nectin molecules and nectin-binding adaptor protein afadin, which connects nectin to actin, plays a role in the organization of AJs, either cooperatively with or independently of cadherin (Takai et al., 2008). E-cadherin and nectin-2 were previously identified in monocytes/macrophages (Pende et al., 2006; Moreno et al., 2007; Van den Bossche et al., 2009). The surprising finding of the present study is that these molecules, together with afadin, were found in ZLSs, suggesting that they can form AJ-like structures in mature MGCs. Epithelial AJs have traditionally been classified into two major groups based on their dynamics and on how they associate with actin filaments (Franke, 2009; Takeichi, 2014). The linear AJ (lAJs) that connect mature epithelial cells link with a bundle of linear actin filaments that runs parallel to the cell borders and are relatively stable. The punctate AJs (pAJs) that are found at the edges of epithelial colonies and in other cell types associate with radial actin bundles and are mobile, morphologically unstable structures (Takai et al., 2008; Takeichi, 2014; Indra et al., 2018). E-cadherin is also observed at lateral cell–cell contacts below the lAJ, where it associates with an amorphous actin network (Takeichi, 2014). There are several notable differences between the ZLS-type junctions in MGCs and AJs in epithelial cells. First, in contrast to AJs, the transient nature of the ZLS-type junctions suggests that they are held by weak interactions. Although pAJs have been described as mobile structures, this behavior is referred to as the ability of cadherin molecules to be released and then reassemble within cadherin clusters (Indra et al., 2018). Hence, the dynamic behavior of pAJs is related to the continuous turnover of cadherin molecules while still maintaining their overall stability. In contrast, an entire ZLS can form and disassemble in one location while a new ZLS appears in another location. Second, the distribution of actin in ZLSs is distinct from that observed in AJs. Neither parallel actin filaments similar to those in lAJ nor pAJ-associated long filaments that perpendicularly terminate at the plasma membrane have been detected in ZLSs. Rather, actin is organized within regular foci that resemble large podosome clusters observed in nonfusing mouse macrophages (Evans et al., 2003). Third, in contrast to lAJs that may encircle cells, ZLSs form discontinuous segments at the sites where MGCs contact each other. In this regard, ZLSs are reminiscent of cell–cell junctions formed in fibroblasts and other motile cells, in which they are observed as punctate and streak-like structures (Yonemura et al., 1995; Takeichi, 2014). Fourth, the intermembrane space in a ZLS determined by TEM was 7.7 ± 1.3 nm, significantly narrower than ∼15–25 nm in epithelial AJs (Farquhar and Palade, 1963; Miyaguchi, 2000). Thus, despite the presence of some typical AJ proteins and actin, many features of the ZLS-type junctions in MGCs distinguish them from AJs and other cell–cell junctions, suggesting that these adhesive structures may represent a novel type of AJ. Recently, a report has shown that mononuclear macrophages in the granuloma of zebrafish infected with mycobacteria can form AJs (Cronan et al., 2016). Since MGCs are the characteristic feature of granulomas in tuberculosis and E-cadherin expression has been detected in macrophages from human and mouse samples (Cronan et al., 2016), it will be interesting to examine whether MGCs in granulomas also form ZLSs.
In addition to E-cadherin and nectin-2, integrin αMβ2, which is known to associate with podosomes in macrophages (Duong and Rodan, 2010; van den Dries et al., 2013a), was found in the intercellular space of ZLSs. Integrin αMβ2 is a multiligand receptor that can engage several counterreceptors, including members of the ICAM and JAM protein families (Diamond et al., 1990; Santoso et al., 2002). This receptor may contribute to heterophilic interactions that hold two membranes in the ZLS together. We have recently demonstrated that αMβ2 can interact with SIRPα (also known as the macrophage fusion receptor, MFR) which, similarly to ICAMs and JAMs, belongs to the Ig superfamily (Podolnikova et al., 2019). However, while SIRPα was strongly expressed in ZLSs (Supplemental Figure 6B), it was not present in the midline, suggesting that SIRPα and αMβ2 do not colocalize. At present, the counterreceptor of αMβ2 and its contribution to ZLS formation remain to be determined.
We have recently demonstrated that in vitro macrophage fusion occurs in three overlapping steps (Faust et al., 2017). Several hours after IL-4 induction, a founder population of mononuclear macrophages initiates fusion with neighboring mononuclear macrophages. These early multinucleated cells then fuse with neighboring mononuclear macrophages, and finally, MGCs fuse with surrounding MGCs to form syncytia. Our current studies suggest that the formation of ZLSs is a late-stage event in multinucleation. Since similar structures form in late MGCs on the surfaces of implanted biomaterials, these data indicate that ZLSs are not in vitro artifacts. However, the role of these enigmatic structures is unclear. It is well-known that when motile cells establish cell–cell junctions they cease movement and proliferation, a phenomenon referred to as contact inhibition of cell movement and proliferation (Fisher and Yeh, 1967; Bell, 1978). Since peritoneal macrophages do not divide, it is unlikely that ZLSs function in blocking cell proliferation signals. Therefore, the role of ZLSs in suppressing migration of MGCs as well as mononuclear cells that occasionally form ZLSs with MGCs can be theoretically envisioned. Our studies demonstrate that MGCs remain viable after establishing ZLSs. This observation is consistent with a well-known fact that cells that establish cell–cell junctions and stop moving continue to survive. Another possibility is that ZLSs may be involved in proteolysis. Podosomes have been associated in vitro with extracellular matrix (ECM) degradation in many cell types, including macrophages (Linder et al., 2011). This is achieved by the recruitment and localized release of matrix metalloproteinases (MMPs) as well as serine and cathepsin proteinases. Among MMPs, MT1-MMP has been shown to degrade the ECM in primary macrophages (Wiesner et al., 2010, 2014). However, although we observed MT1-MMP in mononuclear macrophages and early MGCs, we were not able to detect this protease in ZLSs (Supplemental Figure 6C). At present, the involvement of other proteases that can be recruited with podosomes to ZLSs remains to be defined.
Recent studies have demonstrated ZLSs in cultures of the murine macrophage cell line RAW267.4 undergoing osteoclastogenesis in the presence of RANKL and in osteoclasts induced in mouse bone marrow cells by RANKL/M-CSF (Takito et al., 2012, 2017). Although osteoclast ZLSs and the ZLSs observed in the current study share similar features, such as overall visual appearance, transient nature, and association with podosomal proteins, there are clear differences between these two structures. First, two types of ZLSs have been found in osteoclasts. The first type has been observed at the ventral membrane of a single multinucleated osteoclast that formed as a result of fusion of mononuclear cells and was interpreted as the structure joining actin rings of individual cells remaining after fusion. Such compartmentalization of the ventral membrane was not observed in IL-4–induced MGCs. We invariably observed ZLSs only between the plasma membranes of two large apposing MGCs (and rarely between an MGC and mono/binuclear cell). The ZLS structures in our experiments seem to resemble another type of ZLS that was observed in mature osteoclasts (Takito et al., 2017). Second, in contrast to MGCs, the ZLSs in osteoclasts were negative for E-cadherin, β-catenin, and nectin-2 staining (Takito et al., 2012). Third, the dimensional parameters of ZLSs in mature osteoclasts are different from those in MGCs, with the average width of the ZLSs in osteoclasts being almost twice larger than that in MGCs (∼8.4 vs. ∼4.8 µm, respectively). Fourth, perhaps the most striking difference between the ZLSs in MGCs and those in osteoclasts is the mechanisms of their formation. Although both structures are highly dynamic, the ZLSs in MGCs are formed from podosomes or podosome clusters and disassemble into podosomes, whereas the ZLSs in osteoclasts result from continuous retrograde actin flow and are independent of the dissolution and reformation of podosomes (Takito et al., 2017). It has been proposed that this actin flow generates forces that push the plasma membranes of neighboring osteoclasts at cell–cell contact sites to generate the ZLSs. While this is an attractive possibility, our results also suggest that the formation of ZLSs in MGCs is triggered by the interaction of E-cadherin molecules through the zippering mechanism. Finally, the ZLSs in osteoclasts have been proposed to be involved in cell–cell fusion (Takito et al., 2012). This scenario differs from our findings. Since the ZLSs in MGCs materialize only in extended IL-4–induced cultures by the time the cell fusion largely ceases (Figure 2, G and H), it is unlikely that they are involved in fusion. Indeed, among the 20 ZLSs analyzed by live-cell imaging, we were able to detect only one fusion event that occurred at the site of the ZLS. Thus, the kinetics and morphological differences between ZLSs in osteoclast and MGCs indicate that the definitive description of ZLSs during osteoclastogenesis and MGC formation and their functional roles may require further analysis.
In conclusion, our in vivo and in vitro studies demonstrate the formation of highly ordered actin-based ZLSs that originate from podosomes and link the plasma membranes of two large MGCs. Given the fact that macrophage-derived MGCs and their secreted products may modulate the foreign body reaction to implanted biomaterials and ultimately wound healing (Anderson et al., 2008; Jones et al., 2008), the mechanisms underlying the assembly of podosome-derived ZLSs and their role in the foreign body reaction merit further analyses.
MATERIALS AND METHODS
Reagents
The rat mAb M1/70, which recognizes the mouse αM integrin subunit, was purified from the conditioned media of hybridoma cells (obtained from the American Type Culture Collection, Manassas, VA) using protein A agarose. The mouse anti-talin (catalogue #T3287), anti-vinculin (catalogue #V9131) mAbs, and rabbit anti–I/S-afadin polyclonal antibody (catalogue #A0224) were from Sigma (St. Louis, MO). The rabbit anti-paxillin (catalogue #32084) and anti-JAM-A (catalogue #180821) polyclonal antibodies and rabbit anti-cortactin mAb conjugated to Alexa Fluor 555 (catalogue #ab215298) were from Abcam (Cambridge, MA). The rat anti–nectin-2 (catalogue #sc-502-57) mAb and the rat anti–E-cadherin mAb DECMA-1 (catalogue #sc-59778) were from Santa Cruz Biotechnology (Dallas, TX). The mouse anti–E-cadherin mAb (catalogue #3195T), rabbit anti–myosin IIa polyclonal antibody (catalogue #34035), and the mouse IgG1 isotype control (catalogue #5415) were from Cell Signaling (Danvers, MA). The rat anti-SIRPα/CD172a polyclonal antibody (catalogue #552371) was from BD Bioscience (San Jose, CA). The rabbit anti–MT1-MMP-14 polyclonal antibody (catalogue #14552-1-AP) was from Proteintech (Rosemont, IL). The rabbit anti–ZO-1 polyclonal antibody (catalogue #61-7300) and secondary antibodies Alexa Fluor 488–conjugated goat anti-rabbit IgG and Alexa Fluor 633–conjugated goat anti-rat IgG were from Invitrogen (Carlsbad, CA). Vibrant DiD membrane-labeling reagent was from Thermo Fisher (Waltham, MA). Brewer’s thioglycollate (TG), wiskostatin, and the Arp2/3 inhibitors CK-548 and CK-636 were from Sigma (St. Louis, MO). IL-4 was from Genscript (Piscataway, NJ).
Mice
C57BL/6J and WASp–/– (B6.129S6-Wastm1Sbs/J) mice were purchased from the Jackson Laboratory (Bar Harbor, ME). EGFP and mRFP-LifeAct mice (Riedl et al., 2010) were gifts from Janice Burkhardt (University of Pennsylvania, Perelman School of Medicine) and were used with permission from Roland Wedlich-Söldner (Institute of Cell Dynamics and Imaging, University of Münster). Myeloid cell–specific Cdc42–/– mice were generated by crossing Cdc42loxP/loxP mice with LysMcre mice, followed by screening the progeny for Cdc42 excision in myeloid leukocytes as previously described (Faust et al., 2019). All animals were given ad libitum access to food and water and maintained at 22°C on a 12-h light/dark cycle. Experiments were performed according to animal protocols approved by the Institutional Animal Care and Use Committees at Arizona State University.
Biomaterial implantation
Segments (1.5 × 0.5 cm) of sterile PCTFE were implanted into the peritoneum of age- and sex-matched mice. Animals were humanely sacrificed 3, 7, and 14 d later, and explants were analyzed for the presence of MGC as previously described (Faust et al., 2019). Before explantation, 2 ml of phosphate-buffered saline (PBS) containing 5 mM EDTA was aseptically injected into the peritoneum, and cells in the peritoneum were collected by lavage. The number of cells in the peritoneum at the time of explantation was determined by counting with a Neubauer hemocytometer. Experiments were conducted in triplicate on three independent days.
Macrophage isolation
Macrophages were isolated from 8–12-wk-old male and female age- and sex-matched mice injected (intraperitoneally) with 0.5 ml of a sterile 4% Brewer’s TG solution. All animals were humanely killed 72 h later, and macrophages were isolated by lavage with ice-cold PBS (pH 7.4) containing 5 mM EDTA. Macrophages were counted with a hemocytometer immediately thereafter.
IL-4–induced macrophage fusion
Macrophage fusion was induced as previously described (Faust et al., 2019). Briefly, peritoneal cells (5 × 10⁶ cells/ml) in Hank’s balanced salt solution (HBSS; Cellgro, Manassas, VA) supplemented with 0.1% bovine serum albumin were applied to acid-cleaned or paraffin-coated glass coverslips (prepared as described by Faust et al., 2017, 2018). Cells were incubated in 5% CO2 at 37°C for 30 min. Nonadherent cells were removed by washing the culture three times with HBSS, and then the adherent cells were cultured with DMEM/F12 containing 15 mM HEPES (Cellgro, Manassas, VA), 10% fetal bovine serum (FBS) (Atlanta Biological, Flowery Branch, GA) and 1% antibiotics (Cellgro, Manassas, VA). After 2 h, 10 ng/ml IL-4 was added to the cultures until the indicated time points. For the 5-d cultures, media were changed on day 3. The fusion indices were determined from the images of cells labeled with Alexa Fluor 568–conjugated phalloidin (Thermo Scientific, Waltham, MA) and DAPI as previously described (Faust et al., 2019). The fusion index is defined as the fraction of nuclei within MGCs and expressed as the percentage of the total nuclei counted. A total of 18–20 images (20 or 40×) that contained ∼100–300 cells were analyzed for each experimental condition. The lengths of ZLSs were determined with ImageJ software (National Institutes of Health). Photomicrographs of representative fields were obtained with a Leica SP8 microscope (Leica Microsystems, Buffalo Grove, IL).
Phase-contrast video microscopy
Wild-type, WASp-deficient, and Cdc42-deficient macrophages (5 × 10⁶/ml) isolated from the peritoneum of mice 3 d after TG injection were plated on the surface of paraffin-coated coverslips or a section of PCTFE, and cell fusion was induced by adding 10 ng/ml IL-4. Dishes were transferred from the cell culture incubator to a stage-top incubator calibrated to maintain a humidified atmosphere of 5% CO2 in air at 37°C. Phase-contrast images were collected with a 20× objective every 30 s using an EVOS FL Auto (Thermo Scientific, Waltham, MA) and transferred to ImageJ to generate movies.
Live-cell fluorescence microscopy
EGFP or mRFP-LifeAct macrophages were isolated from the peritoneum of TG-induced mice. Macrophages (106/0.5 ml) were plated on the surface of coverslips adsorbed with paraffin and incubated in the presence of 10 ng/ml IL-4. After 3 d, half of the DMEM/F12 was replaced with fresh medium without IL-4, and the cell culture was incubated for an additional 2 d. The dish was placed into a live-cell imaging chamber supplied with 5% CO2 at 37°C, and live imaging was conducted for 6 h. Images were acquired by a Leica SP8 with a 40×/1.3 NA oil objective every 7 or 60 seconds using a HyD hybrid detector. The acquired images were processed and converted into movies using ImageJ software.
Immunofluorescence
At the indicated time points, cells cultured on clean glass or paraffin-coated coverslips were fixed with 2% paraformaldehyde in PBS for 30 min, permeabilized with 0.2% Tween-20 in PBS for 15 min at 22°C, and then washed with PBS. The permeabilization step was omitted for the staining of transmembrane proteins. The cells were incubated overnight at 4°C with the primary antibodies using the dilutions recommended by the manufacturers. Incubations with Alexa Fluor (488, 568, or 647)-conjugated secondary antibodies were performed at room temperature for 4 h. Cells were also stained with 15 nM Alexa Fluor 568–conjugated phalloidin for 30 min at 22°C to detect F-actin. Cells were washed twice with PBS and incubated with DAPI. ProLong Diamond Antifade Mountant was used to mount the cells on a glass slide (Thermo Scientific, Waltham, MA). Images were acquired by using Leica SP8 and Zeiss LSM800 confocal microscopes (Carl Zeiss Vision, San Diego, CA) with 40×/1.3 NA and 60x/1.4 oil immersion objectives, respectively. Superresolution images were acquired using a Nikon SIM (Nikon Instruments, Melville, NY) with an SR Apo TIRF 100×/1.49 NA oil immersion objective.
Reverse transcription PCR (RT-PCR) analysis of E-cadherin and nectin-2 expression
Macrophages were induced to fuse by IL-4 for the indicated periods. Total RNA was extracted using TRIzol reagent (Invitrogen) and resuspended in 20 μl of RNase-free water supplemented with 0.1 mM EDTA. Total RNA (1 μg) was used to generate cDNA using SuperScript III Reverse Transcriptase (Invitrogen). PCR was performed with the generated cDNA and premixed 2× Taq polymerase solution (Promega) in an MJ Mini Thermal Cycler (BioRad). The levels of target mRNAs were normalized by the Tuba1b mRNA level. The primer sets for PCR analyses were purchased from Integrated DNA Technologies (USA) and included those for Tuba1b, 5′-CAGGTCTCCAGGGCTTCTTG-3′ (forward) and 5′-GAAGCATCAGTGCCTGCAAC-3′ (reverse); for Cdh1, 5′-CGGGACTCCAGTCATAGGGA-3′ (forward) and 5′-ACTGCTGGTCAGGATCGTTG-3′ (reverse); and for Nectin2,5′-GTTCAGCAAGGACCGTCTGTC-3′ (forward) and 5′-ATCGTAGGATCCTCTGTCGC-3′ (reverse). The semiquantitative digital analysis was performed using ImageJ software. The pixel density for each band was calculated in arbitrary units and is expressed as a fold change relative to the target mRNA level in macrophages in suspension (denoted 0).
TEM
TG-elicited peritoneal macrophages were seeded on a PCTFE section (Welch Fluorocarbon, Dover, NH) and cultured in DMEM/F12 supplemented with 15 mM HEPES, 10% FBS, and 1% antibiotics. After 2 h, 10 ng/ml IL-4 was added to cultures, and cells were incubated for 5 d. Cells were fixed with 2.5% glutaraldehyde in 0.1 M PBS (pH 7.4) at 4°C overnight and then treated with 1% OsO4 in 0.1 M PBS for 1 h. Subsequently, cells were washed with 0.1 M PBS and then dehydrated using acetone. Finally, cells were flat-embedded into Spur’s EPOXY Resin, and 70-nm sections were obtained by slicing parallel to the site of the cell attachment to substrate. Sections were poststained with uranyl acetate and Sato’s lead citrate. Micrographs were taken using a Philips CM 12 TEM with a Gatan model 791 camera.
Statistical analyses
Unless otherwise indicated, results are shown as mean ± SD of three independent experiments. Multiple comparisons were made by using analysis of variance followed by Tukey’s or Dunn’s posttest using GraphPad Instat software. Where applicable, means were compared with each other by using Student’s t test. Data were considered significantly different if p < 0.05.
Supplementary Material
Acknowledgments
We thank James Faust for helpful advice on performing phase-contrast live-cell video experiments and Page Baluch for anti–ZO-1 antibodies. This work was supported by National Institutes of Health (NIH) grants HL63199 (T.P.U.) and R00NS076661 and R01NS097537 (J.M.N.). We acknowledge the use of facilities within the Eyring Materials Center at Arizona State University supported in part by (National Nanotechnology Coordinated Infrastructure-Electrical, Communications and Cyber Systems) NNCI-ECCS-1542160. Image data were collected using a Leica TCS SP5 LSCM (NIH SIG award S10 RR027154) and Leica TCS SP8 LSCM (NIH SIG award S10 OD023691) housed in the W.M. Keck Bioimaging Facility at Arizona State University.
Abbreviations used:
- AJ
adherens junction
- BSA
bovine serum albumin
- DAPI
4′,6-diamidino-2-phenylindole
- EGTA
ethylene glycol-bis(2-aminoethylether)- N, N, N′
- HBSS
Hank’s balanced salt solution
- ICAM-1
intercellular adhesion molecule-1
- IL-4
interleukin-4
- LPS
lipopolysaccharide
- M-CSF
macrophage colony-stimulating factor
- MGC
multinucleated giant cell
- MMPs
matrix metalloproteinases
- PBS
phosphate-buffered saline
- PCTFE
polychlorotrifluoroethylene
- RANKL
receptor activator of nuclear factor kappa-B ligand
- TG
thioglycollate
- WASp
Wiscott-Aldrich syndrome protein
- WT
wild type
- ZLS
zipper-like structure.
Footnotes
This article was published online ahead of print in MBoC in Press (http://www.molbiolcell.org/cgi/doi/10.1091/mbc.E19-12-0707) on June 24, 2020.
REFERENCES
- Aguilar PS, Baylies MK, Fleissner A, Helming L, Inoue N, Podbilewicz B, Wang H, Wong M. (2013). Genetic basis of cell-cell fusion mechanisms. Trends Genet , 427–437. [DOI] [PMC free article] [PubMed] [Google Scholar]
- Akisaka T, Yoshida H, Suzuki R, Takama K. (2008). Adhesion structures and their cytoskeleton-membrane interactions at podosomes of osteoclasts in culture. Cell Tissue Res , 625–641. [DOI] [PubMed] [Google Scholar]
- Anderson JM, Rodriguez A, Chang DT. (2008). Foreign body reaction to biomaterials. Semin Immunol , 86–100. [DOI] [PMC free article] [PubMed] [Google Scholar]
- Bell PB., Jr (1978). Contact inhibition of movements in transformed and nontransformed cells. Birth Defects Orig Artic Ser , 177–194. [PubMed] [Google Scholar]
- Bhuwania R, Cornfine S, Fang Z, Kruger M, Luna EJ, Linder S. (2012). Supervillin couples myosin-dependent contractility to podosomes and enables their turnover. J Cell Sci , 2300–2314. [DOI] [PMC free article] [PubMed] [Google Scholar]
- Burns S, Hardy SJ, Buddle J, Yong KL, Jones GE, Thrasher AJ. (2004). Maturation of DC is associated with changes in motile characteristics and adherence. Cell Motil Cytoskeleton , 118–132. [DOI] [PubMed] [Google Scholar]
- Chen EH, Grote E, Mohler W, Vignery A. (2007). Cell-cell fusion. FEBS Lett , 2181–2193. [DOI] [PubMed] [Google Scholar]
- Cronan MR, Beerman RW, Rosenberg AF, Saelens JW, Johnson MG, Oehlers SH, Sisk DM, Jurcic Smith KL, Medvitz NA, Miller SE, et al. (2016). Macrophage epithelial reprogramming underlies mycobacterial granuloma formation and promotes infection. Immunity , 861–876. [DOI] [PMC free article] [PubMed] [Google Scholar]
- DeFife KM, Jenney CR, Colton E, Anderson JM. (1999). Disruption of filamentous actin inhibits human macrophage fusion. FASEB J , 823–832. [DOI] [PubMed] [Google Scholar]
- Diamond MS, Staunton DE, de Fougerolles AR, Stacker SA, Garcia-Aguilar J, Hibbs ML, Springer TA. (1990). ICAM-1 (CD54) — a counter-receptor for Mac-1 (CD11b/CD18). J Cell Biol , 3129–3139. [DOI] [PMC free article] [PubMed] [Google Scholar]
- Duong LT, Rodan GA. (2010). Pyk2 is an adhesion kinase in macrophages, localized in podosomes and activated by β2-integrin ligation. Cell Motil Cytoskeleton , 174–188. [DOI] [PubMed] [Google Scholar]
- Eugenin EA, Branes MC, Berman JW, Saez JC. (2003). TNF-alpha plus IFN-gamma induce connexin43 expression and formation of gap junctions between human monocytes/macrophages that enhance physiological responses. J Immunol , 1320–1328. [DOI] [PubMed] [Google Scholar]
- Evans JG, Correia I, Krasavina O, Watson N, Matsudaira P. (2003). Macrophage podosomes assemble at the leading lamella by growth and fragmentation. J Cell Biol , 697–705. [DOI] [PMC free article] [PubMed] [Google Scholar]
- Farquhar MG, Palade GE. (1963). Junctional complexes in various epithelia. J Cell Biol , 375–412. [DOI] [PMC free article] [PubMed] [Google Scholar]
- Faust JJ, Balabiyev A, Heddleston JM, Podolnikova NP, Baluch DP, Chew TL, Ugarova TP. (2019). An actin-based protrusion originating from a podosome-enriched region initiates macrophage fusion. Mol Biol Cell , 2254–2267. [DOI] [PMC free article] [PubMed] [Google Scholar]
- Faust JJ, Christenson W, Doudrick K, Heddleston J, Chew TL, Lampe M, Balabiyev A, Ros R, Ugarova TP. (2018). Fabricating optical-quality glass surfaces to study macrophage fusion. J Vis Exp , 56866. [DOI] [PMC free article] [PubMed] [Google Scholar]
- Faust JJ, Christenson W, Doudrick K, Ros R, Ugarova TP. (2017). Development of fusogenic glass surfaces that impart spatiotemporal control over macrophage fusion: direct visualization of multinucleated giant cell formation. Biomaterials , 160–171. [DOI] [PMC free article] [PubMed] [Google Scholar]
- Fisher HW, Yeh J. (1967). Contact inhibition in colony formation. Science , 581–582. [DOI] [PubMed] [Google Scholar]
- Franke WW. (2009). Discovering the molecular components of intercellular junctions—a historical view. Cold Spring Harb Perspect Biol , a003061. [DOI] [PMC free article] [PubMed] [Google Scholar]
- Harris TJ, Tepass U. (2010). Adherens junctions: from molecules to morphogenesis. Nat Rev Mol Cell Biol , 502–514. [DOI] [PubMed] [Google Scholar]
- Helming L, Gordon S. (2007a). Macrophage fusion induced by IL-4 alternative activation is a multistage process involving multiple target molecules. Eur J Immunol , 33–42. [DOI] [PubMed] [Google Scholar]
- Helming L, Gordon S. (2007b). The molecular basis of macrophage fusion. Immunobiology , 785–793. [DOI] [PubMed] [Google Scholar]
- Helming L, Gordon S. (2009). Molecular mediators of macrophage fusion. Trends Cell Biol , 514–522. [DOI] [PubMed] [Google Scholar]
- Indra I, Choi J, Chen CS, Troyanovsky RB, Shapiro L, Honig B, Troyanovsky SM. (2018). Spatial and temporal organization of cadherin in punctate adherens junctions. Proc Natl Acad Sci USA , E4406–E4415. [DOI] [PMC free article] [PubMed] [Google Scholar]
- Jones JA, McNally AK, Chang DT, Qin LA, Meyerson H, Colton E, Kwon IL, Matsuda T, Anderson JM. (2008). Matrix metalloproteinases and their inhibitors in the foreign body reaction on biomaterials. J Biomed Mater Res A , 158–166. [DOI] [PubMed] [Google Scholar]
- Kao WJ, McNally AK, Hiltner A, Anderson JM. (1995). Role for interleukin-4 in foreign-body giant cell formation on a poly(etherurethane urea) in vivo. J Biomed Mater Res , 1267–1275. [DOI] [PubMed] [Google Scholar]
- Kaverina I, Stradal TE, Gimona M. (2003). Podosome formation in cultured A7r5 vascular smooth muscle cells requires Arp2/3-dependent de-novo actin polymerization at discrete microdomains. J Cell Sci , 4915–4924. [DOI] [PubMed] [Google Scholar]
- Kopp P, Lammers R, Aepfelbacher M, Woehlke G, Rudel T, Machuy N, Steffen W, Linder S. (2006). The kinesin KIF1C and microtubule plus ends regulate podosome dynamics in macrophages. Mol Biol Cell , 2811–2823. [DOI] [PMC free article] [PubMed] [Google Scholar]
- Labernadie A, Thibault C, Vieu C, Maridonneau-Parini I, Charriere GM. (2010). Dynamics of podosome stiffness revealed by atomic force microscopy. Proc Natl Acad Sci USA , 21016–21021. [DOI] [PMC free article] [PubMed] [Google Scholar]
- Linder S. (2007). The matrix corroded: podosomes and invadopodia in extracellular matrix degradation. Trends Cell Biol , 107–117. [DOI] [PubMed] [Google Scholar]
- Linder S, Higgs H, Hufner K, Schwarz K, Pannicke U, Aepfelbacher M. (2000). The polarization defect of Wiskott-Aldrich syndrome macrophages is linked to dislocalization of the Arp2/3 complex. J Immunol , 221–225. [DOI] [PubMed] [Google Scholar]
- Linder S, Wiesner C, Himmel M. (2011). Degrading devices: invadosomes in proteolytic cell invasion. Annu Rev Cell Dev Biol , 185–211. [DOI] [PubMed] [Google Scholar]
- Liu Y, Nusrat A, Schnell FJ, Reaves TA, Walsh S, Pochet M, Parkos CA. (2000). Human junction adhesion molecule regulates tight junction resealing in epithelia. J Cell Sci (Pt 13), 2363–2374. [DOI] [PubMed] [Google Scholar]
- Luxenburg C, Geblinger D, Klein E, Anderson K, Hanein D, Geiger B, Addadi L. (2007). The architecture of the adhesive apparatus of cultured osteoclasts: from podosome formation to sealing zone assembly. PLoS One , e179. [DOI] [PMC free article] [PubMed] [Google Scholar]
- McInnes A, Rennick DM. (1988). Interleukin 4 induces cultured monocytes/macrophages to form giant multinucleated cells. J Exp Med , 598–611. [DOI] [PMC free article] [PubMed] [Google Scholar]
- McNally AK, Anderson JM. (1995). Interleukin-4 induces foreign body giant cells from human monocytes/macrophages. Differential lymphokine regulation of macrophage fusion leads to morphological variants of multinucleated giant cells. Am J Pathol , 1487–1499. [PMC free article] [PubMed] [Google Scholar]
- Mersich AT, Miller MR, Chkourko H, Blystone SD. (2010). The formin FRL1 (FMNL1) is an essential component of macrophage podosomes. Cytoskeleton (Hoboken) , 573–585. [DOI] [PMC free article] [PubMed] [Google Scholar]
- Milde R, Ritter J, Tennent GA, Loesch A, Martinez FO, Gordon S, Pepys MB, Verschoor A, Helming L. (2015). Multinucleated giant cells are specialized for complement-mediated phagocytosis and large target destruction. Cell Rep , 1937–1948. [DOI] [PMC free article] [PubMed] [Google Scholar]
- Miyaguchi K. (2000). Ultrastructure of the zonula adherens revealed by rapid-freeze deep-etching. J Struct Biol , 169–178. [DOI] [PubMed] [Google Scholar]
- Moreno JL, Mikhailenko I, Tondravi MM, Keegan AD. (2007). IL-4 promotes the formation of multinucleated giant cells from macrophage precursors by a STAT6-dependent, homotypic mechanism: contribution of E-cadherin. J Leukoc Biol , 1542–1553. [DOI] [PubMed] [Google Scholar]
- Murphy DA, Courtneidge SA. (2011). The “ins” and “outs” of podosomes and invadopodia: characteristics, formation and function. Nat Rev Mol Cell Biol , 413–426. [DOI] [PMC free article] [PubMed] [Google Scholar]
- Panzer L, Trube L, Klose M, Joosten B, Slotman J, Cambi A, Linder S. (2016). The formins FHOD1 and INF2 regulate inter- and intra-structural contractility of podosomes. J Cell Sci , 298–313. [DOI] [PubMed] [Google Scholar]
- Pende D, Castriconi R, Romagnani P, Spaggiari GM, Marcenaro S, Dondero A, Lazzeri E, Lasagni L, Martini S, Rivera P, et al. (2006). Expression of the DNAM-1 ligands, Nectin-2 (CD112) and poliovirus receptor (CD155), on dendritic cells: relevance for natural killer-dendritic cell interaction. Blood , 2030–2036. [DOI] [PubMed] [Google Scholar]
- Pfaff M, Jurdic P. (2001). Podosomes in osteoclast-like cells: structural analysis and cooperative roles of paxillin, proline-rich tyrosine kinase 2 (Pyk2) and integrin alphaVbeta3. J Cell Sci , 2775–2786. [DOI] [PubMed] [Google Scholar]
- Podbilewicz B. (2014). Virus and cell fusion mechanisms. Annu Rev Cell Dev Biol , 111–139. [DOI] [PubMed] [Google Scholar]
- Podolnikova NP, Hlavackova M, Wu Y, Yakubenko VP, Faust JJ, Balabiyev A, Ugarova TP. (2019) The interaction between the macrophage receptors integrin Mac-1 (αMβ2, CD11b/CD18) and SIRPα (MFR) mediates fusion in heterologous cells. J Biol Chem , 7833–7849. [DOI] [PMC free article] [PubMed] [Google Scholar]
- Podolnikova NP, Kushchayeva YS, Wu Y, Faust J, Ugarova TP. (2016). The role of integrins alphaMbeta2 (Mac-1, CD11b/CD18) and alphaDbeta2 (CD11d/CD18) in macrophage fusion. Am J Pathol , 2105–2116. [DOI] [PMC free article] [PubMed] [Google Scholar]
- Poincloux R, Vincent C, Labrousse A, Castandet J, Rigo M, Cougoule C, Bordier C, Le Cabec V, Maridonneau-Parini I. (2006). Re-arrangements of podosome structures are observed when Hck is activated in myeloid cells. Eur J Cell Biol , 327–332. [DOI] [PubMed] [Google Scholar]
- Ridley AJ. (2011). Life at the leading edge. Cell , 1012–1022. [DOI] [PubMed] [Google Scholar]
- Riedl J, Flynn KC, Raducanu A, Gartner F, Beck G, Bosl M, Bradke F, Massberg S, Aszodi A, Sixt M, Wedlich-Soldner R. (2010). Lifeact mice for studying F-actin dynamics. Nat Methods , 168–169. [DOI] [PubMed] [Google Scholar]
- Santoso S, Sachs UJ, Kroll H, Linder M, Ruf A, Preissner KT, Chavakis T. (2002). The junctional adhesion molecule 3 (JAM-3) on human platelets is a counterreceptor for the leukocyte integrin Mac-1. J Exp Med , 679–691. [DOI] [PMC free article] [PubMed] [Google Scholar]
- Sheikh S, Nash GB. (1996). Continuous activation and deactivation of integrin CD11b/CD18 during de novo expression enables rolling neutrophils to immobilize on platelets. Blood , 5040–5050. [PubMed] [Google Scholar]
- Skokos EA, Charokopos A, Khan K, Wanjala J, Kyriakides TR. (2011). Lack of TNF-alpha-induced MMP-9 production and abnormal E-cadherin redistribution associated with compromised fusion in MCP-1-null macrophages. Am J Pathol , 2311–2321. [DOI] [PMC free article] [PubMed] [Google Scholar]
- Svitkina TM. (2013). Ultrastructure of protrusive actin filament arrays. Curr Opin Cell Biol , 574–581. [DOI] [PMC free article] [PubMed] [Google Scholar]
- Takai Y, Ikeda W, Ogita H, Rikitake Y. (2008). The immunoglobulin-like cell adhesion molecule nectin and its associated protein afadin. Annu Rev Cell Dev Biol , 309–342. [DOI] [PubMed] [Google Scholar]
- Takeichi M. (2014). Dynamic contacts: rearranging adherens junctions to drive epithelial remodeling. Nat Rev Mol Cell Biol , 397–410. [DOI] [PubMed] [Google Scholar]
- Takito J, Nakamura M, Yoda M, Tohmonda T, Uchikawa S, Horiuchi K, Toyama Y, Chiba K. (2012). The transient appearance of zipper-like actin superstructures during the fusion of osteoclasts. J Cell Sci , 662–672. [DOI] [PubMed] [Google Scholar]
- Takito J, Otsuka H, Inoue S, Kawashima T, Nakamura M. (2017). Symmetrical retrograde actin flow in the actin fusion structure is involved in osteoclast fusion. Biol Open , 1104–1114. [DOI] [PMC free article] [PubMed] [Google Scholar]
- Van Audenhove I, Debeuf N, Boucherie C, Gettemans J. (2015). Fascin actin bundling controls podosome turnover and disassembly while cortactin is involved in podosome assembly by its SH3 domain in THP-1 macrophages and dendritic cells. Biochim Biophys Acta , 940–952. [DOI] [PubMed] [Google Scholar]
- Van den Bossche J, Bogaert P, van HJ, Guerin CJ, Berx G, Movahedi K, Van den Bergh R, Pereira-Fernandes A, Geuns JM, Pircher H, et al. (2009). Alternatively activated macrophages engage in homotypic and heterotypic interactions through IL-4 and polyamine-induced E-cadherin/catenin complexes. Blood , 4664–4674. [DOI] [PubMed] [Google Scholar]
- van den Dries K, Meddens MB, de Keijzer S, Shekhar S, Subramaniam V, Figdor CG, Cambi A. (2013a). Interplay between myosin IIA-mediated contractility and actin network integrity orchestrates podosome composition and oscillations. Nat Commun , 1–13. [DOI] [PMC free article] [PubMed] [Google Scholar]
- van den Dries K, Schwartz SL, Byars J, Meddens MB, Bolomini-Vittori M, Lidke DS, Figdor CG, Lidke KA, Cambi A. (2013b). Dual-color superresolution microscopy reveals nanoscale organization of mechanosensory podosomes. Mol Biol Cell , 2112–2123. [DOI] [PMC free article] [PubMed] [Google Scholar]
- Wiesner C, Faix J, Himmel M, Bentzien F, Linder S. (2010). KIF5B and KIF3A/KIF3B kinesins drive MT1-MMP surface exposure, CD44 shedding, and extracellular matrix degradation in primary macrophages. Blood , 1559–1569. [DOI] [PubMed] [Google Scholar]
- Wiesner C, Le-Cabec V, El AK, Maridonneau-Parini I, Linder S. (2014). Podosomes in space: macrophage migration and matrix degradation in 2D and 3D settings. Cell Adh Migr , 179–191. [DOI] [PMC free article] [PubMed] [Google Scholar]
- Yonemura S, Itoh M, Nagafuchi A, Tsukita S. (1995). Cell-to-cell adherens junction formation and actin filament organization: similarities and differences between non-polarized fibroblasts and polarized epithelial cells. J Cell Sci (Pt 1), 127–142. [DOI] [PubMed] [Google Scholar]
- Zambonin-Zallone A, Teti A, Grano M, Rubinacci A, Abbadini M, Gaboli M, Marchisio PC. (1989). Immunocytochemical distribution of extracellular matrix receptors in human osteoclasts: a beta 3 integrin is colocalized with vinculin and talin in the podosomes of osteoclastoma giant cells. Exp Cell Res , 645–652. [DOI] [PubMed] [Google Scholar]
- Zhao Q, Topham N, Anderson JM, Hiltner A, Lodoen G, Payet CR. (1991). Foreign-body giant cells and polyurethane biostability: in vivo correlation of cell adhesion and surface cracking. J Biomed Mater Res , 177–183. [DOI] [PubMed] [Google Scholar]
Associated Data
This section collects any data citations, data availability statements, or supplementary materials included in this article.