

Abstract
Background
Completion rates for medication therapy management (MTM) services have been lower than desired and the Centers for Medicare and Medicaid Services has added MTM comprehensive medication review (CMR) completion rates as a Part D plan star measure. Over half of plans utilize community pharmacists via contracts with MTM vendors.
Objectives
The primary objective of this survey study was to identify factors associated with the CMR completion rates of community pharmacies contracted with a national MTM vendor.
Methods
Representatives from 27,560 pharmacy locations contracted with a national MTM vendor were surveyed. The dependent variable of interest was the pharmacies’ CMR completion rate. Independent variables included the pharmacy’s progressiveness stratum and number of CMRs assigned by the MTM vendor during the time period, as well as self-reported data to characterize MTM facilitators, barriers, delivery strategies, staffing, selected items from a modified Assessment of Chronic Illness care, and pharmacist/pharmacy demographics. Univariate negative binomial models were fit for each independent variable, and variables significant at p < 0.05 were entered into a multivariable model.
Results
Representatives from 3836 (13.9%) pharmacy locations responded; of these, 90.9% (n =3486) responses were usable. The median CMR completion rate was 0.42. Variables remaining significant at p < 0.05 in the multivariable model included: progressiveness strata; pharmacy type; scores on the facilitators scale; responses to two potential barriers items; scores on the patient/caregiver delivery strategies sub-scale; providing MTM at multiple locations; reporting that the MTM vendor sending the survey link is the primary MTM vendor for which the respondent provides MTM; and the number of hours per week that the pharmacy is open.
Conclusions
Factors at the respondent (e.g., responses to facilitators scale) and pharmacy (e.g., pharmacy type) levels were associated with CMR completion rates. These findings could be used by MTM stakeholders to improve CMR completion rates.
INTRODUCTION
The Medicare Part D prescription drug benefit was created through passage of the Medicare Modernization and Improvement Act in 2003 and implemented in 2006.1 In 2018, more than 43 million Medicare beneficiaries (72%) elected to receive prescription drug coverage through Part D.2 The prevalence, complexity, and expense of medication use among Medicare beneficiaries continues to grow.3
Medication therapy management (MTM) is proposed as a strategy for optimizing medication use among Medicare beneficiaries and was intended to improve medication adherence while reducing adverse drug events.1 All stand-alone Medicare Part D prescription drug plans (PDPs) and Medicare Advantage prescription drug plans (MA-PDs) are required to offer MTM services to beneficiaries meeting general criteria: having 2 to 3 chronic conditions, taking 2 to 8 Part D medications, and a likelihood of exceeding $4,044 in annual Part D medication costs.4 Plans’ specific criteria can be less, but not more, restrictive.4 Eligible beneficiaries must be offered a comprehensive medication review (CMR) annually as a part of MTM.4
Over the last several years, the Centers for Medicare and Medicaid Services (CMS) has expressed concern with lower than expected patient volumes receiving MTM services and has introduced changes to expand patient access to these services, such as the requirement for “opt-out” vs. “opt-in” MTM enrollment and strategies to enhance beneficiary awareness of MTM.5 To promote access further, completion rates for CMRs were added as a star measure for Part D plans in 2016.6 The Star Ratings program assesses plans on several measures and provides a rating ranging from 1 to 5 stars, with 5 being the highest rating.7 Plans are incentivized to improve their star ratings. For example, if a plan successfully achieves a 5 star rating, then CMS permits beneficiaries to change to the plan outside of open enrollment periods.7 In addition, MA-PDs with 4 or more stars receive quality bonus payments to enhance services for beneficiaries.7 Although the plans are rated by CMS, community pharmacies providing MTM services are not. Rather, community pharmacies focus on ensuring positive contributions toward plans’ star ratings in order to secure their inclusion in the plans’ preferred provider networks and reduce their direct and indirect remuneration fees.8 Several star measures, including CMR completion rates, can be positively influenced by community pharmacists.7
In 2018, 65.6% of plans utilized MTM vendor-contracted community pharmacists to provide MTM services.9 Therefore, identifying strategies used by contracted community pharmacies that drive CMR completion rates has important implications for pharmacy practice and MTM policy. Recent literature has explored the effect of scripted language use, varying approaches to patient outreach, and incentives and education for pharmacists.10–13 These and other potential drivers of CMR completion warrant further study.
Objectives
The primary objective of this survey study was to identify factors associated with the CMR completion rates of community pharmacies contracted with a national MTM vendor. Secondary objectives were to characterize MTM barriers, facilitators, delivery strategies, and pharmacy staff roles in MTM delivery.
METHODS
Conceptual Framework
As described above, Medicare Part D MTM eligibility criteria focuses on those with chronic conditions.4 The Chronic Care Model (CCM) describes six elements that positively influence care for the chronically ill.14–15 These elements align well with MTM delivery (e.g., patient self-management support through the provision of personal medication lists and medication-related action plans). Therefore, the CCM was applied to the design of this study. The Assessment of Chronic Illness Care (ACIC) is a quantitative survey instrument designed to assist practices in evaluating the extent to which care aligns with CCM elements.16–17 As part of the study team’s prior research examining MTM delivery within the framework of the CCM, the ACIC was modified for application to MTM.18
Study Design and Population
This cross-sectional study utilized data from two sources: a national survey of pharmacists representing community pharmacies contracted by an MTM vendor and data provided by the MTM vendor. The MTM vendor created a de-identified listing of all 40,552 pharmacies nationally contracted to provide MTM services, as of 5/1/15, with the “practice environment progressiveness” strata (described below) for each pharmacy’s location indicated. To avoid duplicate responses and ensure respondent involvement in MTM, the pharmacist accessing the most MTM cases (as determined by the MTM vendor) was eligible to complete the survey on behalf of their pharmacy. If a pharmacist was identified as accessing the most MTM cases for more than one pharmacy, one pharmacy location from the “group” was randomly selected by the MTM vendor and that respondent was asked to consider the survey items with only the selected pharmacy in mind. A total of 27,560 pharmacy locations were surveyed.
Study Measures
Dependent Variable.
The dependent variable was the “CMR completion rate” for each pharmacy. This was defined as the proportion of all CMRs assigned to the pharmacy that were completed, computed for the period of 5/1/15 to 4/30/16 from data provided by the MTM vendor. All CMRs, regardless of payer (Medicare Part D or other MTM payer) were included, and the payer for CMRs was unknown to investigators.
Independent Variables.
Independent variables included self-reported survey data to characterize MTM facilitators, MTM barriers, MTM delivery strategies, and self-reported data related to MTM staffing, selected items from the modified ACIC,18 respondent (pharmacist) demographics, and pharmacy demographics. Additional independent variables included the pharmacy’s progressiveness stratum (described below), and number of CMRs assigned by the MTM vendor to the pharmacy during the time period. These variables were provided by the MTM vendor.
Survey Development
Informed by the study team’s prior qualitative work,18 survey items were generated to assess MTM facilitators, barriers, and delivery strategies for each element of the CCM.14–15 Items were pilot tested for clarity and time estimates by three MTM experts nationally and six local community pharmacy residents and preceptors. The final survey (≤ 127 items total, with skip patterns applied) consisted of six total sections (Appendix 1.)19
The first section (33 items, divided into three sub-sections) included 17 MTM facilitator items (i.e., section 1a; pages 1–4 in Appendix), 7 MTM barrier items, and 9 MTM delivery strategy items. These items were assessed using 5-point Likert-type scales anchored with 1=never and 5=always. The second section included items assessing the extent to which specific types of pharmacy staff were employed at the pharmacy (data not shown). The third section contained 12 items from the modified ACIC, scored on a 0 to 11 point scale with responses indicating varying levels of agreement with the extent to which CCM elements are integrated into MTM delivery.
As described previously,18 modifications were made with permission from the original ACIC developers to improve relevance to MTM. The 12 items were selected based on interquartile ranges, item-total correlations, and qualitative findings from prior work.18 The fourth and last section contained 19 items assessing respondent and pharmacy demographic data.
Practice Environment Progressiveness Strata Development
To control for the external environment (e.g., state laws and MTM payer mix) which was identified as an important consideration in this study team’s prior qualitative work,18 states were stratified by “practice progressiveness.” The strata were defined as Low, Moderate, and High, based on: a) the scope of practice in each states’ pharmacy practice act (e.g., whether pharmacists could initiate therapy under collaborative practice agreements); b) MTM payer mix; and c) whether an MTM pharmacist provider network was active. Information, as of 2015, was obtained from the National Alliance of State Pharmacy Associations and various state association and other professional websites. Draft strata were reviewed and modified based on input from four national MTM experts. After finalizing the assignment of states to strata, the MTM vendor provided the stratum designated for each de-identified pharmacy.
Data Collection
Pharmacists were invited by emails sent by the MTM vendor in July 2016 to participate in the survey, which was administered using REDCap.23 To enhance the response rate, three follow-up emails were sent by the MTM vendor at weekly intervals. Using a unique survey code provided in the invitation, survey responses were linked to the pharmacy’s CMR completion rate (computed as described above) as well as the pharmacy’s “practice environment progressiveness” stratum from data provided by the MTM vendor. As an incentive, respondents had the option to enter a gift card drawing. This study was approved by the institutional review board.
Data Analysis
Responders were defined as unique survey attempts with at least one answered question. Usable surveys were a) those with answers provided for at least 12 of the 17 MTM facilitators items and b) linkable to outcome (i.e., CMR completion) data. If multiple attempts were submitted for the same survey code, the first attempt was used if both attempts were complete. If one attempt was complete and one incomplete, data from the complete attempt were used. The first response for a given item was used when multiple incomplete attempts were recorded.
Non-responders included those pharmacies that did not complete a survey and pharmacies belonging to a group of pharmacies but not selected at random (see above) to be surveyed. How the pharmacies were grouped was not available to the study team.
Respondent characteristics and pharmacy staff roles in MTM.
To characterize respondents and reported roles in MTM, descriptive statistics (medians, 25th/75th percentiles, frequencies) were computed. Medians and percentiles were calculated for numerical variables because many were non-normal (skewed to left or right), including CMR completion rate. Differences in demographics across strata were evaluated using Kruskal-Wallis and Chi-squared tests.
Scale structure.
The construct validity for each scale (sections 1 and 3, as described above) was estimated using principal components analysis computed with all available responses, regardless of linkage to outcome data. Scale structure was determined through examination of component loadings and scree plots. Cronbach’s alpha was then computed for each identified sub-scale to estimate internal consistency. Analyses were performed using SPSS version 24.21
Responses to scale items.
Data from scales with more than two items were included if at least 67% of the items were completed, and data from scales with only two items were included if at least 50% of the items were completed. Within-respondent means for completed scale items were imputed for missing data on each scale when the minimum number, but not all, of the items were completed. Descriptive statistics (medians, 25th/75th percentiles, frequencies) were computed to summarize scale responses. Two barriers items were reverse-scored so that higher values consistently indicated more positive responses.
CMR completion.
Univariate negative binomial models were fit for each independent variable and variables significant at p < 0.05 were entered into a multivariable model. In the negative binomial models, number of CMRs completed was the outcome variable with number of CMRs assigned (on the natural log scale) included in the model as an offset. The offset term accounts for the fact that different pharmacies had different numbers of CMRs assigned within the specified time period. This allowed for the modeling of the appropriate rate. Non-response bias was assessed by comparing CMR completion rates for pharmacies with outcome data able to be linked to survey data to rates from pharmacies with outcome data that were not linked to survey data using a negative binomial which included strata as a covariate. These modeling analyses were performed in SAS version 9.4.22
RESULTS
Respondent Characteristics and Pharmacy Staff Roles in MTM
Representatives from a total of 3836 pharmacy locations out of 27,560 pharmacy locations surveyed responded and completed at least one question (response rate, 13.9%); of these, 90.9% (n =3486) responses were usable (Figure 1).
Figure 1.
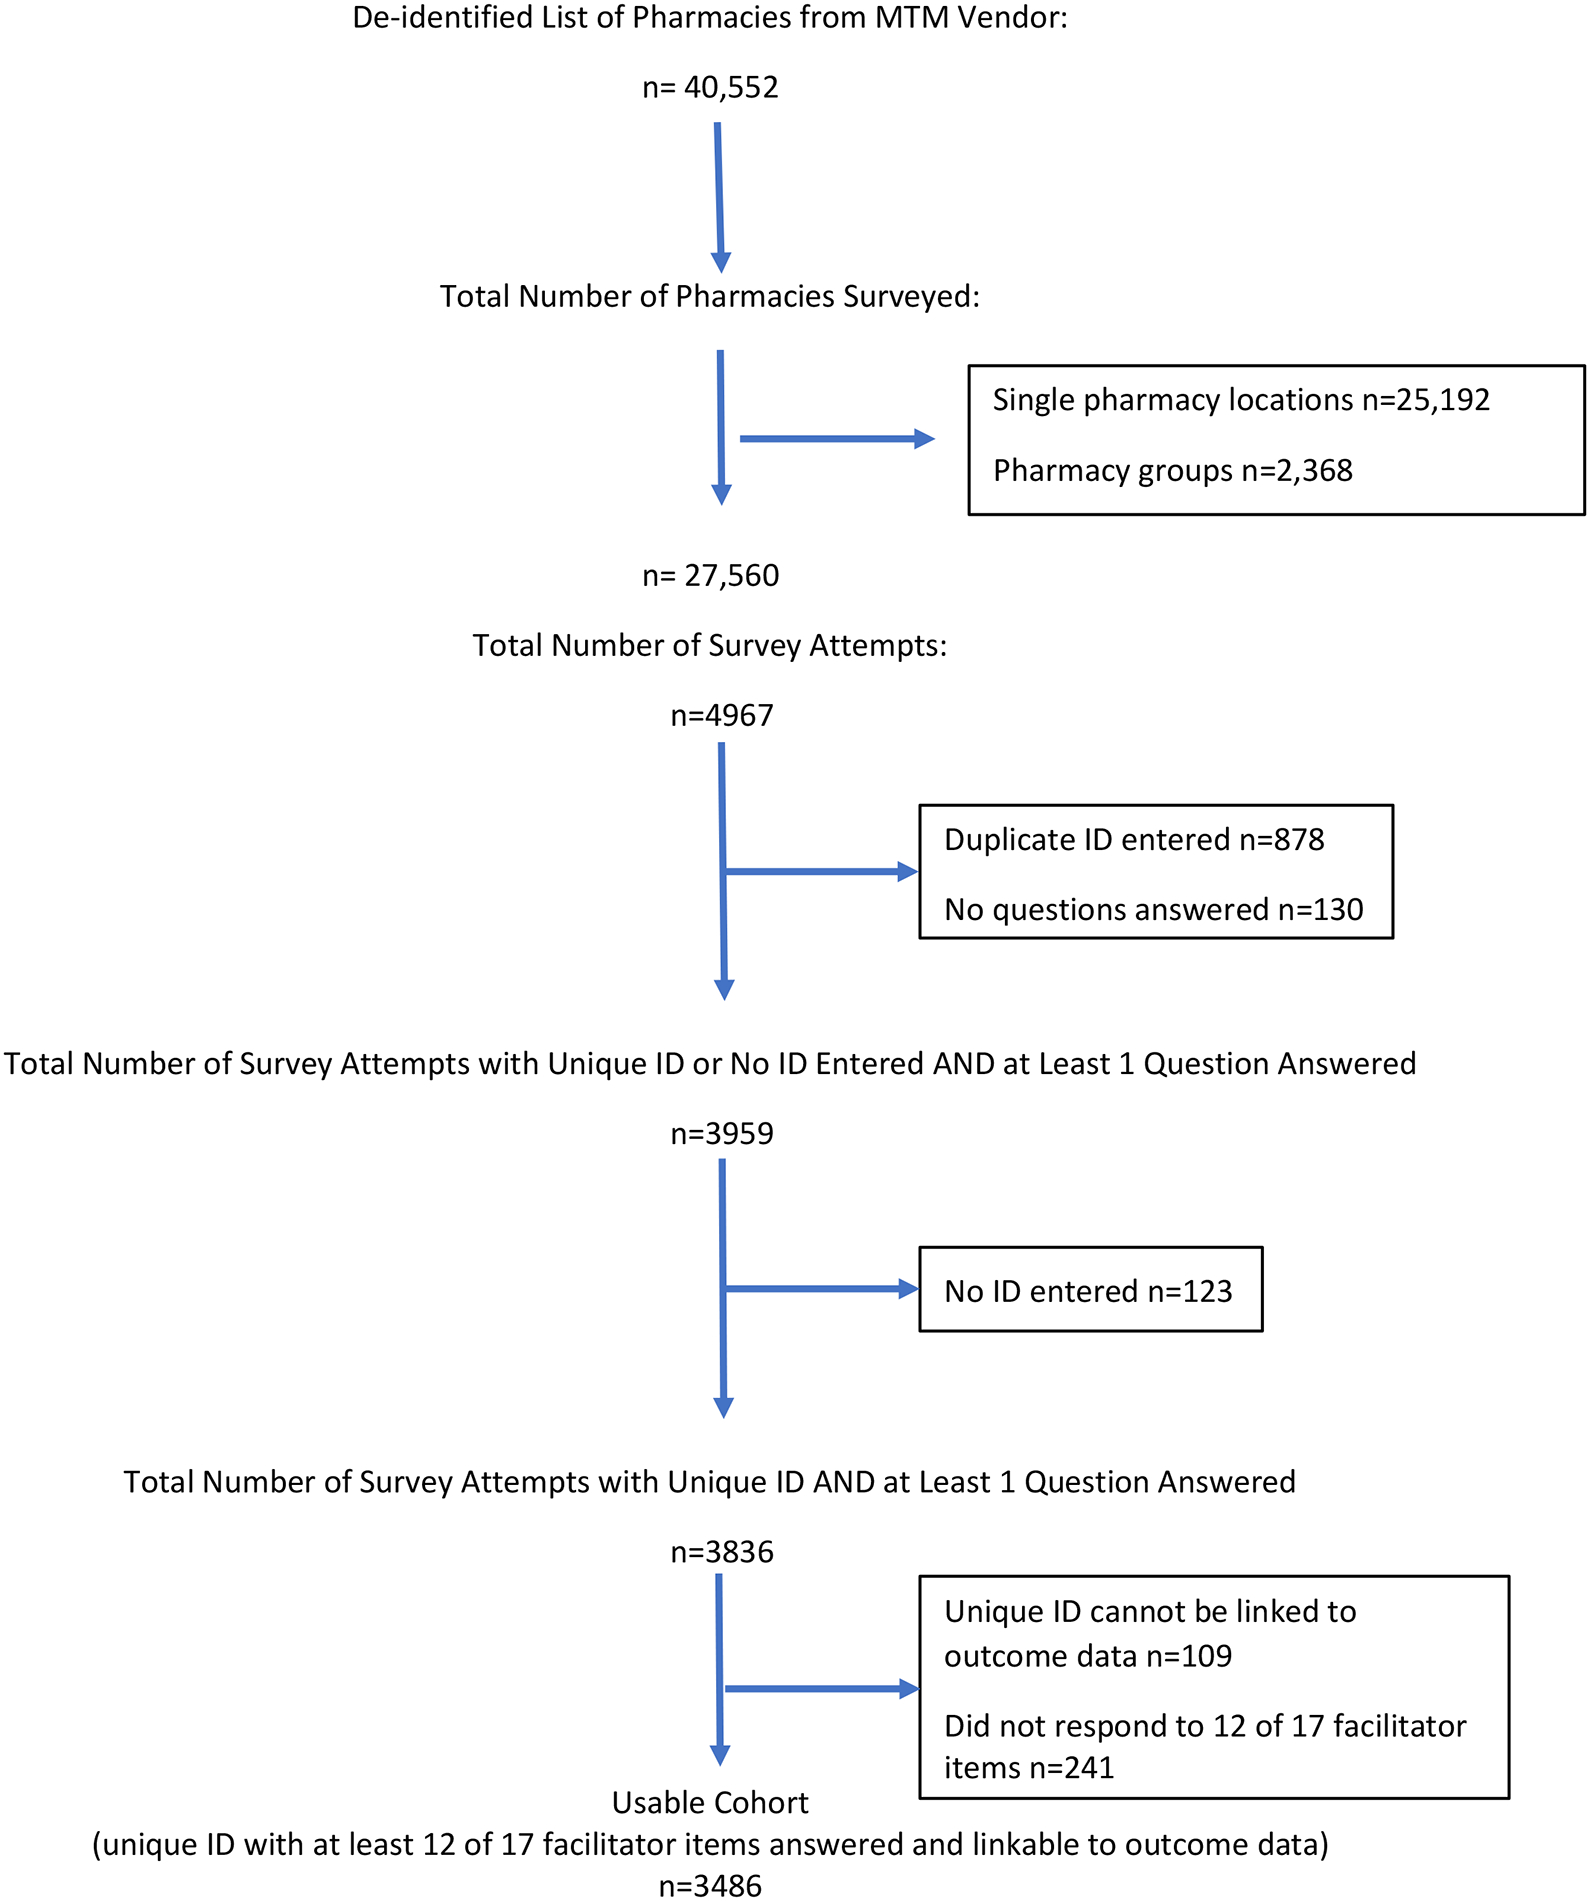
Survey Enrollment
Respondent and pharmacy characteristics by stratum are summarized in Tables 1 and 2 in order to illustrate demographic differences across strata, reflecting how our strata definitions grouped pharmacies with respondent characteristics pertinent to environment progressiveness (e.g., education and training levels). Responses primarily came from managers, owners, and/or full-time pharmacist employees of retail chain or independent pharmacies, with more chain responses in the “Low” progressiveness stratum. Most respondents were white and female, with a median age of 44 years. About half of the total sample completed a PharmD, with a smaller percentage of respondents with a PharmD in the “Low” progressiveness stratum. Fewer than 5% of the total sample completed a PGY-1 residency and fewer than a quarter completed an MTM certificate program, and each of these credentials was more common among respondents in the “High” progressiveness stratum. There were no significant differences in respondents’ year first licensed among the three strata. Respondents reported having a median 4 hours per week dedicated to MTM activities. Response bias was evident. Among all 40,551 pharmacies contracted to provide MTM in this study that were assigned at least one CMR opportunity, the CMR completion rate was 48% higher among responders vs. non-responders. No meaningful differences in pharmacy staff role utilization in MTM were observed; therefore, these data are not shown.
Table 1.
Respondent Characteristics, by Progressiveness Strata (Low (L), Moderate (M), High (H))
| Respondent characteristics | Pairwise differences | ||||
|---|---|---|---|---|---|
| Characteristic | Na | L (n=1217) | M (n=1084) | H (n=1185) | |
| Age in years, median (Q25,Q75b) | 2742 | 44 (35,55) | 44 (35,55) | 43 (34,54) | NS |
| Male sex, n (%) | 2896 | 474 (46.79) | 419 (46.92) | 413 (41.72) | p =0.03c; L vs H; M vs H |
| Caucasian, n (%) | 2884 | 800 (79.52) | 646 (72.34) | 824 (83.65) | p <0.0001c; L vs M; L vs H; M vs H |
| Ethnicity (Not Hispanic/Latino), n (%) | 2840 | 975 (98.19) | 834 (95.42) | 950 (97.64) | p =0.001c; L vs M; M vs H |
| PharmD as highest pharmacy degree, n (%) | 2906 | 453 (44.63) | 494 (54.95) | 516 (52.02) | p < 0.0001c; L vs M; L vs H |
| Year first licensed, median (Q25,Q75) | 2787 | 1997 (1986,2008) | 1999 (1986,2009) | 1999 (1987,2009) | NS |
| Any additional education, n (%) | 2891 | 159 (15.68) | 145 (16.38) | 172 (17.34) | NS |
| Post-graduate year one residency, n (%) | 2891 | 21 (2.07) | 26 (2.94) | 54 (5.44) | p =0.0001c; L vs H; M vs H |
| Any certifications, n (%) | 2880 | 648 (64.41) | 610 (69.00) | 692 (69.90) | p =0.02c; L vs M; L vs H |
| MTM certificate (any), n (%) | 2880 | 142 (14.12) | 159 (17.99) | 206 (20.81) | p =0.0004c; L vs H |
| Year employed at pharmacy, median (Q25,Q75) | 2861 | 2009 (2000,2013) | 2010 (2002,2014) | 2010 (2004,2014) | p =0.003d; L vs. H |
| Position, n (%) | 2897 | p =0.02c; L vs M; L vs H | |||
| Manager/Owner | 519 (51.49) | 459 (51.23) | 506 (50.96) | ||
| Full-time Pharmacist | 418 (41.47) | 340 (37.95) | 383 (38.57) | ||
| Resident/Fellow | 0 (0.00) | 4 (0.45) | 1 (0.10) | ||
| Other | 71 (7.04) | 93 (10.38) | 103 (10.37) | ||
| Hours per week dedicated to MTM, median (Q25,Q75) | 2843 | 3 (2,6) | 4 (2,6) | 4 (2,6) | NS |
| Provides MTM at multiple locations, n (%) | 2909 | 985 (96.95) | 868 (96.55) | 964 (96.98) | NS |
Table 2.
Pharmacy Characteristics, by Progressiveness Strata (Low (L), Moderate (M), High (H))
| Pharmacy characteristicse | Pairwise differences | ||||
|---|---|---|---|---|---|
| Characteristic | Na | L | M | H | |
| Pharmacy type, n (%) | 2879 | p <0.0001c; L vs M; L vs H | |||
| Retail chain | 595 (58.79) | 429 (48.58) | 508 (51.63) | ||
| Independently owned | 384 (37.94) | 396 (44.85) | 393 (39.94) | ||
| Health-system | 13 (1.28) | 31 (3.51) | 48 (4.88) | ||
| Other | 20 (1.98) | 27 (3.06) | 35 (3.56) | ||
| # of prescriptions filled per week, median (Q25,Q75b) | 2817 | 1000 (700,1500) | 1000 (600,1500) | 1000 (700,1600) | p =0.01d; L vs M; M vs H |
| Hours pharmacy open per week, median (Q25,Q75) | 2857 | 73 (55,79) | 56 (49,76) | 59 (50,77) | p <0.0001d; L vs M; L vs H |
| Residency training site, n (%) | 2874 | 65 (6.49) | 72 (8.08) | 89 (9.07) | NS |
| Student training site, n (%) | 2850 | 375 (37.69) | 353 (39.89) | 476 (49.07) | p <0.0001c; L vs H; M vs H |
| FTEs employed, median (Q25,Q75)f | |||||
| Pharmacists | 3138 | 2.00 (1.25,2.00) | 2.00 (1.00,2.00) | 2.00 (1.00,2.00) | NS |
| Float pharmacists | 3141 | 0.00 (0.00,1.00) | 0.20 (0.00,1.00) | 0.04 (0.00,1.00) | NS |
| Pharmacy technicians | 3141 | 2.00 (1.00,4.00) | 2.60 (1.50,4.00) | 3.00 (1.75,4.80) | p <0.0001d; L vs M, L vs H, M vs H |
| Other personnel | 3141 | 0.75 (0.00,2.00) | 0.00 (0.00,2.00) | 0.20 (0.00,2.00) | p <0.0001d; L vs M; L vs H |
| FTEs involved in MTM, median (Q25,Q75)f | |||||
| Pharmacists | 2887 | 1 (1,2) | 1 (1,2) | 1 (1,2) | p <0.0001d; L > M; L > H |
| Pharmacy technicians | 2999 | 0 (0,1) | 0 (0,1) | 0 (0,1) | p =0.03d; L< H |
| Survey sent by primary MTM vendor, n (%) | 2860 | 749 (75.28) | 616 (69.60) | 593 (60.51) | p <0.0001c; L vs M; L vs H; M vs H |
| % of MTM provided under Part D, median (Q25,Q75) | 2782 | 90 (70,100) | 90 (70,100) | 85 (65,100) | NS |
| CMR completion rate, median (Q25,Q75)g | 3486 | 0.44 (0.25,0.64) | 0.40 (0.20,0.61) | 0.41 (0.21,0.63) | p = 0.001d; L vs M; L vs H |
Refers to number of non-missing responses received for variable
Q25 = 25th percentile, Q75 = 75th percentile
Chi-squared test
Kruskal-Wallis test
Self-reported by respondent as part of survey
Only reported for FTE roles where 75th percentile > 0
Computed from data provided by MTM vendor
Scale Structure
Facilitators, Delivery Strategies, and ACIC Scales
Principal components analyses identified one-component solutions for the MTM facilitators and modified ACIC items, with Cronbach alpha internal consistency estimates of 0.90 and 0.95, respectively. Therefore, the items assessing facilitators were combined into a 17-item scale, and the modified ACIC items were combined into a 12-item scale. Principal components analysis of the items related to delivery strategies identified a 3-component solution. The first sub-scale (“patient/caregiver delivery strategies”) contained 5 items (alpha, 0.73). The second sub-scale (“documentation strategies”) contained 2 items (alpha, 0.63). The third sub-scale (“clinical information strategies”) contained 2 items (alpha, 0.62). All scale scores were computed as a mean of individual item scores.
The median score on the MTM facilitators scale was 3.82 (range, 1 to 5.) Of the 17 items comprising the facilitators scale, only 2 items were assessed positively (i.e., a response of “often” or “always”) in fewer than 50% of the sample. These items included: “Physicians and other prescribers are responsive to patient care recommendations I make as part of MTM” and “There is written material on community resources available for my patients.” The median score on the patient/caregiver delivery strategies sub-scale was 4.20 (range, 1 to 5), and all items were assessed positively by 50% or more of respondents. The median score on the documentation strategies sub-scale was 3.50 (range, 1 to 5) and both items were assessed positively by 50% or more of respondents. The median score on the clinical information strategies sub-scale was 2.50 (range, 1 to 5) and both items were assessed positively by fewer than 30% of the sample. The mean (sd) modified ACIC score was 4.84 (2.37).
Barriers Items
Because items related to barriers did not cluster into a meaningful scale or sub-scales in the principal components analysis, each barrier item was analyzed individually for association with CMR completion. Median scores on MTM barriers items ranged from 2 to 5, with most items assessed positively by at least 50% of respondents, indicating that the barriers presented on the survey were generally not problematic, with two exceptions. One exception was for the item: “I have ready access to laboratory or other patient-specific clinical data.” Most (85%) respondents indicated this as occurring “never”, “rarely”, or “sometimes.” Another exception was for the item: “They [decision support functions] are my primary source for identifying medication-related problems during MTM.” Most (74%) respondents indicated this as occurring “often” or “always” which was a negative finding because this item had been reverse-scored. The item was reverse-scored due to the study team’s a priori decision to consider pharmacist use of decision support as a secondary, rather than primary, source in problem identification the preferred strategy for MTM delivery. Therefore, reliance on decision support as the primary source for problem identification was considered a barrier.
CMR Completion
Overall, the median CMR completion rate was 0.42 for all responders vs. 0.23 for non-responders. The following variables were associated (p < 0.05) with CMR completion in the univariate modeling: stratum of practice progressiveness, respondent age, year first licensed, type of pharmacy, scores on the facilitators scale, all barriers items except for the item regarding decision support as the primary source for identifying medication-related problems, scores on the patient/caregiver and clinical information delivery strategies sub-scales, ACIC scores, number of pharmacy resident FTEs involved in MTM, year respondent was first employed at the pharmacy, reported number of hours per week the respondent has dedicated to MTM, providing MTM at multiple locations (versus at a single location), reporting that the MTM vendor sending the survey link is the primary vendor for which the respondent provides MTM, and the number of hours per week the pharmacy is open. Respondent age and year first licensed were highly correlated (p < 0.0001); therefore, only year first licensed was included in the multivariable model.
Variables remaining significant at p < 0.05 in the multivariable model (Table 3) included: practice progressiveness strata; type of pharmacy; scores on the facilitators scale; responses to the potential barriers item “Within the organization where I work, people without pharmacy training make decisions about my role in MTM”; responses to the potential barriers item “They [decision support functions] are clinically important and/or relevant”; scores on the patient/caregiver delivery strategies sub-scale; providing MTM at multiple locations; reporting that the MTM vendor sending the survey link is the primary MTM vendor for which the respondent provides MTM; and the number of hours per week that the pharmacy is open.
Table 3.
Final Multivariable Model (n=2492) Predicting CMR Completion Rate
| Variablea | Rate Ratio | Standard Error | Rate Ratio | Chi-Square (df) | Pr > ChiSq | |
|---|---|---|---|---|---|---|
| Confidence Limits | ||||||
| Moderate vs. High progressive | 0.94 | 0.03 | 0.88 | 1.00 | ||
| Other vs. chain (any) | 0.84 | 0.07 | 0.70 | 0.99 | ||
| Facilitators scaleb | 1.15 | 0.04 | 1.07 | 1.23 | 16.69 (1) | < 0.01 |
| MTM decision makerc | 1.02 | 0.01 | 1.00 | 1.05 | 4.20 (1) | 0.04 |
| Relevance of decision supportd | 0.96 | 0.02 | 0.92 | 1.00 | 4.45 (1) | 0.04 |
| Patient/caregiver delivery strategies subscalee | 1.11 | 0.03 | 1.04 | 1.17 | 11.09 (1) | < 0.01 |
| Provides MTM at multiple locations | 1.78 | 0.26 | 1.34 | 2.35 | 14.39 (1) | < 0.01 |
| Vendor sending survey is primary vendor for which respondent completes MTM | 1.09 | 0.03 | 1.03 | 1.15 | 8.09 (1) | < 0.01 |
| Hours pharmacy open per weekf | 0.98 | 0.01 | 0.95 | 0.99 | 10.83 (1) | < 0.01 |
Also included but not significant: Year first licensed as a pharmacist in any state; responses to the following potential barrier items, measured on scale where 1=never, 2=rarely, 3=sometimes, 4=often, 5=always: “After completing an MTM activity, I can easily identify patients for follow up when clinically appropriate.”, “I have ready access to laboratory or other patient-specific clinical data.”, “They [patients] understand the difference between MTM and the care they receive during prescription processing/patient counseling.”, “They [patients] are able to use the personal medication record (PMR) and medication action plans (MAP) we provide (as applicable) successfully for self-management.”; clinical information delivery strategies sub-scale (2 items); responses to the Assessment of Chronic Illness Care scale (12 items); number of pharmacy resident FTEs involved in MTM; years employed at pharmacy; and hours per week respondent has dedicated to MTM activities.
Responses to potential MTM facilitators scale, measured on scale where 1=never, 2=rarely, 3=sometimes, 4=often, 5=always (17 items including: “With regards to the MTM documentation platform I use for most of my MTM activities (5 items): ‘Sufficient training is provided (by pharmacy and/or platform vendor’; ‘It functions as intended without a need for “workarounds” or extra steps,’ ‘Patient information is shared, or integrated with, my dispensing software,’ ‘It flags and describes problems in a comprehensive manner so I am comfortable acting quickly on identified problems,’ ‘It facilitates effective communication with other healthcare providers.’”; “With regards to the pharmacy organization where I am employed (5 items): ‘MTM workflow is clearly defined for all pharmacy staff,’ ‘A formal quality assurance process is used to ensure high quality MTM is delivered,’ ‘Staff skills in patient self-management are emphasized during hiring and/or training,’ ‘Organizational goals for MTM delivery are clear and management is supportive of my participation in MTM,’ ‘Organizational resources (e.g., IT support, billing assistance) are available for MTM when needed and provided in a timely manner.’”; “With regards to the work culture at my pharmacy (4 items): ‘My colleagues and I use standard and/or scripted language for introducing/explaining MTM to patients,’ ‘A friendly work “culture” with positive working relationships among pharmacists and staff is exhibited at my pharmacy,’ ‘Positive relationships with patients are promoted by pharmacy staff,’ ‘Clinical training and/or continuing education opportunities related to MTM are provided when needed.’”; “With regards to communications with prescribers and referrals (3 items): ‘Physicians and other prescribers are responsive to patient care recommendations I make as part of MTM,’ ‘I am prepared to refer my patients to a specific community resource (e.g., patient assistance, diabetes counseling, social worker) if needed,’ ‘There is written material on community resources available for my patients.’”)
Responses to potential barriers item “Within the organization where I work, people without pharmacy training make decisions about my role in MTM” measured on scale where 1=never, 2=rarely, 3=sometimes, 4=often, 5=always and reverse scored for analysis
Responses to potential barriers item “They [decision support functions] are clinically important and/or relevant” measured on scale where 1=never, 2=rarely, 3=sometimes, 4=often, 5=always
Responses to patient/caregiver delivery strategies sub-scale items: “When permitted by payer, patients have options for how to be engaged in MTM activities at my pharmacy (e.g., in person, by phone, videoconferencing, etc.)”, “When clinically appropriate (e.g., patient is cognitively impaired), I engage caregivers in MTM activities,” “I provide positive reinforcement of appropriate patient self-management behaviors”, “I clearly communicate therapy goals to patients,” and “My colleagues and I use multiple approaches and/or points of contact for engaging patients and/or following up on no shows for MTM appointments,” measured on scale where 1=never, 2=rarely, 3=sometimes, 4=often, 5=always.
Rate ratio reported is for each 10 hour increase in store hours
DISCUSSION
This survey study identified factors at the respondent level (e.g., responses to some facilitators, barriers, and delivery strategy items) and pharmacy level (e.g., stratum where pharmacy located, type of pharmacy) that were associated with CMR completion rates among community pharmacies contracted with a national MTM vendor. Respondents in “High” progressiveness states reported more advanced pharmacy and MTM training than did respondents in less progressive states. This was expected given that strata development was informed by the MTM opportunities available in the state, which could result in either more pharmacists from these states trained in MTM or an ability for employers in these states to recruit pharmacists with these credentials. Although it was hypothesized that increased progressiveness would align with higher CMR completion rates, it was found that pharmacies in “Low” progressiveness states had the highest CMR completion rates. This could be related to our findings pertaining to respondents’ primary MTM vendor. When controlling for other variables in the multivariable model, respondents who indicated that the MTM vendor providing the survey was the primary MTM vendor for which they complete MTM activities had a 9% higher CMR completion rate than respondents who completed MTM primarily by another vendor. A more diverse payer mix with MTM cases assigned from multiple MTM vendors or other regional payers might have resulted in a lesser emphasis on completion of CMR opportunities received from this vendor.
The extent (i.e., number of FTEs) to which support staff were utilized in MTM delivery was not associated with CMR completion. We also examined the ways in which support staff were utilized across progressiveness strata and no meaningful differences were observed. These findings were surprising and merit further research given increasing emphasis on the utilization of pharmacy technicians, student pharmacists, and others in MTM provision.23–25
These findings point to specific respondent-level behaviors that could be considered by community pharmacies, regardless of their practice environment, MTM vendors, and payers wishing to improve CMR completion rates. For every unit increase in score on the facilitators scale, a 15% increase in CMR completion rate was found. While responses to the facilitators scale were overall positive, these findings suggest there is room for improvement in areas such as prescriber relationships and having information about community resources available. This supports prior literature identifying prescriber-pharmacist relationships as a barrier in MTM.26–27 Various strategies for improving these relationships have been suggested such as the pharmacist being the initiator of relationships, building trust through provision of high quality patient care recommendations, providing education to physicians on the pharmacist’s role, and utilizing facsimile while exploring other prescriber-preferred methods to communicate recommendations.28–30 Similarly, prior work has found that referrals to community resources as part of MTM are uncommon18 and that opportunities to enhance collaborations between community pharmacies and other community-based organizations is evident.31 The use of scripted language for introducing/explaining MTM also is addressed by one of the items in the facilitators scale. The positive association between using such language and CMR completion is consistent with recent research findings.10
For every unit increase in score on the patient/caregiver delivery strategies sub-scale, an 11% increase in the CMR completion rate was observed. This sub-scale included behaviors such as providing patients with flexible options for MTM delivery (e.g., telephone, video-conferencing), engaging caregivers, and supporting patient self-management. Again, while scores on this sub-scale were positive overall, community pharmacies could examine their MTM delivery to ensure their practice, when permitted by the MTM vendor/payer, aligns with these items because doing so would be expected to positively contribute to CMR completion. These findings support existing literature suggesting that strong patient self-management strategies are evident in MTM services,18 and patients are receptive of services delivered via video-conferencing.32
The relationship between specific barriers items and CMR completion was unexpected. For example, for every unit increase on the item, “Within the organization where I work, people without pharmacy training make decisions about my role in MTM,” a 2% increase in CMR completion rate was found. The opposite was anticipated—that leadership structures wherein pharmacists oversee MTM provision would be associated with higher levels of CMR completion. However, this finding might emphasize the role of those trained in management, industrial engineering, or other fields in driving pharmacy performance on MTM quality measures such as CMR completion. It was also surprising that for each unit increase on the item “They [decision support functions] are clinically important and/or relevant,” CMR completion rate decreased by 4%. However, it is possible that this is indicative of longer time spent (and consequently, fewer MTM cases completed) when the decision support functions are valued highly by the pharmacist. Additionally, previous research has found that less experienced pharmacists appear to rely more heavily on decision support in MTM;18 therefore, other unmeasured confounders indicating less respondent experience and/or confidence in MTM delivery among those placing greater importance on decision support could be reducing their completion of CMRs.
These findings highlight opportunities for further research, because CMR completion does not provide information about the quality of the CMR provided. Given an increasing emphasis by CMS on value-based care and payment models,33 there is a critical need for stakeholder engagement in defining “high quality” MTM. This has implications for CMS in the consideration of future star measures, as well as for MTM vendors and community pharmacies in the development of pharmacist training and reimbursement structures.
Finally, the number of CMR opportunities assigned to the pharmacy by the vendor was considered. It is reasonable to expect that a pharmacy with more CMR opportunities would be more likely to complete CMRs, because the business case for making necessary staffing and workflow changes to support service provision would be stronger. However, an association between CMR cases assigned and CMR completion rates was not found and therefore the number of CMR opportunities assigned was not included in the multivariable model. Further research should explore the lack of association between case volume and completion rates.
Limitations
This study has limitations. First, response bias is evident indicating that those completing the survey were overall more engaged in MTM given their higher CMR completion rates compared to non-responders. Moreover, many respondents stopped the survey early and missing data was pervasive. Even with a low response rate, the sample size in this study was large, and so statistical significance does not imply clinical importance. However, in spite of the low response rate and evidence of response bias, the sample closely mirrored the distribution of community pharmacy types nationally. An analysis of community pharmacies nationally in 2015 found that 61.5% were chain (when combining retail, mass merchant, and grocery store), 34.8% were independent, and 2.8% were “clinic” pharmacies.34
In addition, while survey items were generated from prior qualitative research and underwent pilot testing, some of the scales’ reliability estimates were lower than desired and barriers items could not be measured as a scale. These findings might also have been influenced by the timing of survey administration and the time period over which CMR completion was measured. The CMR completion rate was added as a Part D star measure in January 2016,6 which was the mid-point of the study’s time period for CMR completion rate computation. It is likely that CMR completion following January 2016 was higher than the prior period due to changing payer priorities. CMR completion was also found to be higher among respondents reporting that the MTM vendor who partnered with the study team on this survey was the primary MTM vendor for which they completed MTM. Findings might have differed had the study team partnered with a different MTM vendor.
CONCLUSIONS
This survey study identified factors associated with CMR completion rates among community pharmacies contracted with a national MTM vendor. These findings have practice and policy implications for a multitude of MTM stakeholders, including pharmacists, support staff, management, MTM vendors, and payers.
Supplementary Material
ACKNOWLEDGEMENTS
The authors wish to thank the other members of Dr. Snyder’s K08 mentoring panel: Drs. Brad Doebbeling and Mick Murray; the MTM vendor that partnered with us on this study; the individuals who assisted during the survey and strata development process; as well as all survey respondents.
REFERENCES
- 1.Centers for Medicare and Medicaid Services (CMS) HHS. Medicare program; Medicare Prescription Drug Benefit, Final Rule. Federal Register. 2005;70:4193–4585. [PubMed] [Google Scholar]
- 2.Cubanski J, Damico A, Neuman T. Medicare Part D in 2018: The latest on enrollment, premiums, and cost sharing. Available at: https://www.kff.org/medicare/issue-brief/medicare-part-d-in-2018-the-latest-on-enrollment-premiums-and-cost-sharing/. Accessed April 8, 2019.
- 3.Kaiser Family Foundation. 10 Essential Facts about Medicare and Prescription Drug Spending. November 10, 2017. Available at: https://www.kff.org/infographic/10-essential-facts-about-medicare-and-prescription-drug-spending/. Accessed April 8, 2019.
- 4.“Memo Contract Year 2019 Medication Therapy Management (MTM) Program Submission.” Centers for Medicare and Medicaid Services (CMS). Available at: https://www.cms.gov/Medicare/Prescription-Drug-Coverage/PrescriptionDrugCovContra/Downloads/Memo-Contract-Year-2019-Medication-Therapy-Management-MTM-Program-Submission-v-040618.pdf. Accessed April 8, 2019.
- 5.Brandt NJ, Cooke CE. Centers for Medicare and Medicaid Services Support for Medication Therapy Management (Enhanced Medication Therapy Management): Testing strategies for improving medication use among beneficiaries enrolled in Medicare Part D. Clin Geriatr Med. 2017;33:153–64. [DOI] [PubMed] [Google Scholar]
- 6.Centers for Medicare and Medicaid Services. 2016 Medicare Part D medication therapy management (MTM) programs. Available at: https://www.cms.gov/Medicare/Prescription-Drug-Coverage/PrescriptionDrugCovContra/Downloads/CY2016-MTM-Fact-Sheet.pdf. Accessed April 8, 2019.
- 7.American Pharmacists Association and Academy of Managed Care Pharmacy. Medicare star ratings: stakeholder proceedings on community pharmacy and managed care partnerships in quality. J Am Pharm Assoc. 2014;54:228–40. [DOI] [PubMed] [Google Scholar]
- 8.National Community Pharmacists Association. Frequently asked questions about pharmacy “DIR” fees. Available at: www.ncpa.co/pdf/dir-faq.pdf. Accessed April 8, 2019.
- 9.“2018 Medicare Part D Medication Therapy Management (MTM) Programs: Fact Sheet.” Centers for Medicare and Medicaid Services (CMS). Available at: https://www.cms.gov/Medicare/Prescription-Drug-Coverage/PrescriptionDrugCovContra/Downloads/CY2018-MTM-Fact-Sheet.pdf. Accessed April 8, 2019.
- 10.Miguel A, Hall A, Liu W, et al. Improving comprehensive medication review acceptance by using a standardized recruitment script: a randomized control trial. J Manag Care Spec Pharm. 2017;23:13–21. [DOI] [PMC free article] [PubMed] [Google Scholar]
- 11.Huet A, Frail CK, Lake LM, Snyder ME. The impact of passive and active promotional strategies on patient acceptance of medication therapy management services. J Am Pharm Assoc. 2015; 55: 178–81. [DOI] [PubMed] [Google Scholar]
- 12.Miller DE, Roane TE, Salo JA, Hardin HC. Evaluation of comprehensive medication review completion rates using 3 patient outreach models. J Manag Care Spec Pharm. 2016;22:796–800. [DOI] [PMC free article] [PubMed] [Google Scholar]
- 13.Stafford R, Thomas J, Payakachat N, et al. Using an array of implementation strategies to improve success rates of pharmacist-initiated medication therapy management services in community pharmacies. Res Soc Adm Pharm. 2017;13:938–46. [DOI] [PubMed] [Google Scholar]
- 14.Improving Chronic Illness Care. The CCM. Available at: http://www.improvingchroniccare.org/index.php?p=The_Chronic_Care_Model&s=2. Accessed April 8, 2019.
- 15.Wagner EH. Chronic disease management: what will it take to improve care for chronic illness? Eff Clin Pract. 1998;1(1):2–4. [PubMed] [Google Scholar]
- 16.Improving Chronic Illness Care. Assessment of Chronic Illness Care: Version 3.5. Available at: http://www.improvingchroniccare.org/downloads/acic_v3.5a.doc. Accessed April 8, 2019.
- 17.Bonomi AE, Wagner EH, Glasgow RE, VonKorff M. Assessment of chronic illness care (ACIC): a practical tool to measure quality improvement. Health Serv Res. 2002;37(3):791–820. [DOI] [PMC free article] [PubMed] [Google Scholar]
- 18.Snyder ME, Jaynes HA, Gernant SA, Lantaff WM, Hudmon KS, Doucette WR. Variation in medication therapy management (MTM) delivery: implications for healthcare policy. J Manag Care Spec Pharm. 2018;24:896–902. [DOI] [PMC free article] [PubMed] [Google Scholar]
- 19. Appendix 1.
- 20.Harris Paul A., Taylor Robert, Thielke Robert, Payne Jonathon, Gonzalez Nathaniel, Conde Jose G., Research electronic data capture (REDCap) – A metadata-driven methodology and workflow process for providing translational research informatics support, J Biomed Inform. 2009. April;42(2):377–81. [DOI] [PMC free article] [PubMed] [Google Scholar]
- 21.IBM SPSS software. Available at: https://www.ibm.com/analytics/us/en/technology/spss/. Accessed April 8, 2019.
- 22.SAS analytics platform. Available at: https://www.sas.com/en_us/home.html. Accessed April 8, 2019.
- 23.Powers MF, Bright DR. Pharmacy technicians and medication therapy management. J Pharm Technol. 2008;24:336–9. [Google Scholar]
- 24.Gernant SA, Nguyen MO, Siddiqui S, Schneller M. Use of pharmacy technicians in elements of medication therapy management delivery: a systematic review. Res Soc Adm Pharm. 2018;14:883–90. [DOI] [PubMed] [Google Scholar]
- 25.Vande Griend JP, Rodgers M, Nuffer W. Effect of an advanced pharmacy practice experience on medication therapy management services in a centralized retail pharmacy program. J Manag Care Spec Pharm. 2017;23:561–65. [DOI] [PMC free article] [PubMed] [Google Scholar]
- 26.Lounsbery JL, Green CG, Bennett MS, Pederson CA. Evaluation of pharmacists’ barriers to the implementation of medication therapy management services. J Am Pharm Assoc. 2009;49:51–8. [DOI] [PubMed] [Google Scholar]
- 27.Blake KB, Madhavan SS. Perceived barriers to provision of medication therapy management services (MTMS) and the likelihood of a pharmacist to work in a pharmacy that provides MTMS. Ann Pharmacother. 2010;44(3):424–431. [DOI] [PubMed] [Google Scholar]
- 28.Guthrie KD, Stoner SC, Hartwig DM, et al. Physicians’ preferences for communication of pharmacist-provided medication therapy management in community pharmacy. J Pharm Pract. 2017;30:17–24. [DOI] [PubMed] [Google Scholar]
- 29.Snyder ME, Zillich A, Primack B, Rice K, McGivney M, Pringle J, Smith R. Exploring successful community pharmacist-physician collaborative working relationships using mixed methods. Res Social Adm Pharm 2010;6:307–323. [DOI] [PMC free article] [PubMed] [Google Scholar]
- 30.McGrath S, Snyder ME, Garcia G, Pringle J, Smith R, McGivney M. Physician perceptions of pharmacist-provided medication therapy management: qualitative analysis. J Am Pharm Assoc 2010;50:67–71. [DOI] [PubMed] [Google Scholar]
- 31.Lindell VA, Azar M, Telega E, Kelling S. Review of community based organization and community pharmacy partnerships for preventive care services. Inov Pharm. 2018;9:Article 8. [DOI] [PMC free article] [PubMed] [Google Scholar]
- 32.Lam A Practice innovations: delivering medication therapy management services via videoconference interview. Consult Pharm. 2011;26:764–74. [DOI] [PubMed] [Google Scholar]
- 33.Centers for Medicare and Medicaid Services. Value-Based Programs. Available at: https://www.cms.gov/Medicare/Quality-Initiatives-Patient-Assessment-Instruments/Value-Based-Programs/Value-Based-Programs.html. Accessed April 8, 2019. [Google Scholar]
- 34.Qato DM, Zenk S, Wilder J, Harrington R, Gaskin D, Alexander GC. The availability of pharmacies in the United States: 2007–2015. PLoS ONE. 12:e0183172. [DOI] [PMC free article] [PubMed] [Google Scholar]
Associated Data
This section collects any data citations, data availability statements, or supplementary materials included in this article.