Abstract
The novel coronavirus or COVID-19 has first been found in Wuhan, China, and became pandemic. Angiotensin-converting enzyme 2 (ACE2) plays a key role in the host cells as a receptor of Spike-I Glycoprotein of COVID-19 which causes final infection. ACE2 is highly expressed in the bladder, ileum, kidney and liver, comparing with ACE2 expression in the lung-specific pulmonary alveolar type II cells. In this study, the single-cell RNAseq data of the five tissues from different humans are curated and cell types with high expressions of ACE2 are identified. Subsequently, the protein–protein interaction networks have been established. From the network, potential biomarkers which can form functional hubs, are selected based on k-means network clustering. It is observed that angiotensin PPAR family proteins show important roles in the functional hubs. To understand the functions of the potential markers, corresponding pathways have been researched thoroughly through the pathway semantic networks. Subsequently, the pathways have been ranked according to their influence and dependency in the network using PageRank algorithm. The outcomes show some important facts in terms of infection. Firstly, renin-angiotensin system and PPAR signaling pathway can play a vital role for enhancing the infection after its intrusion through ACE2. Next, pathway networks consist of few basic metabolic and influential pathways, e.g. insulin resistance. This information corroborate the fact that diabetic patients are more vulnerable to COVID-19 infection. Interestingly, the key regulators of the aforementioned pathways are angiontensin and PPAR family proteins. Hence, angiotensin and PPAR family proteins can be considered as possible therapeutic targets. Contact: sagnik.sen2008@gmail.com, umaulik@cse.jdvu.ac.in Supplementary information: Supplementary data are available online.
Introduction
The current outbreak of the COVID-19 pandemic has been proclaimed as a public health emergency by the World Health Organization. Interestingly, these viruses have shown a strong binding with a cell receptor, namely angiotensin-converting enzyme type II (ACE2) through the Spike S virulent protein. The study of Zhang et al. [1] has provided the molecular mechanism of the entry of the spike protein. As per the study, transmembrane proteases play a vital role by creating cleavage in ACE2 and activating ACE2 cell receptor. The significant expression rate of ACE2 and TMPRSS2 have been observed in pulmonary alveolar type II (PAT2) cells in lung [2]. Similarly, each of the vital organs viz., kidney, liver, ileum, bladder, should have certain cell types where significant RNAseq expression of ACE2 and TMPRSS2 is expected to be observed. It is expected that these cell types are participating in nCoV infection. In a cellular condition, the significantly expressed ACE2 can regulate co-interacting functional hubs. Similarly, the transmission rate of the COVID-19 must be engaged with many more molecular members of different cell types. So far, no studies reported the involvement of proteomic samples associated with ACE2. The study of the functional hubs with neighboring proteomic samples can be a key point in terms of therapeutic possibilities by suppressing functional dysregulation during the infection.
In this paper, we have studied the single-cell RNAseq data for lung, ileum, kidney, bladder and liver. The organ-specific cell types and respected markers are extracted depending on both the ACE2 and TMPRSS2 expressions in PAT2 cells. For each of the defined cell types, significant proteomic markers are shortlisted based on the communities of protein–protein interaction network (PPIN) [3] of cell-specific significant transcripts. The functional hubs are identified applying k-means network clustering [4]. However, members of the functional hubs should be associated with pathways. The pathway-driven systems are responsible for regulating the cell functions. In this context, the interconnection of the pathways, associating with the members of the functional hubs, has been revealed through the pathway semantic network.
Methods
Publicly available ScRNASeq datasets of different tissues and organs (bladder [5], ileum [6], kidney [7], liver [8] and lung [9]) from diverse human bodies are curated from GEO (href="https://www.ncbi.nlm.nih.gov/geo/). The details of the acquired datasets are as follows: bladder, GEO accession no. GSE129845 sample GSM3723358; ileum, GEO accession no. GSE134809 sample GSM3972018; kidney, GEO accession no. GSE131685, three healthy kidney tissues; liver, GEO accession no. GSE115469, five healthy human patients; and lung, GEO accession no. GSE122960. The proposed framework of this study is described in Figure 1.
Figure 1.
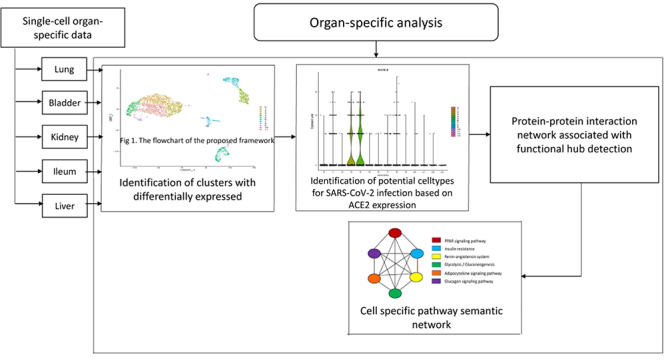
The flowchart of the proposed framework.
Dataset preparation and identification of cell types
Seurat V3.0 [10] is used to process the raw count matrix. To remove the undesired cells from the dataset, unique feature counts over 2,500 or less than 200 are considered. Moreover, cells are filtered with  mitochondrial counts. The next step is to normalize the data after deleting undesirable cells from the dataset. The normalization is obtained by ‘LogNormalize’ function. The data has been scaled by natural log transformation after multiplying with 10,000. Principle Component (Supplementary Fig. S1) is used to construct the k-nearest neighbors graph. Depending on the graph, the cells are clustered using ‘FindClusters’ function which implements Louvain algorithm. These cell clusters are visualized by UMAP techniques. The top differentially expressed gene markers of each cluster are identified with ‘FindMarkers’ function with minimum percentage set to
  using Wilcoxon rank sum statistical test. Finally, the expression level of ACE2 is evaluated from each cluster. It has already been reported in the literature that SARS-COV-2 virus appears to target lung PAT2 cells via the ACE2 host receptor. Thus, the level of ACE2 expression in PAT2 cells has been used as a reference. Any cell type consisting a proportion of positive ACE2 (UMI count, >0) comparable to or greater than that of PAT2 cells are considered. Consequently, the corresponding organs are reported as high risk.
PPIN and Functional Hubs
The organ-specific cell types with significant high rate of ACE2 expression are selected after initial identification. Subsequently, the interaction cores have been identified from PPIN. In this regard, we have utilized STRING database [3]. The top biomarkers, fetched by ‘FindMarkers’ under distinct cellular environment, may be associated with each other. Following that, we have observed the PPINs of the selected biomarkers for each cell types (one dedicated PPIN for one specific cell type). Once we have established the connectivity among the biomarkers, we have aimed to detect the interactive communities, called functional hubs, applying k-means clustering. The number of clusters for the k-means clustering algorithm is set to 3. The edge weights are calculated using the cumulative scores of edge attributes from STRING database. As these weights help to determine the clusters, we are expecting that the functional hubs having ACE2 as a member show strong connectivity with ACE2. These functional hubs are considered for further study.
Pathway semantic
The pathways of the potential markers identified from functional hubs are utilized for the pathway semantic networks. For the selected pathways, a set of biological process are considered to calculate the semantic similarity. Wang [11] defined the semantic value of term  as the aggregate contribution of all terms in
  to the semantics of term
  , terms closer to term
  in
in  contribute more to its semantics. GO term T is defined as
  and
and  and
and  represent set of GO terms and set of GO terms connecting edges, respectively.
  includes term
  as well as all its ancestors. Thus, defined the contribution of a GO term
  to the semantic of GO term
  as the
  of GO term
  related to term
  . For any of term
  in
in  , its
, its  related to term
  ,
,  is defined as:
 |
(1) |
Here,  is the semantic contribution factor for the edge
  linking GO term
  with its child term
  . After calculating the
  for the GO term in
  , the semantic value of GO term T,
  is defined as follows:
 |
(2) |
For two given GO term,  and
and  , the semantic similarity between them is defined as
 |
(3) |
In Equation (3), the method proposed by Wang et al. [11] is used to compute the GO semantic similarity ( ). Moreover,
  is the
  of GO term
  related to term
  and
and  is the
  of GO term
  related to term
  .
.  is the set of GO terms including term
  as well as all its ancestors. Based on the semantic similarity of GO terms, best-match average (BMA) [12] strategy is performed to compute semantic similarity among sets of GO terms associated with the markers associated with a particular pathway, which is defined as
 |
(4) |
Here, gene G1 annotated by GO terms set  and G2 annotated by
  .
.
Pathway ranking based on PageRank algorithm
PageRank (PR) [13] algorithm is introduced by Google to rank the searched pages in their search engine. It has been applied to calculate rank of the nodes from graph. The algorithm utilizes probability distribution depending on the occurrence of each node and measures the connection weight among different nodes. The node rank has been defined as follows:
 |
(5) |
where the rank of node  is relied on the
  values for each connected node b
 B
B , divided by
  , edges from node a. Here, the pathways are represented by nodes and the links are weighted edges. The pathway semantic network is a weighted network where the weighted edges signify semantic strength between two pathways. Therefore, the PR-based ranks signify the dependency and influence of the pathway nodes in the network.
Results
The single-cell RNAseq data of different human organs revealed the information regarding the responsible cell types. These vital organs can be subdivided into three classes based on their functions. Interestingly, most of the cell types associated with a significant expression value of ACE2 also possess a significant expression value of AGT and PPAR family transcripts, e.g. PPARA and PPARG. For these important genes, a cell type-specific feature plot is reported in Supplementary Fig. S2. However, only those cell types have these significantly expressed samples where TMPRSS2 shows a higher expression. In Supplementary Table S3, the organ-specific potential cell types and corresponding significant samples are mentioned. The highly significant samples are selected based on the functional hub which is strongly associated with ACE2. The PPINs of each selected cell type are shown in Supplementary Fig. S4.
Cell-specific functional hubs from lung
PAT2 are detected as potential cells in lung where ACE2, AGT and PPARA show significant expression. In Figure 2, the violin plot of the ACE2 expression level implies that the lung is highly vulnerable towards viraemia. However, we have also identified two different cells, i.e. plasma cell and mast cell. In case of plasma cells, all three transcripts are significantly expressed, whereas in mast cells AGT and ACE2 are significantly expressed.
Figure 2.
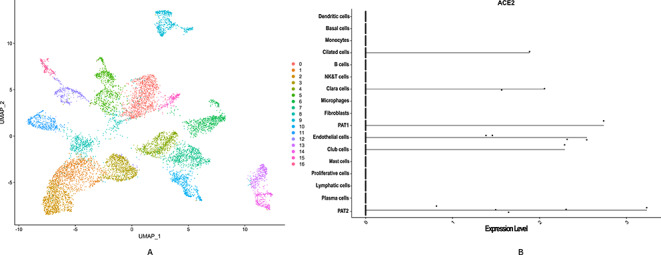
Lung single-cell RNAseq data analysis showed that ACE2 is highly expressed in pulmonary alveolar type II cell (PAT2). (A) The diverse cell types present in lung are categorized into 17 clusters. (B) Violin plot is used to show the expression level distribution of ACE2 across the cell types. Including PAT2, the ACE2 is also expressed in PAT1, Clara, Club and Cilated cell types.
Cell-specific functional hubs from bladder and kidney
In bladder, ACE2 shows higher affinity to urothelial cells reported in Figure 3. Instead of PPARA, PPARG from PPAR family is showing a significant expression level. From kidney, ACE2 is showing higher affinity in proximal tubule cells and smooth muscle cells (shown in Figure 4).
Figure 3.
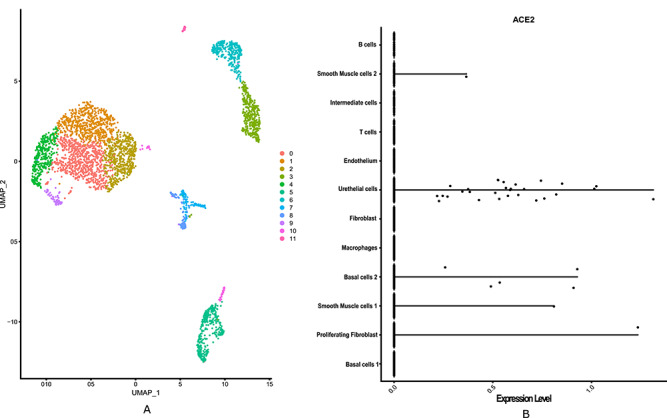
Bladder single-cell RNAseq data analysis showed that ACE2 is highly expressed in urethelial cell. (A) The diverse cell types present in bladder are categorized into 12 clusters. (B) Violin plot is used to show the expression level distribution of ACE2 across the clusters labelled with corresponding cell types. The plot shows smooth muscle cells 1 and 2 and basal cells 2, and proliferating fibroblast cells also possess significant expression level of ACE2.
Figure 4.
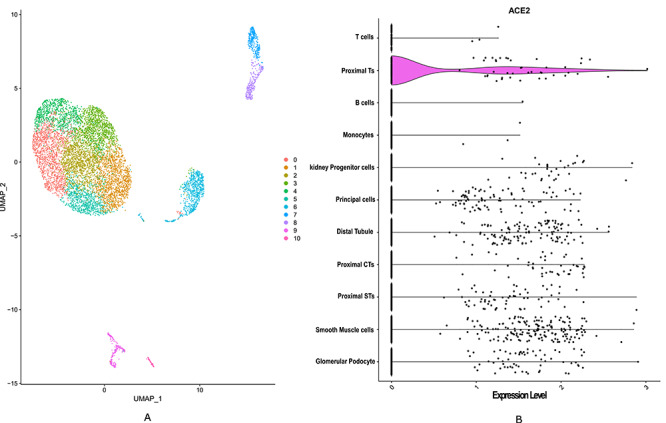
ScRNASeq data analysis of kidney uncovered that proximal tubule cells show high expression level of ACE2. (A) The diverse cell types present in kidney are categorized into 11 clusters. (B) The violin plot is used to show the expression level distribution of ACE2 across the clusters. The clusters are labelled as corresponding cell types. ACE2 is expressed in multiple cell types such as in glomerular podocyte, smooth muscle cells, proximal straight tubules (STs), proximal convoluted tubules (CTs), distal tubule, principal cell, kidney progenitor cell, monocytes, B cell and T cell types.
Cell-specific functional hubs from ileum and liver
Ileum and liver is a region of the metabolic systems. Both of the organs have ACE2-positive epithelial-like cells. In the case of ileum, enterocyte cells and ciliated epithelial cells have a significant expression of ACE2, AGT and PPARA (Figure 5). However, Figure 6 that reveals that the expression level is low compared to other organs. Similarly, cholangiocytes is one of the epithelium cell classes essentially found in liver tissue. The markers collectively ACE2, AGT and PPARA are detected with higher expression value in these cell types.
Figure 5.
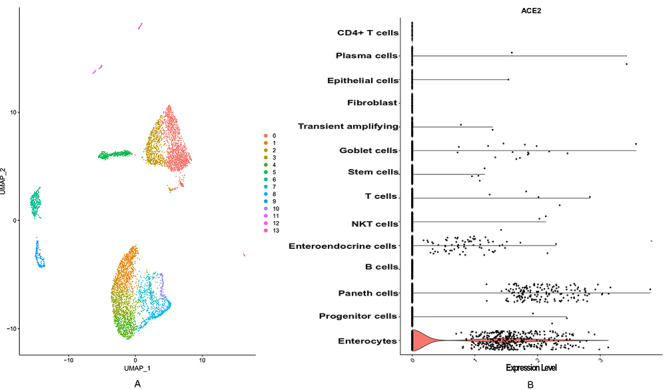
The ScRNASeq data analysis of ileum revealed that ACE2 is highly expressed in enterocyte progenitor cell. (A) The diverse cell types present in ileum are categorized into 14 clusters. (B) The clusters in violin plot is labelled with cell types depending on the present biomarkers. The expression level of ACE2 across the cell types depicts that it is expressed in most of the cell types of ileum.
Figure 6.
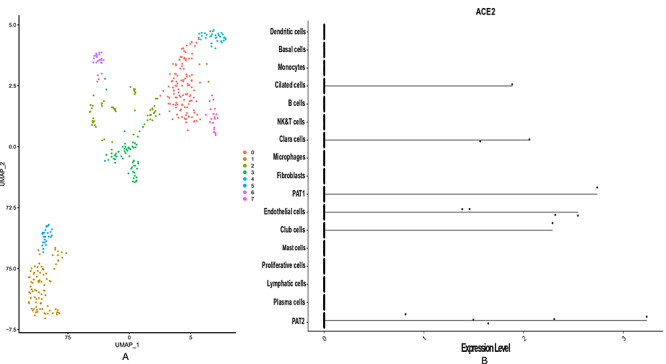
Liver single-cell RNAseq data analysis revealed that ACE2 is highly expressed in cholangiocytes. (A) The diverse cell types present in liver are categorized into 8 clusters. The clusters are labelled with the name of cell types. (B) The Violin plot is used to show the expression level distribution of ACE2 across the cell types. Cell types hepatocytes and endothelial also show high expression level of ACE2.
Pathway semantic network
The influential markers which show an impact on the functional hub obtained from cell type-specific PPINs are further studied. Pathways that possess the maximum number of potential markers and also likely to be triggered during COVID-19 infection are curated from Reactome database [14] and KEGG Pathway database [15]. We observed that the organ-specific cell types shared most of the common pathways but their association with markers differ from each other. Considering the biological process [16] associated with each pathway, the semantic similarity graphs have been constructed. ACE2 shows high expression rate in three different cell types of lung. We have provided pathway semantic networks for Mast, PAT2 and Plasma cell in Fig. 7A, B and C, respectively. In bladder, ACE2 is expressed in one particular cell type, i.e. urothelial cells (shown in Figure 8A). Whereas in kidney, proximal tubule cell (shown in Figure 8B) and smooth muscle cell (shown in Figure 8C) possesses high expression rate of ACE2. In Ileum cell types such as ciliated epithelial cells (shown in Figure 9A) and enterocyte progenitor cell (shown in Figure 9B) show significant expression level of ACE2. Similar like bladder organ, in liver ACE2 is expressed in one particular cell type, i.e. cholangiocytes cells (shown in Figure 9C). Show significant expression level of ACE2. In pathway semantic graphs, the nodes represent a particular pathway and the weighted edges define the similarity value between two pathways to depict the maximum number of sharing biological processes.
Figure 7.
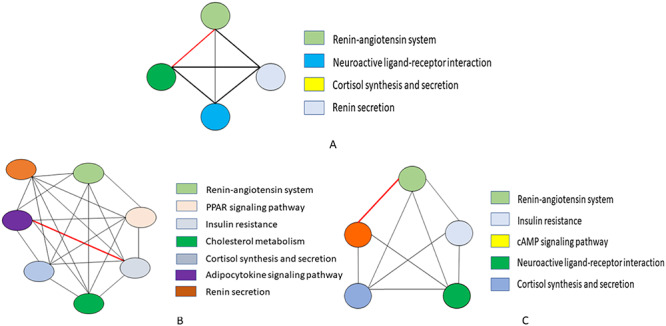
A cell-type-specific pathway semantic similarity graph: (A) mast cell type, (B) PAT2 and (C) plasma cell of lung are established by considering the biological process associated with each pathway. Here, the nodes represent a particular pathway and their connecting edges define the weight between two pathways in order to apprehend the highest sharing biological process. The red marked bold edge in the graphs indicate the higher association score of between those pathways.
Figure 8.
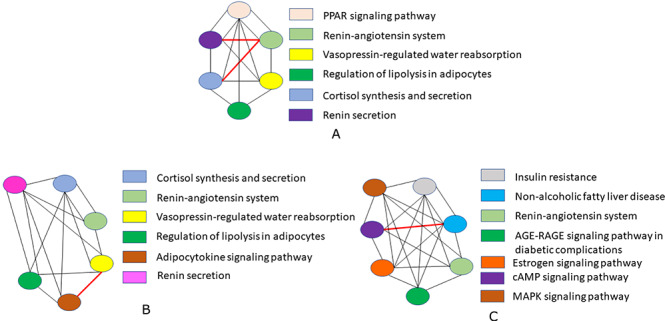
(A) Urothelial cell type of bladder and two cell types. (B) Proximal tubule cells. (C) Smooth muscle of kidney are considered for performing pathway semantic similarity graph. Each color node of the graph represents a particular pathway associated with the cell type and connection between the pathways are interpreted through the edges. The red marked bold edge is used to exhibit the highest relationship between the pathways.
Figure 9.
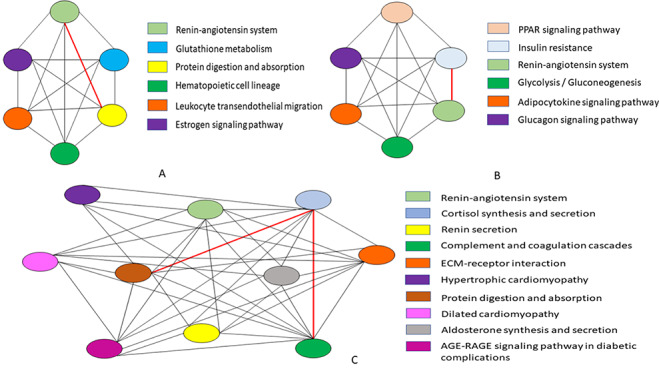
Considering the biological processes associated with each pathway, a semantic similarity graph is established for the following: (A) ciliated epithelial cells, (B) enterocyte progenitor cell type of ileum, (C) cholangiocytes cell type of liver. The nodes of the graphs represent a particular pathway and their connecting edges define the weight between two pathways in order to apprehend the highest sharing biological process. The red marked bold edge in the graphs indicate the higher association score of between those pathways.
Moreover, during the pathway semantic calculation, a resultant matrix is obtained, which is utilized o perform the PR algorithm for each cell type and ranked them according to the score. We found that the renin-angiotensin system (RAS) and PPAR signaling pathway secured high rank in most of the prime cell types. Additionally, insulin resistance also secures an important position in the three organs. Figure 10, provides a heatmap corresponding to the PR values for each pathway from different cell types. As discussed earlier, PR values and corresponding ranks are calculated to show influence of each pathway in the network. According to the overall ranking and scoring, the pathways are well segregated in the heatmap. The pathways having AGT and PPAR family proteins are ranked high in ileum where insulin resistance pathway is missing. Also, PPAR signaling pathway is absent in liver cell types. Interestingly, cortisol synthesis and secretion pathway plays significant roles in some of the cell types.
Figure 10.
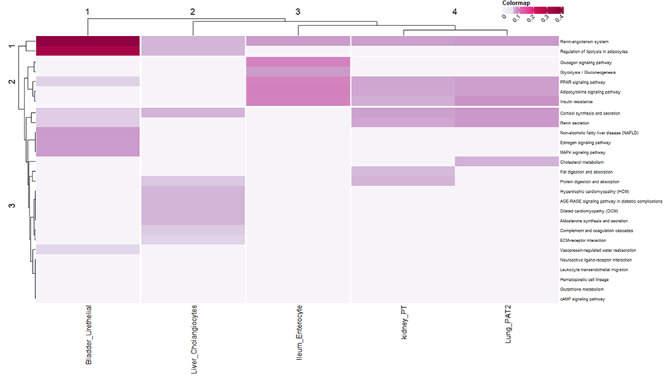
The heatmap is performed depending on the PageRank algorithm scores of each pathway. According to the overall ranking and scoring, the pathways are well segregated in the heatmap. The organ-specific cell types that possess high expression level of ACE2 are considered here. The pathways having AGT and PPAR family are ranked high in ileum, whereas insulin resistance is missing. Also, PPAR signaling pathway is absent in liver cell types. Whereas, cortisol synthesis and secretion is also found as a key player in some of the cell types.
To map the relation between affected cells and pathway regulation inside an individual cell type, a cell-specific diagram is shown in Figure 11 for all organs. Only the highly ACE2-expressed cell type of each organ has been shown. It is revealed from the figure that PPAR signalling pathway and RAS are the major pathways even after infection. Other pathways are also reported according to their rank. Similarly for bladder and kidney, this cell type-specific study is performed and some pathways are found to be common with lung but the affecting rate is different. Finally, the cell-specific pathway study is shown for liver and ileum. Interestingly, the organs share common pathways among them. As mentioned earlier, the PPAR signalling pathway is missing in the cholangiocytes cell type from liver.
Figure 11.
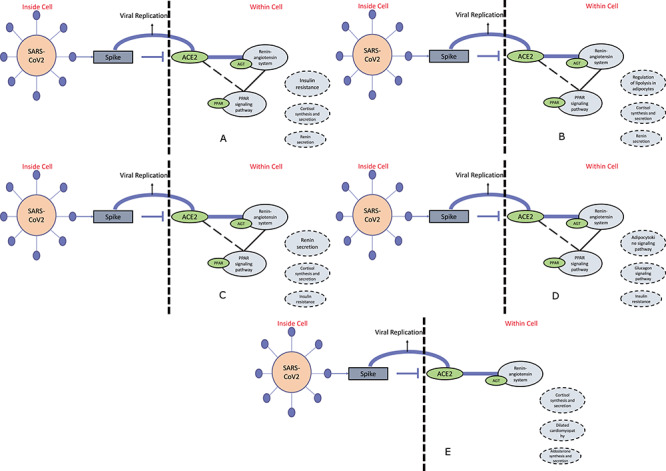
To map the results from pathway semantic and PageRank algorithm within the cell environment, in (A) for PAT2 cell type of lung the top three ranked pathways excluding RAS and PPAR signaling pathway are shown, whereas the flowchart in (B) urothelial cells and (C) proximal tubule cells of organ bladder and kidney, respectively, show three ranked pathways including RAS and PPAR signaling pathway. For ileum (D) rnterocyte progenitor cells and (E) cholangiocytes of liver, three pathways excluding RAS and PPAR signaling pathway are reported. As these two pathways are missing in cholangiocytes cell type. These flowcharts of organ-specific cell types help to reveal the information regarding activating other pathways at the time of this epidemic disease.
Discussion
The cell-specific findings have provided a trio of significantly expressed sample viz., ACE2, PPAR family samples (in bladder PPARG) and AGT. As per the potential cell types, if ACE2 and TMPRSS2 are co-expressed [17], ACE2 has a higher propensity of associating with broader functional hubs. Co-expressed markers, AGT and PPAR/PPAG can act as connection between the functional hub and ACE2. PPAR family proteins are involved in immune cells, e.g. macrophages and dendritic cells. Erol had reported the importance of PPARG in pioglitazone study on nCoV infection [18]. Singla et al. [19] have reported a therapeutic strategy, namely statin, for acute lung injury. The study has initiated the protocol of anti-inflammatory effects through transforming growth factor- and peroxisome proliferator-activated receptor-
 . Therefore, the significance of the PPAR family proteins can be observed and this strategy can be re-utilized as therapeutic protocol for the disease. Similarly, many different articles have reported the importance of the peroxisome-induced immune response against COVID-19 infection [20, 21]. On other hand, AGT and ACE2 are directly involved with RAS [22]. Huang et al. have reported the RAS inhibition for H7N9 infection [23]. Also, Kuster et al. report the possibility of RAS inhibition as a therapeutic measure for COVID-19 [24]. In the study, AGT and PPAR family protein have secured vital positions in cellular functional hubs where ACE2 act as an important member. Therefore, there are therapeutic possibilities connected with these two categories of samples as well.
The PPI of the corresponding selected members can only describe the interaction perspective. However, the activities in inner host cell system remain unveiled. Pathway semantic help to understand internal pathway connectivity. In the last part, we have already discussed the significance of RAS pathway. In Zhang et al. [1], the functional perspective of the renin-angiotensin pathway has also been described. As per the study, the attenuation of RAS pathway can turn down the rate of viral replication. However, the prolonged effect of knocking down this pathway has not been shown. Similarly, the functionality of PPAR family proteins is previously discussed. These functionalities are completely interdependent. On the other hand, Mehta et al. have considered the infection as a cytokine storm syndrome [25]. In the significant cell-specific marker detection, each of the cell types can produce the TNF- family proteins. Therefore, peroxisome proliferator-activated receptor-based statin technique [19] might have worked due to its anti-inflammatory actions. However, we have identified few potential pathways in most of prime cell types from each of the organs viz., renin-angiotensin pathway, PPAR-signaling pathways and adipocytokine signaling pathway. Also, few basic metabolic pathways are identified. Interestingly, insulin resistance pathways are featured in the kidney-, ileum- and -ung-specific cell types. These may explain the reason behind the vulnerability of diabetic patients [26]. As per heatmap, RAS pathways and PPAR signalling (in most of the organ specific prime cell types) may act as key regulators for most of the cellular systems (as they are securing decent position in two separate modules). Hence, inhibition of the AGT and PPAR family protein is possibly a key therapeutic target to attenuate the effect of infection by down-regulating the aforementioned pathways.
Conclusion
The single-cell-based bioinformatic strategy applied in this article has aimed to unveil the organ-specific probable infected cell types. The prime objective of the study is to determine the possible pathway connectivity associating with ACE2 dysregulation during COVID-19 infection. Initially, we have started with the detection of the cell types from the five organs. Also, each of the influential cell types has a list of biomarkers. Markers are sorted based on interacting functional hubs, connected with ACE2. Interestingly, AGT and PPAR family transcripts are common in each of the functional hubs. These two transcripts connect ACE2 and the rest of the samples from the functional communities. As per relevant literature, angiotensin and PPAR family proteins are previously observed to participate in different infections like COVID-19. In this experiment, the impact of PPAR signalling pathways and RAS systems has been shown in the hub-specific pathway semantic networks. The network shows that the significant regulation of the mentioned pathways can affect the usual functions of the normal metabolic pathways as well as few other pathways, for instance insulin resistance. Hence, these samples are important therapeutic candidates.
Key Points
This study is completely based on a single-cell, organ-specific data.
Initially, we identified organ-specific cell types viz., PAT2 cell, urothelial cells, kidney proximal tubule cells, enterocyte cells and cholangiocytes for the lungs, bladder, kidney, ileum and liver, respectively.
For each of the cell types, internal pathway network has been shown.
From the network connectivity, it has been observed that regular metabolic pathways are highly associated with the infection. Interestingly, insulin resistance carries a vital position in the inter-pathway connectivity.
Angiotensin and PPAR signaling pathways are key connector after the viral intrusion.
Supplementary Material
Acknowledgments
The work of A.D. and S.S. is supported by DST-INSPIRE fellowship. Most importantly, we would like to thank the reviewers for their valuable comments and suggestions which helped us improve the quality of the paper.
Ashmita Dey is a junior research fellow at the Department of Computer Science and Engineering, Jadavpur University, India. She is interested on analyzing the cell-to-cell heterogeneity from publicly available single-cell RNAseq data.
Sagnik Sen is a senior research fellow at the Department of Computer Science and Engineering, Jadavpur University, India. His interests lie in the protein analysis with epigenetics and structural feature learning.
Ujjwal Maulik is a professor and the former chair of the Department of Computer Science and Engineering, Jadavpur University, India. His research interest include computational intelligence, pattern recognition, bioinformatics, data mining, optimization and social networking. Prof. Maulik is the recipient of Alexander von Humboldt Fellowship during 2010, 2011 and 2012 and senior associate of ICTP, Italy, during 2012–2018. He is the fellow of Indian National Academy of Engineering, India, International Association for Pattern Recognition, USA, and Institute of Electrical and Electronics Engineers, USA.
Contributor Information
Ashmita Dey, Department of Computer Science and Engineering, Jadavpur University, India.
Sagnik Sen, Department of Computer Science and Engineering, Jadavpur University, India.
Ujjwal Maulik, Department of Computer Science and Engineering, Jadavpur University, India.
Author Contribution
A.D. and S.S. have conceptualizaed and performed the work. A.D., S.S. and U.M. have drafted the manuscript. The work has been supervised by U.M. and S.S.
References
- 1. Zhang H, Penninger JM, Li Y, et al. Angiotensin-converting enzyme 2 (ACE2) as a SARS-CoV-2 receptor: molecular mechanisms and potential therapeutic target. Intensive Care Med 2020;46:586–90. [DOI] [PMC free article] [PubMed] [Google Scholar]
- 2. Lukassen S, Chua RL, Trefzer T, et al. SARS-COV-2 receptor ACE2 and tmprss2 are primarily expressed in bronchial transient secretory cells. EMBO J 2020;88:913–24. [DOI] [PMC free article] [PubMed] [Google Scholar]
- 3. Szklarczyk D, Franceschini A, Kuhn M, et al. The STRING database in 2011: functional interaction networks of proteins, globally integrated and scored. Nucleic Acids Res 2011;39:D561. [DOI] [PMC free article] [PubMed] [Google Scholar]
- 4. MacQueen J. B. Some Methods for classification and Analysis of Multivariate Observations. In: Proceedings of 5th Berkeley Symposium on Mathematical Statistics and Probability 1, 281, 1967. [Google Scholar]
- 5. Yu Z, Liao J, Chen Y, et al. Single-cell transcriptomic map of the human and mouse bladders. J Am Soc Nephro 2019;30:2159. [DOI] [PMC free article] [PubMed] [Google Scholar]
- 6. Wang Y, Song W, Wang J, et al. Single-cell transcriptome analysis reveals differential nutrient absorption functions in human intestine. J Exp Med 2020;217:1. [DOI] [PMC free article] [PubMed] [Google Scholar]
- 7. Liao J, Yu Z, Chen Y, et al. Single-cell RNA sequencing of human kidney. Scientific Data 2020;7:1. [DOI] [PMC free article] [PubMed] [Google Scholar]
- 8. MacParland SA, Liu JC, McGilvray ID. Single cell RNA sequencing of human liver reveals distinct intrahepatic macrophage populations. Nat Commun 2015;9:1. [DOI] [PMC free article] [PubMed] [Google Scholar]
- 9. Reyfman PA, Walter N, Joshi JM, et al. Single-cell transcriptomic analysis of human lung provides insights into the pathobiology of pulmonary fibrosis. Am J Respir Crit Care Med 2016;199:1517. [DOI] [PMC free article] [PubMed] [Google Scholar]
- 10. Stuart T, Butler A, Hoffman P, et al. Comprehensive integration of single-cell data. Cell 2019;177:1888. [DOI] [PMC free article] [PubMed] [Google Scholar]
- 11. Wang JZ, Du Z, Payattakool R, et al. A new method to measure the semantic similarity of GO terms. Bioinformatics 2007;23:1274–81. [DOI] [PubMed] [Google Scholar]
- 12. Pesquita C, et al. Metrics for GO based protein semantic similarity: a systematic evaluation. BMC Bioinformatics 2008;9:1–16. [DOI] [PMC free article] [PubMed] [Google Scholar]
- 13. Page L., Brin S., Motwani R. and Winograd T.. The pagerank citation ranking: Bringing order to the web., tech. rep. Stanford InfoLab; (1999). [Google Scholar]
- 14. Croft D, et al. Reactome: a database of reactions, pathways and biological processes. Nucleic Acids Res 2011;39:D691–7. [DOI] [PMC free article] [PubMed] [Google Scholar]
- 15. Kanehisaa M, Goto S. KEGG as a reference resource for gene and protein annotation. Nucleic Acids Res 2000;28:27–30. [DOI] [PMC free article] [PubMed] [Google Scholar]
- 16. Kuleshov MV, Jones MR, Rouillard AD, et al. Enrichr: a comprehensive gene set enrichment analysis web server 2016 update. Nucleic Acids Res 2016;44:90. [DOI] [PMC free article] [PubMed] [Google Scholar]
- 17. Zhang H, Kang Zi, Gong H, et al. Digestive system is a potential route of covid-19: an analysis of single-cell coexpression pattern of key proteins in viral entry process. Gut 2000;1. [Google Scholar]
- 18. Erol A. Pioglitazone treatment for the COVID-19-associated cytokine storm. OSFPREPRINTS 2020;1. [Google Scholar]
- 19. Singla S, Jacobson JR. Statins as a novel therapeutic strategy in acute lung injury. Pulm Circ 2012;2:397. [DOI] [PMC free article] [PubMed] [Google Scholar]
- 20. Taghizadeh-Hesary F, Akbari H. The powerful immune system against powerful COVID-19: a hypothesis. Med Hypotheses 2020;2020:1–3. [DOI] [PMC free article] [PubMed] [Google Scholar]
- 21. South AM, Diz DI, Chappell MC. COVID-19, ACE2, and the cardiovascular consequences. Am J Physiol-Heart Circ Physiol 2020;318:1084–90. [DOI] [PMC free article] [PubMed] [Google Scholar]
- 22. South AM, Tomlinson L, Edmonston D, et al. Controversies of renin-angiotensin system inhibition during the COVID-19 pandemic. Nat Rev Nephrol 2020;1:111. [DOI] [PMC free article] [PubMed] [Google Scholar]
- 23. Huang F, Guo J, Zou Z, et al. Angiotensin II plasma levels are linked to disease severity and predict fatal outcomesin H7N9-infected patients. Nat Commun 2014;5:1. [DOI] [PMC free article] [PubMed] [Google Scholar]
- 24. Kuster GM, Pfister O, Burkard T, et al. Ras inhibition as a therapeutic chance associated with covid-19. Eur Heart J 2020. [Google Scholar]
- 25. Mehta P, McAuley DF, Brown M, et al. COVID-19: consider cytokine storm syndromes and immunosuppression. The Lancet 2020;395. [DOI] [PMC free article] [PubMed] [Google Scholar]
- 26. Madsbad S. COVID-19 infection in people with diabetes. Endocrinology 2020;2020:1. [Google Scholar]
Associated Data
This section collects any data citations, data availability statements, or supplementary materials included in this article.


