

Summary
The thiazolidinediones (TZDs) are ligands of PPARγ that improve insulin sensitivity, but their use is limited by significant side effects. Recently, we demonstrated a mechanism wherein TZDs improve insulin sensitivity distinct from receptor agonism and adipogenesis: reversal of obesity-linked phosphorylation of PPARγ at Serine 273. However, the role of this modification hasn’t been tested genetically. Here we demonstrate that mice encoding an allele of PPARγ which cannot be phosphorylated at S273 are protected from insulin resistance, without exhibiting differences in body weight or TZD-associated side effects. Indeed, hyperinsulinemic-euglycemic clamp experiments confirm insulin sensitivity. RNA-seq in these mice reveals reduced expression of Gdf3, a BMP family member. Ectopic expression of Gdf3 is sufficient to induce insulin resistance in lean, healthy mice. We find Gdf3 inhibits BMP signaling and insulin signaling in vitro. Together, these results highlight the diabetogenic role of PPARγ S273 phosphorylation and focuses attention on a putative target, Gdf3.
Keywords: Obesity, Insulin resistance, PPARγ S273 phosphorylation, GDF3, macrophage, adipose tissue, inflammation, diabetes, TGF-β, BMP
eTOC blurb
Hall et al. show that mice lacking phosphorylation at Serine 273 of PPARγ are protected from developing insulin resistance in response to high fat diet feeding, associated with dramatically reduced levels of Gdf3. Gdf3 in turn is sufficient to cause impaired insulin signaling both in vitro and in vivo.
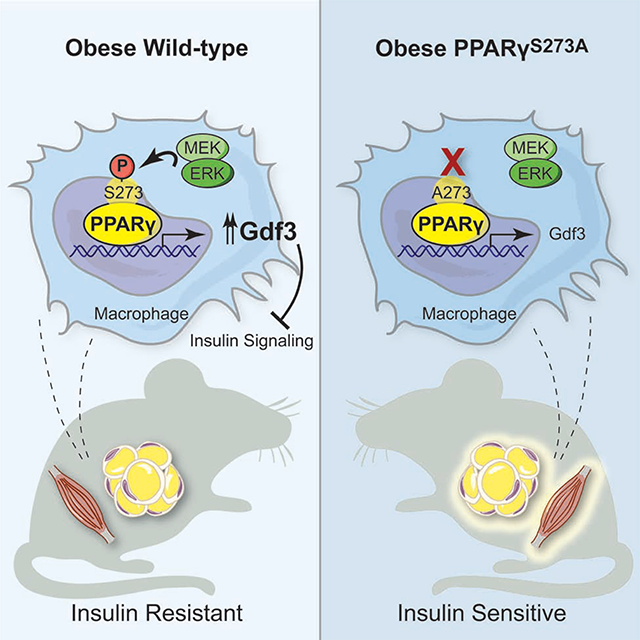
Graphical Abstract
Introduction
Type 2 diabetes (T2D) is one of obesity’s most tightly linked comorbidities, and its prevalence is rising in parallel with the global obesity epidemic (Boden, 1997). T2D results from elevated glycemia consequent to insulin resistance and beta cell failure (Stratton et al., 2000). Although there are several available glucose-lowering agents, few address the underlying pathophysiology of this disease. The thiazolidinediones (TZDs) are a class of insulin-sensitizing anti-diabetic drugs capable of delaying or even preventing the onset of diabetes (DeFronzo et al., 2011). Despite potent insulin sensitization, the clinical use of TZDs has declined due to adverse side effects (Soccio et al., 2014). As ligands for the nuclear receptor peroxisome proliferator activated receptor-γ (PPARγ), the therapeutic actions of TZDs have been assumed to result from their classical agonism towards PPARγ. This agonism drives adipocyte differentiation and lipogenesis in fat tissues (Lehmann et al., 1995). PPARγ is most highly expressed in adipose tissue, where it was first characterized as a master regulator of adipocyte differentiation and function (Tontonoz and Spiegelman, 2008). Nonetheless, activation of PPARγ improves insulin sensitivity owing to its diverse roles in both adipocyte and non-adipocyte cells, including macrophages, T-cells, myocytes, and other cell types (Bouhlel et al., 2007; Cipolletta et al., 2012; Hevener et al., 2007; Odegaard et al., 2007). PPARγ is intimately linked to insulin sensitivity, and genetic variants in the PPARG locus associate with diabetes risk (Altshuler et al., 2000; Gouda et al., 2010; Majithia et al., 2014).
We have recently shown that, in addition to PPARγ agonism, TZDs have a second biochemical role, blocking phosphorylation on PPARγ at serine 273 (Choi et al., 2010). Importantly, phosphorylation of this residue in adipose tissue increases in murine models of obesity, and its reversal correlates with the anti-diabetic effects of TZD administration in obese patients and rodents (Choi et al., 2010; Mayoral et al., 2015). Moreover, synthetic ligands have been generated that prevent PPARγ S273 phosphorylation in the absence of PPARγ agonism. These non-agonist PPARγ ligands exhibit profound glucose-lowering effects with reduced side effects, such as weight gain and fluid retention (Amato et al., 2012; Choi et al., 2011; Choi et al., 2014). Likewise, inhibition of the major protein kinase responsible for PPARγ S273 phosphorylation, extracellular signal-regulated kinase (ERK), improves insulin sensitivity in obese animals (Banks et al., 2015). Understanding the specific mechanisms linking insulin sensitivity with reversal of obesity-linked PPARγ S273 phosphorylation is thus attractive as a new therapeutic strategy for type 2 diabetes, as well as other conditions linked to insulin-resistance such as Polycystic Ovarian Syndrome.
Here, we specifically address the contribution of PPARγ S273 phosphorylation to the development of insulin resistance, using a genetically modified mouse model where PPARγ cannot be phosphorylated at S273. These data demonstrate that genetic prevention of PPARγ S273 phosphorylation is an insulin-sensitizing event and is associated with decreased levels of Gdf3 in adipose tissues and skeletal muscle. Gdf3 is therefore a potential biomarker of PPARγ S273 phosphorylation and insulin resistance. Neutralization of Gdf3 may provide an insulin-sensitizing therapeutic approach.
Results
Improved insulin sensitivity in mice with non-phosphorylatable PPARγ S273
Reversal of obesity-linked PPARγ S273 phosphorylation with small-molecule PPARγ ligands correlates with anti-diabetic properties in humans and mice. However, it is unknown whether genetic modification of this site will result in chronic improvements in insulin sensitivity. To test this, we have generated a genetic mouse model in which PPARγ cannot be phosphorylated at S273. Using homologous recombination, a single nucleotide was changed to cause a serine to alanine substitution at codon 273 of PPARγ (Suppl. Fig. 1A, 1B). Homozygous knock-in mice (PPARγS273A/S273A, hereafter referred to as PPARγA/A) were generated using C57BL/6 ES cells and were born at the expected Mendelian frequencies. Whereas wildtype (WT) mice made obese by exposure to a high fat diet contain PPARγ that is phosphorylated at S273 in adipose tissue, PPARγ from PPARγA/A mice is exclusively unphosphorylated (Suppl. Fig. 1C). PPARγ S273 phosphorylation increases with progressive obesity (Choi et al., 2010). Consequently, WT mice are predicted to have little PPARγ phosphorylation in the lean state, rendering them phenotypically identical to lean PPARγA/A mice. On a standard chow diet, PPARγA/A mice gain weight similarly, have comparable body compositions, and respond similarly to WT controls in glucose tolerance and insulin tolerance tests (Suppl. Fig. 2A–D). Accordingly, in the absence of stimuli to promote PPARγ phosphorylation, differentiation of primary adipocytes is unchanged between genotypes (Suppl. Fig. 3A). Gene expression of WT and PPARγA/A primary adipocytes revealed similar mRNA levels of the differentiation markers Pparg2, Fabp4, Cebpa, Lpl, and Cd36 (Suppl. Fig. 3B). These data confirm earlier work that modulation of PPARγ S273 phosphorylation is neither necessary nor sufficient to affect adipogenesis. We also examined baseline differences in expression of a gene set previously identified using PPARγ−/− cells reconstituted with viruses expressing WT or S273A PPARγ (Choi et al., 2010). Surprisingly, expression of these genes was not significantly different in primary adipocytes differentiated ex vivo from WT and PPARγA/A mice (Suppl. Fig. 3C).
Given that PPARγ S273 is phosphorylated in the setting of high-fat feeding (Choi et al., 2010), we maintained PPARγA/A and WT littermate mice on a high-fat diet (HFD) to promote obesity and insulin resistance. PPARγA/A and WT mice experienced equivalent weight gain (Fig. 1A) with similar fat and lean body mass composition (Fig. 1B). As PPARγ activation with TZDs is associated with weight gain (Fonseca, 2003; Lu et al., 2011), we assessed energy balance by indirect calorimetry experiments in PPARγA/A mice. There were no significant differences observed for VO2, VCO2, calculated energy expenditure, food intake, body temperature, overall energy balance, locomotor activity, or ambulatory activity between genotypes (Suppl. Fig. 4A–4B). We did observe a small but significant decrease in RER in the PPARγA/A animals, which is suggestive of increased fatty acid oxidation (Suppl. Fig. 4A).
Figure 1. Improved insulin sensitivity in mice with non-phosphorylatable PPARγ S273.

Male wildtype (+/+) and PPARγA/A (A/A) mice were fed high-fat diet (HFD) for 16 weeks. A. Body weight of mice during HFD feeding (n = 6 +/+, 5 A/A). B. Body composition of mice at 16 weeks of HFD feeding. C. Glucose tolerance test (1 g glucose/kg body weight) after 15 weeks on HFD. D. Insulin tolerance test (2 U insulin/kg body weight) after 16 weeks on HFD. C-D. Right, area under the curve (AUC) for the respective test. Results are representative of three independent experiments. E. Fasting insulin levels in male mice on HFD for 16 weeks and fasted overnight (n = 6 +/+, 5 A/A). F. Glucose (3 g glucose/kg body weight) stimulated insulin levels at indicated timepoints for male mice on HFD for 17 weeks (n = 6 +/+, 5 A/A). G-L. Hyperinsulinemic-euglycemic clamps in HFD-fed mice (n = 4 +/+, 5 A/A). G. Glucose infusion rate (GIR). H. Whole body glucose uptake (GU). I. Glucose uptake into skeletal muscle. J. Glucose uptake into epididymal white adipose tissue. K. Percentage suppression of endogenous glucose production (EGP). L. Percentage suppression of free fatty acids. M-N. Insulin sensitivity as determined by insulin-stimulated Akt phosphorylation (Ser 473) in tissues of HFD-fed +/+ and A/A mice. M. Immunoblot analyses of skeletal muscle, liver, inguinal white adipose tissue (iWAT), and epididymal white adipose tissue (eWAT). N. Quantification of blots in M. Results are representative of at least two independent experiments. Data are presented as mean ± SEM; *, P < 0.05; and **, P < 0.01 by Student’s t test (A-L) and one-way ANOVA with Newman-Keuls Multiple Comparison test (N).
We next assessed the effect of PPARγ phosphorylation on glucose homeostasis in HFD-fed mice. Similar to effects observed in chow-fed mice, glucose tolerance was comparable between genotypes (Fig. 1C and Suppl Fig. 2C). In contrast, insulin tolerance testing in HFD-fed mice revealed PPARγA/A mice to be more responsive to insulin, as evidenced by a significantly enhanced glucose lowering response (Fig. 1D). To eliminate the possibility of pancreatic beta cell dysfunction, we assessed both fasting insulin levels and glucose-stimulated insulin levels in HFD fed mice and found no difference between genotypes (Fig. 1E and 1F). To better understand the insulin sensitivity phenotype, we performed hyperinsulinemic-euglycemic clamps on HFD-fed mice. We observed increases in the glucose infusion rate (GIR) required to maintain euglycemia in mutant mice compared to controls, indicating improved insulin sensitivity per se (Fig. 1G). The primary factor contributing to the increased GIR is elevated whole-body glucose utilization, with pronounced effects observed in skeletal muscle but not white adipose tissue (WAT) (Fig. 1H–1J). Of note, there was no significant difference in the ability of insulin to suppress endogenous glucose production (EGP) (Fig. 1K). These findings suggest that the improved insulin sensitivity is due to greater glucose uptake into tissues and is not due to decreased glucose production. The improved glucose uptake in muscle rather than fat is highly suggestive of tissue cross-talk. Importantly, we observed a three-fold increase in the ability of insulin to suppress non-esterified fatty acid (NEFA) levels in PPARγA/A mice (Fig. 1L).
We also examined biochemical indicators of insulin sensitivity and insulin signaling. PPARγA/A mice exhibited a modest but significant increase in insulin-stimulated AKT phosphorylation within skeletal muscle but not liver, inguinal WAT (iWAT), or epididymal WAT (eWAT) (Fig. 1M–1N). These results strongly support the notion that phosphorylation of PPARγ at S273 is sufficient to promote obesity-induced insulin resistance.
PPARγA/A and WT mice respond similarly to PPARγ agonist treatment
The TZD class of insulin sensitizing drugs serve both as agonists and to prevent phosphorylation of PPARγ S273. However, these drugs also have adverse effects, such as weight gain, fluid retention, and bone loss (Chilcott et al., 2001). Whether these side effects are completely separable from insulin sensitization is a key unanswered question. Multiple small-molecule non-agonist ligands have successfully separated beneficial from adverse effects (Amato et al., 2012; Choi et al., 2014; Stechschulte et al., 2016). To test whether this phenomenon holds true in a genetic model, we assessed PPARγA/A mice for TZD-associated side effects. First, adipocytes in eWAT of PPARγA/A mice had similar cell surface area to cells from control mice (Fig. 2A). In addition, PPARγA/A mice fed HFD showed no decrease in hematocrit, as an indicator of fluid retention (Fig. 2B), compared to controls. Importantly, using microquantitative computed tomography (microCT) we also observed no change in tissue mineral density (TMD) or trabecular bone volume fraction among genotypes (Fig. 2C–2D). Cortical bone parameters, including thickness, mineralization and periosteal perimeter, were similarly unchanged (data not shown). Thus, while mice harboring the S273A knock-in allele recapitulate the PPARγ agonist-like improvements in insulin sensitivity, they avoid the adverse effects typically associated with TZDs. Treatment of HFD-fed PPARγA/A mice with the full agonist of PPARγ, rosiglitazone, revealed a further improvement in insulin sensitivity (Fig. 2E). These effects included the adverse effects, weight gain and increased adiposity (Fig. 2F–G). These results indicate that while PPARγA/A mice show an improvement in glucose homeostasis, these animals are still susceptible to certain beneficial effects of TZD treatment and to the full adverse effects of these drugs.
Figure 2. PPARγA/A and wildtype mice respond similarly to PPARγ agonist treatment.

A-D. PPARγA/A (A/A) mice fed HFD for 16 weeks, do not innately exhibit the adverse effects associated with PPARγ agonism. A. Average cell area of adipocytes from epididymal adipose tissue after HFD feeding (n = 3). B. Hematocrit (packed cell volume, PCV; n = 6 wildtype (+/+), 5 A/A). C-D. Microquantitative computed tomography (microCT) analysis of trabecular bone from femurs of 6-month old mice maintained on HFD (n = 6 +/+, 5 A/A). C. Representative image of microCT. D. Parameters from microCT analysis, including tissue mineral density (TMD, left) and trabecular bone volume fraction (BV/TV, right). E-G. Both +/+ and A/A mice respond to treatment with PPARγ agonist rosiglitazone. After 19 weeks of HFD feeding, mice were treated with either vehicle or rosiglitazone (rosi) for 10 days (8 mg/kg body weight; n = 7 per genotype). E. Insulin tolerance test (1.5 U insulin/kg body weight); right, area under the curve (AUC). F. Body weight gained over course of treatment. G. Total fat mass at end of treatment. Data are presented as mean ± SEM; *, P < 0.05; **, P < 0.01; and ***, P < 0.001 by one-way ANOVA with Newman-Keuls Multiple Comparison (E-F) and two-way ANOVA (G).
Expression of Gdf3 is associated with PPARγ S273 phosphorylation
As PPARγ is phosphorylated in obese states and is highly expressed in adipose tissue, we examined transcriptional differences between control and littermate PPARγA/A eWAT from mice on HFD. Differential gene expression analysis following RNA-sequencing in eWAT revealed one striking result in the mutant animals: a strong and significant (p < 10 −12) downregulation of Gdf3, a secreted protein and member of the TGF-β superfamily (Fig. 3A). Using qPCR, we confirmed Gdf3 was expressed at lower levels in both PPARγA/A iWAT and eWAT from HFD-fed mice when compared to littermate controls (Fig. 3B). Consistent with previously published data, eWAT Gdf3 levels increase in obesity (Wang et al., 2004). Gdf3 expression shows a 35-fold increase in the eWAT of WT mice maintained on HFD for 25 weeks compared to chow-fed controls. In contrast, the induction of Gdf3 by HFD was reduced 80 percent in the eWAT of PPARγA/A mice. No significant difference was observed between genotypes on a standard chow diet (Fig. 3C). We also saw a significant decrease in Gdf3 mRNA levels in the skeletal muscle (quadriceps) of HFD fed PPARγA/A mice (Fig. 3D). We next investigated Gdf3 regulation by non-genetic modulation of PPARγ S273 phosphorylation using small-molecules that can limit S273 phosphorylation of PPARγ. Mice were treated with rosiglitazone, a PPARγ agonist or with MEK inhibitors, GSK1120212 (Trametinib) or PD0325901 to reduce PPARγ phosphorylation. Gdf3 mRNA levels decreased significantly in eWAT of these mice in response to rosiglitazone, Trametinib, and PD0325901 by 60%, 68%, and 50% respectively (Fig. 3E).
Figure 3. Expression of Gdf3 is associated with PPARγ S273 phosphorylation.

A-B. PPARγA/A (A/A) and wildtype (+/+) mice fed HFD for 37 weeks. A. Volcano plot from RNA-seq analysis on epididymal adipose tissue (eWAT), with differentially expressed gene Gdf3 highlighted. B. qPCR validation of decreased Gdf3 mRNA levels in eWAT and inguinal adipose tissue (iWAT) of HFD-fed A/A mice. C. Gdf3 mRNA levels in eWAT from mice on chow or HFD for 25 weeks. D. Gdf3 mRNA levels in quadriceps from mice fed HFD for 17 weeks. E. Gdf3 mRNA levels in obese adipose tissue also decrease following treatment with known inhibitors of PPARγ S273 phosphorylation (rosiglitazone or either of two MEK inhibitors, PD0325901 or Trametinib; n = 4–6). F. Fractionated adipose tissue indicates Gdf3 is highly expressed in both the SVF and adipocyte fractions of eWAT from mice fed HFD for 10 weeks. G-H. Single Cell RNA-sequencing of SVF from HFD-fed +/+ mice shows detectable expression mainly in the macrophage/monocyte population. I-K. Generation of bone marrow chimeras reveals dominant role of hematopoietic cells in decreased Gdf3 expression of A/A mice. I. Scheme used for bone marrow transplantation study, including use of congenic C57BL/6 strains carrying functionally equivalent alleles of the pan leukocyte marker CD45. J. Quantification of donor CD45+ cells in recipient eWAT tissue after HFD treatment of chimeric mice (n = 7–8). K. Gdf3 mRNA levels in eWAT after HFD treatment of chimeric mice (n = 7–8). L-M. Thioglycollate-elicited peritoneal macrophages from chow fed A/A mice exhibit decreased Gdf3 (L) mRNA and (M) protein levels. Data are presented as mean ± SEM; *, P < 0.05; **, P < 0.01; and ***, P < 0.001 by Student’s t test (B-D, per tissue/conditition; J-L) and one-way ANOVA with Newman-Keuls Multiple Comparison test (E-F).
Gdf3 is most highly expressed in adipose tissue macrophages from HFD mice
Due to the heterogeneous composition of adipose tissue, we examined whether Gdf3 levels were found within a population of fractionated adipocytes or the stromal vascular fraction (SVF). Although HFD treatment increased Gdf3 expression in both adipocyte and SVF fractions, higher Gdf3 mRNA levels were observed in the SVF (Fig. 3F). Single-cell RNA-seq of mouse SVF from HFD fed mice (Jaitin et al., 2019) suggests that Gdf3 is localized to macrophage/ monocyte cells within the SVF (Fig. 3G–H). To assess the contribution of macrophage-specific PPARγ S273 phosphorylation to obesogenic Gdf3 expression, we generated bone marrow chimeras and asked whether obese WT mice with a PPARγA/A immune system will have altered Gdf3 expression (Fig. 3I). We found no differences in numbers of CD45+ cells infiltrating recipient eWAT, irrespective of the donor genotype (Fig 3J). Strikingly, mice with a hematopoietic compartment reconstituted from PPARγA/A donors exhibited lower Gdf3 expression in eWAT regardless of recipient genotype (Fig. 3K). Thus, transplantation with PPARγA/A bone marrow recapitulated the decreased Gdf3 levels observed with whole-body PPARγA/A animals. Moreover, peritoneal macrophages from PPARγA/A mice revealed a 65% reduction in the levels of Gdf3 mRNA and an 80% reduction in protein levels (Fig. 3L–3M). Together, these data provide strong evidence for the regulation of Gdf3 by PPARγ S273 phosphorylation.
To further determine whether the differential levels of Gdf3 levels in adipose tissue were due to decreased numbers of Gdf3 expressing cells or to specific modulation of gene expression, we performed detailed immunophenotyping on eWAT from WT and PPARγA/A mice maintained on HFD for 16 weeks. None of the macrophage or T cell populations examined showed significant differences when either the cell number or the percentage of gated cells was examined between genotypes. Macrophage populations were gated according to the strategy outlined in Suppl. Fig. 5A. No differences were observed in total macrophage number or percent of gated live, hematopoietic cells (CD45+) that were not eosinophils (Siglec F−) (Suppl. Fig. 5B). Nor were differences in macrophage percent of cells expressing an M1 marker (CD11c+) or an M2 marker (CD301+) (Suppl. Fig. 5C). PPARγ is highly expressed in T regulatory cells (Treg), a cell type which can control tissue inflammation including macrophage recruitment (Cipolletta et al., 2015; Cipolletta et al., 2012). Treg populations were gated according to the strategy outlined in Suppl. Fig. 5D. No differences were observed in total Treg number or percent of gated live, hematopoietic cells (CD45+) that expressed the T cell receptor, CD4 co-receptor, and transcription factor Foxp3 (TCRb+ CD4+ Foxp3+) (Suppl. Fig. 5E). Similarly, tissue-resident Tregs (KLRG1+ ST2+), had no significant differences (Suppl. Fig. 5F). Coupled with the lack of cell type specific gene regulation, these data support the conclusion that similar levels of hematopoietic cells are present in PPARγA/A adipose tissue. These findings strongly suggest the differences in Gdf3 expression levels in PPARγA/A adipose tissue reflect specific transcriptional control by PPARγ S273 phosphorylation.
GDF3 limits BMP signaling
Members of the TGF-β superfamily, including BMPs, GDFs, and TGF-β proteins can affect insulin sensitivity, cellular differentiation, and obesity (Chattopadhyay et al., 2017; Chen et al., 2003; Pauk et al., 2019; Schreiber et al., 2017). These proteins typically work either through BMP-type receptors or TGF-β−type receptors. Relatively little is known of mammalian Gdf3 function on glucose homeostasis in vivo. Two seemingly incompatible models have been proposed to explain how extracellular Gdf3 signaling is propagated. One model suggests that Gdf3 can inhibit BMP-receptor signaling, possibly by competing with other ligands for receptor binding (Levine and Brivanlou, 2006; Levine et al., 2009). In the other model, Gdf3 activates TGF-β type receptors (ALK7/Cripto), especially at super-physiological concentrations of 300–500 ng/ml (Andersson et al., 2008; Bu et al., 2018; Chen et al., 2006). We examined whether Gdf3 can affect either signaling system using a WT full-length Gdf3 cDNA expressed in human HEK 293T cells. As reported previously Activin, a TGF-β receptor ligand, activates Smad2/3 phosphorylation. In contrast, Gdf3 had little impact on TGF-β signaling. Activin neither promotes nor inhibits BMP-receptor signaling as measured by phosphorylation of SMAD1/5/8. However, cells expressing Gdf3 demonstrate a strong reduction of SMAD1/5/8 phosphorylation (Fig. 4A).
Figure 4. GDF3 limits BMP signaling, affects glucose uptake in vitro and is sufficient to induce insulin resistance in vivo.

A. Immunoblot analysis of HEK 293T cells transfected with Gdf3 or Myc-Activin constructs. Cells were deprived of serum for 16 h prior to whole-cell extract. B. Luciferase assay using a BMP-responsive element (BRE) driving luciferase reporters in serum-starved HEK 293T cells. C. BRE luciferase assay in C2C12 myoblasts that have been deprived of serum. Overnight treatment of 100 ng/mL rBMP4 demonstrates reporter activation. D-E. C2C12 myotubes transduced with AAV-GFP or AAV-Gdf3. D. [3H] 2-deoxy-D-glucose (2-DG) uptake assays, n = 6 wells per group. E. Immunoblot analyses. F-L. As a gain-of function model, 13 week old male mice were administered AAV-GFP or AAV-Gdf3, n = 10 mice per group. F. Immunoblots from eWAT and quad from two mice from each group, 9 weeks post injections. G. Body weights of mice; week 0 represents the values on the day of AAV injections. H. Body composition at 6 weeks post injections. I. Glucose tolerance test (2 g glucose/kg body weight) 4 weeks post injections. J. Insulin tolerance test (0.75 U insulin/kg body weight) 3 weeks post injections. Right, area under the curve (AUC) for the respective test (I-J). K-L. Relative Id2 mRNA levels from eWAT (K) and quadriceps (L). M. Model illustrating novel role for PPARγ S273 phosphorylation and Gdf3 in impaired insulin action with obesity. Data are presented as relative activity after normalization to Renilla luciferase (B-C) and as mean ± SEM (B-D, G-L); ns, not significant; *, P < 0.05; **, P < 0.01; and ***, P < 0.001 by Student’s t test (B-C, G-L) and two-way ANOVA with Sidak’s Multiple Comparison test (D).
To understand the integrated effects of Gdf3 over time, we performed luciferase reporter assays to quantify Gdf3 transcriptional consequences. In these reporter assays, BMP signaling promotes SMAD 1/5/8 binding to the BMP responsive element (BRE) of the Id1 promoter. We observed an 80% reduction of luciferase activity with Gdf3 overexpression compared to control cells expressing an empty vector (Fig. 4B). We further confirmed these results in a second cell type, C2C12 myoblasts. As in HEK 293T cells, Gdf3 decreases BRE-Luc by 50% compared to control cells. As a positive control, recombinant BMP4 activates BMP receptor signaling and stimulates Smad1/5/8 activity (Fig. 4C). These data suggest that Gdf3 is a BMP inhibitor in a class similar to Noggin or Gremlin (Daluiski et al., 2001; Lim et al., 2000).
GDF3 affects glucose uptake in vitro
Based on the increased skeletal muscle glucose uptake in HFD fed PPARγA/A mice, and the luciferase reporter assay in C2C12 myoblasts, we wanted to determine if regulating GDF3 levels in muscle cells could affect insulin-dependent glucose uptake. To test this, we transduced differentiated C2C12 myotubes with either an adeno-associated virus (AAV) expressing GFP (AAV-GFP), or an AAV expressing Gdf3 (AAV-Gdf3). GDF3 overexpression in these cells led to decreased glucose uptake in the presence of insulin, compared to GFP expressing cells. No differences between groups were observed under baseline (no insulin), (Fig. 4D). Immunoblot analyses of these cells under similar conditions revealed a decrease in insulin-stimulated AKT phosphorylation in GDF3 overexpressing cells (Fig. 4E). Together these results suggest that GDF3 overexpression is sufficient to inhibit glucose uptake and reduce insulin signaling in muscle cells in vitro.
GDF3 is sufficient to induce insulin resistance in vivo
To investigate the effect of GDF3 in vivo, we administered AAV-GFP or Gdf3 into the visceral fat pads (eWAT) and skeletal muscles (quadriceps and gastrocnemius) of lean WT mice resulting in a detectable increase in protein levels of Gdf3 (Fig. 4F). Forced GDF3 expression did not affect body weight, body composition, energy expenditure, or food intake of mice fed a chow diet (Fig. 4G, 4H and data not shown). Importantly, mice overexpressing GDF3 had impairments in both glucose tolerance and insulin tolerance tests (Fig. 4I and 4J). These data indicate that increased levels of GDF3 in these tissues are sufficient to negatively impact glucose homeostasis, independently of changes in body weight. The inhibitors of differentiation (Id) genes, including Id2 are canonical targets of BMPR signaling (Izumi et al., 2006). We examined the effect of AAV Gdf3 expression on Id2 mRNA levels in eWAT and quadriceps. In both tissues, we observed significant downregulation (Fig. 4K and 4L), consistent with inhibition of BMPR signaling in vivo. These effects of GDF3 to promote impaired glucose homeostasis in healthy, lean mice suggest that the elevated GDF3 levels observed in obesity may contribute to insulin resistance.
Discussion
The link between PPARγ biology and insulin sensitivity is both robust and complex. Patients treated with TZD PPARγ agonists experience durable reduced glycemia and insulin sensitivity. These effects were long thought to depend on PPARγ-driven adipogenesis—the generation of new, healthy adipocytes from precursor cells. The properties of PPARγ agonists to promote adipocyte differentiation cause weight gain, but also decrease bone formation leading to increased risk of fractures. The demonstration that blocking PPARγ S273 phosphorylation can improve insulin sensitivity independently of receptor agonism or effects on bone, suggests new therapeutic approaches to insulin sensitizers.
Increased PPARγ S273 phosphorylation induced by ERK kinase in obesity contributes to insulin resistance. Our study shows that preventing S273 phosphorylation genetically was sufficient to maintain insulin sensitivity in obesity, as manifested by improved insulin tolerance and increased whole body glucose utilization (Fig. 1). Consistent with this interpretation, in lean wild type chow-fed mice in which the receptor was not phosphorylated, we did not observe differences in glucose homeostasis from littermate PPARγA/A mice. (Suppl. Fig. 2). This suggests that the observed phenotypic changes were due to the contribution of obesity, rather than developmental effects. Moreover, as PPARγ S273 phosphorylation is independent of receptor agonism, we did not observe TZD-like side effects in PPARγA/A mice (Fig. 2). Interestingly, our insulin sensitive phenotype in PPARγA/A mice was not accompanied by increased glucose tolerance or changes in insulin secretion. The hyperinsulinemic-euglycemic clamp experiment also showed increased muscle glucose uptake in PPARγA/A mice with no significant changes in adipose glucose uptake or insulin-dependent suppression of endogenous glucose production. Together these results were unexpected but seem to indicate that the effects of suppression of PPARγ S273 phosphorylation might be affect only a subset of PPARγ-expressing tissues.
Differentiated primary adipocytes from WT and PPARγA/A mice did not show differences in the expression of a previously established gene set regulated by PPARγ S273 phosphorylation. This lack of differential gene expression could be related to the absence of ERK signaling or inflammation in our experimental conditions, environments that promote PPARγ S273 phosphorylation. Alternatively this could be due to the difference between a chronic genetic mutation versus acute treatments of PPARγ agonists or retroviral PPARγA/A expression ((Choi et al., 2010) and Suppl. Fig. 3).
We identified Gdf3 as a transcriptional target of PPARγ S273 phosphorylation in obese adipose tissue as well as skeletal muscle. Gdf3 was expressed in adipose tissue in both the SVF and adipocyte fractions, with highest levels observed in macrophages (Fig. 3). We also show that bone marrow derived macrophages transplanted from PPARγA/A mice can lead to lower Gdf3 expression in the adipose tissue of recipient mice and WT macrophages could rescue Gdf3 levels in PPARγA/A recipients (Fig. 3). Previous studies of macrophage-specific PPARγ deficiency identified strongly reduced Gdf3 mRNA levels in the absence of PPARγ, along with the binding of PPARγ and RXR to potential enhancer regions of the Gdf3 locus (Varga et al., 2016). While macrophage PPARγ-deficient mice expressed low Gdf3 levels which would predict insulin sensitivity, they nonetheless exhibited insulin resistance due to increased secretion of multiple pro-inflammatory cytokines (Chawla et al., 2001; Hevener et al., 2007; Morán-Salvador et al., 2011; Odegaard et al., 2007; Varga et al., 2016). In contrast, PPARγA/A mice did not have significant differences in macrophage number, relative polarization, or cytokine expression levels (Supp. Fig. 5).
Relatively little is known of mammalian Gdf3 function on glucose homeostasis in vivo. Gdf3 is highly expressed in white adipose tissue with levels increasing with age and obesity (Bu et al., 2018; Camell et al., 2017; Wang et al., 2004). Our in vitro studies in C2C12 myotubes with AAV mediated Gdf3 expression showed that Gdf3 was sufficient to reduce insulin signaling and insulin mediated glucose uptake in muscle cells (Fig 4D and E). Although cells in culture cannot be directly extrapolated to in vivo functions, we also saw from our in vivo AAV mediated Gdf3 expression in the eWAT and skeletal muscle of mice, that Gdf3 overexpression was sufficient to cause insulin resistance and glucose intolerance in chow fed lean mice (Fig 4F, I and J). The mechanisms of these effects are still unclear but our data support a model in which Gdf3 blocks beneficial BMP receptor signaling, decreasing phosphorylation of SMAD 1/5/8, and inhibiting Id2, a SMAD target gene (Fig. 4).
Our work is consistent with studies demonstrating improvements in glucose homeostasis by increasing levels of BMP4 or BMP signaling. Conversely, BMP4 KO mice exhibit impaired glucose tolerance (Hoffmann et al., 2017; Qian et al., 2013). Heterozygous deletion of the type 1 BMP receptor, Bmpr1a causes impaired glucose tolerance (Scott et al., 2009), while adipocyte-specific receptor deletion does not (Schulz et al., 2016). Similar salutary effects of glucose homeostasis have been observed in mice treated with BMP6, BMP7, and BMP9 (Chattopadhyay et al., 2017; Chen et al., 2003; Pauk et al., 2019). BMPs can drive cellular differentiation including potentiation of brown and beige fat activation (Hoffmann et al., 2017; Qian et al., 2013; Schulz et al., 2013). In this context, tight control of BMP signaling is maintained by inhibitory proteins including Gdf3, Noggin and Gremlin (Hsu et al., 1998; Levine and Brivanlou, 2006).
An emerging literature is developing on the contribution of macrophages to catecholamine production and degradation. Macrophages expressing Gdf3 have been implicated in controlling catecholamine degradation and rates of lipolysis (Camell et al., 2017). Mice with global deletion of Gdf3 from birth maintain lean body masses when challenged with HFD (Andersson et al., 2008; Shen et al., 2009). Conversely, Gdf3 has been reported to induce severe and persistent obesity in an adenovirus overexpression model in response to HFD feeding (Wang et al., 2004). We observed no differences in energy balance compared to control mice in our models of decreased Gdf3 levels (PPARγA/A mice) when challenged with HFD or with exogenous Gdf3 expression using AAV under chow fed conditions (Fig. 4). These differences may be due to the role of Gdf3 in embryonic development (Chen et al., 2006; Levine and Brivanlou, 2006) versus the late timing of Gdf3 expression changes driven by differential obesity-mediated phosphorylation of PPARγ S273 or also on the late timing and tissue specificity of AAV-mediated Gdf3 expression.
Future studies will determine whether Gdf3 inhibits BMP-receptor signaling by binding to the BMP receptor or through inhibitory binding to other extracellular BMP receptor ligands and if these interactions are sufficient to cause the insulin resistance phenotype of Gdf3 overexpression. We find that Gdf3 is a factor that mediates the adverse consequences of obesity-mediated PPARγ S273 phosphorylation. Further study into the mechanisms of Gdf3 action will be beneficial to understand whether this is an appropriate future therapeutic target.
Limitations of Study
While our study demonstrates a causal role for PPARγ S273 phosphorylation in insulin resistance, the use of a whole-body knock-in model does not allow us identification of primary tissues driving this effect. In addition, although Gdf3 has previously been identified as a PPARγ target gene, our study does not show a direct mechanism for how PPARγ S273 phosphorylation alters Gdf3 expression, nor why the regulation of this gene is so selective. We demonstrate that Gdf3 levels correlate with insulin resistance, yet we do not have an elucidated mechanism to understand how Gdf3 promotes the development of insulin resistance. These efforts are needed as considerable controversy exists addressing many of the fundamental questions of Gdf3 biology including dimerization partners, receptor identity, and signaling cascade. Our data indicate macrophages are likely to be the primary source of the elevated Gdf3 levels induced with obesity, however further studies are required to confirm this finding.
STAR Methods
RESOURCE AVAILABILITY
Lead Contact
Further information and requests for resources and reagents should be directed to and will be fulfilled by the Lead Contact, Alexander S Banks (asbanks@bidmc.harvard.edu).
Materials Availability
All unique/stable reagents generated in this study are available from the Lead Contact with a completed Materials Transfer Agreement.
Data and Code Availability
RNA-seq data from eWAT of WT and A/A mice have been deposited in the Gene Expression Omnibus (GEO) repository under the accession number GSE151030.
EXPERIMENTAL MODEL AND SUBJECT DETAILS
Mouse model
Generation of PPARγS273A mice
We obtained a C57BL/6 bacterial artificial chromosome (BAC) containing the Ppar locus (Invitrogen/RPCI). An 8.9 kb fragment preceding and including exon 5 was amplified by PCR (Phusion DNA Polymerase, NEB) and cloned into a plasmid encoding both a floxed neomycin resistance cassette and a diphtheria toxin negative selection marker. Site-directed mutagenesis was used to alter the codon for serine 273 to alanine (TCA to GCA). Lastly, a 1.6 kb 3′ homology arm was similarly amplified and cloned into the plasmid. C57BL/6 ES cells were electroporated with the linearized targeting construct. Using positive and negative selection, 8 ES cell clones were isolated and two were injected into Balb/c blastocysts. The resulting progeny gave rise to highly chimeric offspring. These chimeras were mated to C57BL/6J mice to obtain germline transmission of the mutant allele. To remove the floxed neomycin cassette, these germline offspring were crossed to mice expressing Cre in the female germline (Zp3-Cre). The progeny from these crosses were found to have deleted the neomycin cassette successfully. These heterozygous mice (PPARγS273A/+) were mated to generate homozygous knock-in mice PPARγS273A/S273A or PPARγA/A. Mice were backcrossed onto C57BL/6J for 6 generations, after which mice heterozygous for the PPARγS273A allele (PPARγS273A/+) were bred to generate experimental cohorts. The PPARγS273A allele was detected by PCR genotyping with primers 5′-CAGGAGGCTGAGCAGGTGTGTT-3′, 5′-TCCAGACTGCCTTGGGAAAA-3′, and 5′-AGCACACATGTACCCAACAT-3′ (34 cycles, 96°C, 30s; 65°C, 45s; 72°C, 45s), where the WT and knock-in alleles produced PCR products of 319 bp and 217 bp, respectively. To minimize phenotypic variability from a mixed 6J/6N background, PPARγS273A/+ mice were genotyped for single nucleotide polymorphisms (SNPs) that distinguish between C57BL6/J and C57BL6/N alleles (Fontaine and Davis, 2016); mice homozygous for at least 9 SNPs specific to the C57BL/6J substrain on distinct chromosomes, including the 6/J null allele encoding nicotinamide nucleotide transhydrogenase (Nnt) (Nicholson et al., 2010), were used to establish cohorts for subsequent experiments.
Cell lines
HEK 293T cells (human female in origin) were cultured every 3 to 4 days using 0.05 % Trypsin EDTA and maintained in DMEM (Gibco, 11965118) supplemented with 10% heat inactivated FBS (FBS) and 1% Penicillin/Streptomycin. C2C12 myoblasts (ECACC, 91031101, C3H female mouse in origin) were cultured every 3 days using 0.25% Trypsin-EDTA and maintained in DMEM (Gibco, 11965118) supplemented with 20% FBS and 1% Penicillin/Streptomycin. All cell lines were maintained at 37°C at 5% CO2. Confluent C2C12 myoblast cells were induced to differentiate with serum withdrawal to 2% horse serum in collagen coated 6 well plates for 5 days. Differentiated C2C12 myotubes were returned to complete medium with 20% FBS for two days prior to subsequent experiments. These cell lines were not authenticated.
Primary cell culture
The stromal vascular fraction (SVF) containing preadipocytes and mononuclear cells were extracted from adipose tissue of WT or A/A mice (male) and cultured at 37°C with 5% CO2. Cells were maintained in DMEM (Gibco, 11965118) with 10% FBS and 1% Penicillin/Streptomycin until confluency. Two days post confluency, adipocyte differentiation was induced by treating cells (adipose tissue SVF) with 5 μM dexamethasone, 250 μM isobutylmethylxanthine, 1 μM rosiglitazone, and 900 nM insulin in DMEM with 10% FBS and 1% Penicillin/Streptomycin for 48 h. Cells were maintained in culture medium containing FBS, Penicillin/Streptomycin, insulin, and rosiglitazone for another 2 days. Thereafter, cells were cultured in medium containing FBS and Penicillin/Streptomycin only.
METHOD DETAILS
Animal experiments
All animal experiments were performed with approval from the Institutional Animal Care and Use Committees of The Harvard Center for Comparative Medicine, Brigham and Women’s Hospital, and Beth Israel Deaconess Medical Center. Mice were maintained at 12 h/12 h light/dark cycles, 22 ± 2°C room temperature and 30%–70% humidity with ad libitum access to food and water, in individually ventilated cages. Cages and bedding were changed once every two weeks and mice were monitored regularly for their health status by animal technicians with the support of veterinary care and remained free of any adventitious infections for the entire duration of this study. Mice were fed a standard chow diet (13% kcal fat, LabDiet, no. 5053) or a HFD (60% kcal fat, Research Diets, no. D12492i) for the indicated durations. All experiments were performed in adult male mice (8 to 43 weeks of age). For HFD experiments, WT and AA mice were put on HFD at 6 weeks of age. Body composition of conscious mice were assessed with an EchoMRI 3-in-1 (Echo Medical Systems). At the end of experiments, mice were euthanized using CO2, blood samples were collected via cardiac puncture in EDTA treated tubes on ice unless otherwise specified, and tissues were harvested and snap-frozen in liquid nitrogen and stored at −80°C until processing. Alternatively, samples of adipose tissue were fixed in formaldehyde, embedded in paraffin, sectioned and stained with H&E for determination of adipocyte area. Briefly, H&E stained slides were visualized and non-overlapping fields were captured for each sample using a Zeiss optical microscope and the AxioCam camera. Adipocyte area were calculated using ImageJ software (Schneider et al., 2012) using freely available macros described in (Parlee et al., 2014). Adipocytes touching the edge of each image were excluded as well as cells < 350 μm2 as these cells may be a mixture of adipocytes and stromal vascular cells. For plasma collection, the blood samples in EDTA treated tubes were centrifuged at 2000g at 4°C for 15 minutes, and the resulting supernatant was collected as plasma and stored at −80°C until processing. For measures of hematocrit, a small volume of whole blood was centrifuged in a microhematocrit capillary tube, and the height of the column of packed cells was expressed as a percentage of the height of the total blood column samples with visible hemolysis were excluded).
In vivo AAV experiments
12 week old male chow fed C57BL6/J mice were purchased from Jackson Labs and allowed to acclimate to our animal facility for 1 week. Each AAV was injected bilaterally into the quadriceps and gastrocnemius muscles at a dose of 1.5 × 10⁸ vg in 30 μL of PBS per injection and into the epididymal fat depots at 2.5 × 10⁸ vg in 50 μL of PBS per injection. These viral injections were performed under isoflurane anesthesia and mice were given Buprenorphine SR Lab as the perioperative and postoperative analgesic prior to surgery at a dose of 0.5 mg/kg. These mice were maintained on chow and euthanized 9 weeks post injections.
Glucose and insulin tolerance tests
Tests were performed on mice fasted for 16 and 4 hours, respectively with ad libitum access to water. Following an initial blood glucose measurement post-fast, tolerance to an intraperitoneal (IP) injection of glucose (1–3 g/kg) or insulin (0.75–2 U/kg) was assessed by change in blood glucose over a period of 120 minutes. Glycemia was measured by tail vein bleeds at the indicated times using a Contour Next EZ glucometer (Bayer). Plasma insulin levels were measured using the Ultra-Sensitive Mouse Insulin ELISA Kit (Crystal Chem, Inc.).
For PPARγ ligand treatment prior to ITT, diet-induced obese mice were IP injected daily for 10 days with rosiglitazone (Cayman Chemical; 8 mg/kg) before insulin tolerance testing. Rosiglitazone was dissolved in dimethylsulfoxide (DMSO) and diluted into saline with 2% Tween-80 for injection. Administration of MEK inhibitors Trametinib and PD0325901 (Selleckchem) were as previously described (Banks et al., 2015). Mainly, Trametinib (3 mg/kg) or PD0325901 (10 mg/kg) were administered by daily oral gavage for 5 days. Compounds were dissolved in DMSO and diluted into an aqueous 250 μl dose containing 0.5% hypromellose and 2% Tween-80.
Hyperinsulinemic-euglycemic clamp
WT and A/A mice fed HFD for 16 weeks were subjected to a hyperinsulinemic-euglycemic clamp study as previously described with minor modifications (Jurczak et al., 2012). Briefly, mice were allowed to recover for one week after an indwelling catheter was surgically implanted in the right jugular. Following an overnight fast of approximately 14 h mice were infused with a fixed amount of insulin [4 mU/(kg-min)] and a variable amount of 20% dextrose to maintain euglycemia (~120 mg/dL). [3-3H]glucose (PerkinElmer) was included in the infusate at a rate of 0.05 μCi/min for 2 h to allow for the calculation of whole-body rates of glucose metabolism. A 10-μCi bolus injection of 2-deoxy-D-[1-14C]glucose (10 μCi/mouse; PerkinElmer) was given at 90 min to determine tissue-specific glucose uptake. Blood was collected via tail massage for plasma glucose, insulin, and tracer levels at set time points during the 140-min infusion. For biochemical analysis of insulin signaling, obese mice of both genotypes were fasted for 4 hours prior to IP injection of insulin (10 U/kg). Ten minutes after insulin injection, white adipose tissue, liver, and gastrocnemius were collected for subsequent protein analysis.
Indirect calorimetry
For measurements of metabolic rate and food intake, we placed approximately 35 week old male mice fed HFD for 29 weeks within the CLAMS (Columbus Instruments) indirect calorimeter. Data from two independent cohorts was combined. One week prior to monitoring, mice were surgically implanted with wireless body temperature probes (Starr Scientific). Mice were acclimated for 13 h followed by 24 h measurement of VO2, VCO2, RER, locomotor and ambulatory activity, food intake at 23 ± 0.1°C while on HFD. Energy expenditure was calculated with the Weir equation (Weir, 1949). Calories consumed were calculated by multiplying hourly food intake by the 5.21 kcal/g caloric value of the 60% HFD. Energy balance was calculated by subtracting hourly food intake from hourly energy expenditure. Data from two separate experimental runs were combined. Results for locomotor activity (n=2) and body temperature (n=3) were removed due to equipment malfunction; other data from these animals were included. Analysis with ANOVA and ANCOVA were performed using CalR with the remove outliers feature activated (Mina et al., 2018).
Microquantitative computed tomography
For microCT analysis, a Scanco Medical μCT 35 system with an isotropic voxel size of 7 μm was used to image the femur. Scans were conducted in 70% ethanol using an X-ray tube potential of 55 kVp, an X-ray intensity of 0.145 mA and an integration time of 600 ms. Analysis was performed according to published guidelines (Bouxsein et al., 2010). From the scans of the femur, a region beginning 0.28 mm proximal to the growth plate and extending 1mm proximally was selected for trabecular bone analysis. A second region 0.6 mm in length and centered at the midpoint of the femur was used to calculate diaphyseal parameters. A semi-automated contouring approach was used to distinguish cortical and trabecular bone. The region of interest was thresholded using a global threshold that set the bone/marrow cut-off at 452.65 mg HA/cm3 for trabecular bone and 579.86 mg HA/cm3 for cortical bone. 3-D microstructural properties of bone, including TMD and bone volume fraction (BV/TV), were calculated using software supplied by the manufacturer.
RNA isolation and gene expression analysis by qPCR, RNA-seq, or single cell RNA-seq
RNA Isolation
For experiments utilizing RNA-seq or qPCR, total RNA was isolated from cells or tissues using TRIzol reagent (Thermo Fisher) followed by a Direct-zol RNA MiniPrep kit (Zymo Research) according to the manufacturer’s instructions. The RNA was reverse-transcribed using Multiscribe Reverse Transcriptase and a high-capacity cDNA reverse transcription kit (Applied Biosystems).
Quantitative real-time PCR (qPCR) was performed using synthesized cDNA with SYBR Select Master Mix (Applied Biosystems) on a Light Cycler 480 II (Roche) or the QuantStudio 5 Real-Time PCR System (Applied Biosystems). Relative mRNA expression was determined by the ΔΔ-Ct method normalized to TATA-binding protein (TBP) levels. The list of primers used in this study is included in Supplementary Table S1.
RNA-sequencing (RNA-seq)
400ng of total RNA was used as input for RNA-seq Library construction, which consisted of rRNA removal via the NEBNext rRNA depletion kit and conversion to cDNA using the NEBNext Ultra II Non-Directional RNA Second Strand Synthesis Module, both per manufacturer’s instructions. cDNA was diluted 1:15 and subsequently tagmented and amplified for 12 cycles using the Nextera XT DNA Library Preparation Kit (Illumina). Individual libraries were QC’d by Qubit and Agilent Bioanalyzer, pooled, and sequenced at a final loading concentration of 1.8 pM on a NextSeq500 (36bp x 36bp paired-end reads). Sequencing reads were demultiplexed using bcl2fastq (v2.20.0) and aligned to the mm10 mouse genome by with HISAT2 (v. 2.0.5 (Kim et al., 2015). PCR duplicates and low-quality reads were filtered by Picard (https://broadinstitute.github.io/picard). Filtered reads were assigned to the annotated transcriptome and quantified using featureCounts (Liao et al., 2014). Normalization and differential expression analysis were performed using EdgeR (v 2.9.2) (Robinson et al., 2010).
Single cell RNA-seq
Identification of Gdf3-expressing cells in HFD-fed mice was performed using single cell RNA-sequencing from SVF fraction of eWAT of mice by (Jaitin et al., 2019). These data were clustered de novo using the SCTransform seurat pipeline (Hafemeister and Satija, 2019; Stuart et al., 2019) using the following parameters: 2000 variable genes, 25 UMAP and SNN dimensions, and clustering resolution of 0.4. Excluded from analysis were a list of mitochondrial and ribosomal genes identified by (Jaitin et al., 2019).
Preparation of cell or tissue lysates and immunoblotting
Whole-cell extracts were prepared in RIPA lysis buffer containing 50 mM Tris pH 7.5, 150 mM NaCl, 1% NP-40, 0.5% sodium deoxycholate, 0.1% SDS, and 1× HALT protease and phosphatase inhibitor cocktail (Thermo Fisher). For tissue lysates, frozen tissue was pulverized in liquid nitrogen followed by homogenization in lysis buffer using stainless steel ball bearings and a TissueLyser (Qiagen). Protein concentration was determined by Pierce BCA protein assay (Thermo Fisher) and lysates separated by SDS-PAGE with Mini-PROTEAN TGX gels (Bio-Rad), transferred to PVDF membranes using the Trans-Blot Turbo transfer system (Bio-Rad), and blotted according to manufacturer’s recommendations for the indicated antibodies. Primary antibodies used in this study include: rabbit anti-phospho-Akt Ser473, rabbit anti-Akt, rabbit anti-β-Tubulin, rat anti-Gdf3, mouse anti-β-Actin, rabbit anti-phospho-Smad2 Ser465/467/Smad3 Ser423/425, rabbit anti-Smad2, rabbit anti-phospho-Smad1 Ser463/465/Smad5 Ser463/465/Smad9 Ser465/467, rabbit anti-Smad1, rabbit anti-Myc-Tag, rabbit anti-phospho-PPARγ Ser273, and mouse anti-PPARγ. Horseradish peroxidase-conjugated secondary antibodies were obtained from Cell Signaling Technologies. Chemiluminescence assays were performed using SuperSignal West Dura extended duration substrates (Thermo Fisher) and detected with a ChemiDoc XRS+ or ChemiDoc Touch Imaging System (Bio-Rad). Image analyses were performed using Image Lab software (Bio-Rad).
DNA constructs and AAVs
A non-tagged construct of mouse Gdf3 was generated using the commercial vector pCMV6-Gdf3-Myc-Flag (OriGene Technologies, MR222967), containing a Myc-Flag-tagged Gdf3, and PCR-based mutagenesis to introduce a STOP codon upstream of the C-terminal Myc-Flag tag. The BMP responsive element luciferase reporter, derived from the ID1 luciferase reporter (Korchynskyi and ten Dijke, 2002) was provided by C. Brown. A Myc-Flag-tagged mouse Activin expression plasmid was purchased from Origene Technologies (MR225191). AAV Gdf3 was generated by subcloning non-tagged Gdf3 into the AAV2/1 vector backbone of AAV-CAG-GFP, a gift from Karel Svoboda via Addgene plasmid 28014 (Mao et al., 2011). Viral packaging into the AAV-DJ serotype and titer determination were performed by the Boston Children’s Hospital Viral Core. Premade control AAV2/DJ-CAG-H2BGFP virus (AAV-GFP) was purchased from the same core facility.
Lipid accumulation assay
Lipid accumulation in adipocytes was detected by Oil Red O staining as described (Ramirez-Zacarias et al., 1992).
Glucose uptake assays
C2C12 myoblast cells were differentiated and transduced with either AAV-GFP or AAV-Gdf3 (1.2 × 10¹⁰ vg per well in a 48 well plate) and (1.2 × 10¹¹ vg per well in 6 well plates). Approximately 36 hours post transduction, the cells from the 6 well plates were incubated in serum-free DMEM for 3 h at 37°C, incubated with or without 200 nM insulin for 20 min washed twice in ice cold PBS and lysed with RIPA lysis buffer for western blot analysis as described above. The cells from the 48 well plate were used for glucose uptake assays using the protocol described in (Yore et al., 2014) with minor modifications. Briefly, cells were washed twice with serum-free DMEM and incubated in serum-free DMEM for 3 h at 37°C. Cells were then washed 3 times with Krebs-Ringer-HEPES (KRH) buffer (50 mM HEPES pH 7.4, 137 mM NaCl, 1.25 mM CaCl2, 4.7 mM KCl, 5.0 mM, 1.25 mM MgSO4). Cells were incubated in KRH for 30 min then incubated in KRH with or without 200 nM insulin for 20 min before the addition of a deoxy-D-glucose, 2-[1,2–3H (N)]/2-deoxy-D-glucose solution, yielding final assay concentrations of 1 μCi of [3H] 2-deoxy-D-glucose and 100 μM 2-deoxy-D-glucose per well. After 5 min the KRH buffer was removed immediately by aspiration. Cells were washed 3 times in ice-cold PBS to inhibit further glucose uptake and wash away unincorporated radiolabeled [3H] 2-deoxy-D-glucose. Cells were solubilized with 0.5% SDS. Half of the lysates from each well were used to assay [3H] disintegration levels by liquid scintillation counting and the other half was used for normalization to protein concentrations.
Luciferase reporter assays
C2C12 myoblasts were transfected without myogenic differentiation. HEK 293T or C2C12 cells were transfected with a firefly luciferase reporter construct and a fixed amount of DNA, as normalized with empty vector plasmid using Lipofectamine 2000 and 3000 transfection reagents (Invitrogen), respectively, according to the manufacturer’s recommendations. Luciferase activity was measured 24–48 h after transfection using the Dual-Luciferase Reporter Assay system (Promega), with quantification of luminescence on a FLUOstar OPTIMA plate reader (BMG Labtech). Co-transfection of CMV-driven Renilla luciferase vector was used to normalize for transfection efficiency. Where indicated, cells were rinsed with PBS and switched to DMEM lacking serum prior to luciferase measurement. As a positive control for BMP signaling, recombinant protein of mouse BMP4 (R&D Systems) was added to the medium 16 h before analysis.
Isolation of macrophages
Peritoneal macrophages were harvested from chow fed, 15 to 20 week old mice as previously described (Ray and Dittel, 2010). Briefly, WT or A/A mice were given an IP injection of 3% thioglycolate solution (3 mL per mouse). 4 days post injection, mice were euthanized and their peritoneal cavity was carefully injected with 5 ml of ice cold PBS (with 3% FBS) using a 27G needle without puncturing any organs. The peritoneum was gently massaged to dislodge any attached cells into the PBS solution which was then aspirated using a 25G needle attached to a 5mL syringe. These peritoneal cells were collected into ice cold 50mL polypropelene tubes, erythrocytes were lysed using ACK lysis buffer (Gibco), resuspended in ice cold PBS (with 3% FBS) and centrifuged for 8 min at 400g at 4°C. The pelleted cells were resuspended in DMEM containing 10% FBS and allowed to adhere for 2 h in 10cm cell culture dishes in a 37°C incubator qith 5% CO2. Nonadherent cells were washed away with PBS, and adherent cells were scraped and used as peritoneal macrophages for further experiments.
Isolation of cells from SVF
The stromal vascular fraction (SVF) containing preadipocytes and mononuclear cells was extracted from adipose tissue. For isolation of preadipocytes, inguinal adipose tissue was digested in a PBS buffer containing 10 mg/mL collagenase D (Roche), 2.4 U/mL dispase II, and 10 mM CaCl2 for 45 min shaking at 37°C. Digestion was neutralized with culture medium consisting of DMEM/F12 supplemented with 10% FBS and penicillin/streptomycin. Cell suspensions were filtered through 100 μm and 40 μm cell strainers, and the SVF cells resuspended in growth medium for expansion. For isolation of mononuclear cells and subsequent immunophenotyping, epididymal and inguinal adipose tissues were digested for 20–30 min at 37°C with collagenase type II (Sigma). Cell suspensions were filtered through a sieve, and the SVF fraction was collected after red blood cell lysis (ACK Lysing Buffer, Gibco) and filtration through a 40 μm cell strainer.
Immunophenotyping and flow cytometry
Adipose tissue SVF cells were resuspended in FACS buffer (phenol red-free DMEM supplemented with 10 mM HEPES and 2% FCS) and incubated for 30–45 min at 4°C with Fc block and the indicated fluorescence-labeled antibodies for surface molecule staining. For myeloid cell analysis, cells were stained with anti-CD45.2 (clone 104), -CD45.1 (A20), -CD11b (M1/70), -F4/80 (BM8), and -CD301 (LOM-14) antibodies from BioLegend; -CD11c (N418) antibody from eBioscience; and -SiglecF (E50–2440) antibody from BD Biosciences. For lymphoid cell analysis, cells were stained with anti-CD45.2, -CD45.1, -CD19 (6D5), -TCR-β (H57–597), and -CD8 (53–6.7) antibodies from BioLegend; -CD4 (RM4–5), -KLRG1 (2F1), and -IL33R/ST2 (RMST2–2) antibodies from eBioscience; and were fixed, permeabilized and intracellularly stained for Foxp3 (FJK-16s) according to the manufacturer’s instructions (eBioscience). Dead cells were excluded by staining with a fixable LIVE/DEAD dye (ThermoFisher). Cells were analyzed using an LSRII instrument (BD Bioscience) and FlowJo software.
Bone marrow transplantation
Bone marrow progenitor cells were isolated by flushing femurs and tibiae of 10 to 12 week old donor animals with PBS, and T-cells depleted from BM by magnetic beads. Recipient mice between 8 to 12 weeks of age were irradiated with 1000 rads prior to reconstitution with 3–5 × 10⁶ donor cells by retro-orbital injection. Irradiated mice were kept in sterile cages with standard chow diet and antibiotic-treated water for 2 weeks. After 4 weeks recovery, mice were bled to monitor reconstitution and started on HFD treatment for an additional 20 weeks. To distinguish chimerism, transplantation studies made use of congenic C57BL/6 strains carrying functionally equivalent alleles of the pan leukocyte marker CD45. For studies with PPARγ+/+ recipient mice, mice harboring the CD45.1 allele were purchased from Jackson (B6.SJL-PtprcaPepcb/BoyJ) and transplanted with bone marrow from PPARγ+/+ or PPARγA/A mice, which carry the WT allele for CD45 (CD45.2). For studies with PPARγA/A recipient mice, PPARγA/A mice were transplanted with bone marrow from PPARγ+/+ or PPARγA/A mice heterozygous for CD45.1.
QUANTIFICATION AND STATISTICAL ANALYSIS
Data were analyzed using Prism software (GraphPad Software, Inc) and are expressed as mean ± SEM. All data were assumed to have a normal distribution and two-tailed Student’s t tests, one-way ANOVA with Newman-Keuls Multiple Comparison test, or two-way ANOVA were used to compare means between groups as indicated in the figure legends; P < 0.05 was considered significant.
Supplementary Material
KEY RESOURCES TABLE.
| REAGENT or RESOURCE | SOURCE | IDENTIFIER |
|---|---|---|
| Antibodies | ||
| rabbit anti-phospho-Akt Ser473 | Cell Signaling Technology | 4060S |
| rabbit anti-Akt | Cell Signaling Technology | 9272S |
| rabbit anti-β-Tubulin | Cell Signaling Technology | 2146 |
| rat anti-Gdf3 | R&D Systems | MAB953 |
| mouse anti-β-Actin | Sigma Aldrich | A1978 |
| rabbit anti-phospho-Smad2 Ser465/467/ Smad3 Ser423/425 | Cell Signaling Technology | 8828S |
| rabbit anti-Smad2 | Cell Signaling Technology | 5339S |
| rabbit anti-phospho-Smad1 Ser463/465/ Smad5 Ser463/465/ Smad9 Ser465/467 | Cell Signaling Technology | 13820S |
| rabbit anti-Smad1 | Cell Signaling Technology | 6944S |
| rabbit anti-Myc-Tag | Cell Signaling Technology | 2278S |
| rabbit anti-phospho-PPARγ Ser273 | previously described (Choi et al., 2010) | N/A |
| mouse anti-PPARγ | Santa Cruz | sc-7273 |
| anti-rabbit IgG, Horseradish peroxidase-conjugated | Cell Signaling Technology | 7074S |
| anti-mouse IgG, Horseradish peroxidase-conjugated | Cell Signaling Technology | 7076S |
| anti-rat IgG, Horseradish peroxidase-conjugated | Cell Signaling Technology | 7077S |
| anti-CD45.2 (clone 104) | BioLegend | 109820 |
| anti-CD45.1 (A20) | BioLegend | 110706 |
| anti-CD11b (M1/70) | BioLegend | 141704 |
| anti-F4/80 (BM8) | BioLegend | 123114 |
| anti-CD301 (LOM-14) | BioLegend | 145709 |
| anti-CD11c (N418) | eBioscience | 61-0114-82 |
| anti-SiglecF (E50-2440) | BD Biosciences | 552126 |
| anti-CD19 (6D5) | BioLegend | 115508 |
| anti-TCR-β (H57-597) | BioLegend | 109222 |
| anti-CD8 (53-6.7) | BioLegend | 100730 |
| anti -CD4 (RM4-5) | eBioscience | 61-0042-82 |
| anti -KLRG1 (2F1) | eBioscience | 11-5893-82 |
| anti -IL33R/ST2 (RMST2-2) | eBioscience | 46-9335-82 |
| Bacterial and Virus Strains | ||
| AAV2/DJ-CAG-H2BGFP | Boston Children’s Hospital viral core | Not Applicable (N/A) |
| AAV2/DJ-CAG-Gdf3 | This manuscript | N/A |
| Chemicals, Peptides, and Recombinant Proteins | ||
| Rosiglitazone, Cayman Chemical | Fisher Scientific | NC9560589 |
| PD0325901 | Selleckchem | S1036 |
| Trametinib (GSK1120212) | Selleckchem | S2673 |
| Recombinant mouse BMP4 | R&D Systems | 5020-BP-010 |
| Critical Commercial Assays | ||
| Ultra-Sensitive Mouse Insulin ELISA Kit | Crystal Chem | 90080 |
| NEBNext rRNA Depletion Kit | New England Biolabs | E6310X |
| NEBNext Ultra II Non-Directional RNA Second Strand Synthesis Module | New England Biolabs | E6111L |
| Nextera XT DNA Library Preparation Kit | Illumina | FC-131 |
| Dual-Luciferase Reporter Assay System | Promega | E1960 |
| High Capacity cDNA Reverse Transcription Kit, Applied Biosystems | Thermo Fisher Scientific | 4368813 |
| Foxp3 / Transcription Factor Staining Buffer Set, eBioscience | Thermo Fisher Scientific | 00-5523-00 |
| Deposited Data | ||
| RNA-seq data | GEO repository | GSE151030 |
| Experimental Models: Cell Lines | ||
| Human: HEK 293T | Spiegelman lab, Dana Farber Cancer Institute | N/A |
| Mouse: C2C12 C3H muscle myoblast | Sigma Aldrich | 91031101 |
| Experimental Models: Organisms/Strains | ||
| Mouse: C57/Bl6J | The Jackson Laboratory | 000664 |
| Mouse: Bl6J PPARγS273A/+ | This manuscript | N/A |
| Mouse: B6.SJL-Ptprca Pepcb/BoyJ | The Jackson Laboratory | 002014 |
| Oligonucleotides | ||
| Primers for RT-qPCR analysis, see Table S1 | This manuscript | N/A |
| Recombinant DNA | ||
| pCMV6-Gdf3 | This manuscript | N/A |
| pCMV6-Gdf3-Myc-Flag | OriGene Technologies | MR222967 |
| pCMV6-Activin(Inhbb)-Myc-DDK | Origene Technologies | MR225191 |
| pAAV-CAG-GFP | Addgene | 28014 |
| Software and Algorithms | ||
| CalR | Mina et al., 2018 | https://calrapp.org/ RRID:SCR_015849 |
| ImageJ | Schneider et al., 2012 | https://imagej.nih.gov/ij/ |
| Prism 8 | GraphPad Software | https://www.graphpad.com/scientific-software/prism/ |
| FlowJo | FlowJo, LLC | https://www.flowjo.com/ |
| Other | ||
| CLAMS indirect calorimeter | Columbus Instruments | http://www.colinst.com/ |
Highlights.
Blocking PPARγS273 phosphorylation protects mice from insulin resistance in obesity
These mice do not show the side effects associated with TZD based PPARγ agonism
These mice have reduced expression of Gdf3 mainly in macrophages
Gdf3 is sufficient to cause impaired glucose homeostasis in vivo and in vitro
Context and Significance.
Previous studies have revealed a mechanism wherein blocking PPARγ phosphorylation at Serine 273 could improve insulin sensitivity without causing the side effects of PPARγ agonism. This paper tests this mechanism genetically by using mice that cannot be phosphorylated at PPARγ Ser273 (A/A). They find that A/A mice are protected from developing insulin resistance without the side effects of PPARγ agonism. They implicate the regulation of TGFβ family member Gdf3, by PPARγ, in the mechanism of action, and show that GDF3 is sufficient to cause insulin resistance in lean mice. This study highlights the diabetogenic potential of PPARγ Ser273 phosphorylation and GDF3 which could be potential targets for developing better type-2 diabetes therapeutics.
Acknowledgements
Animal assistance was provided by Yuchen He and June Corrigan. Financial support for this project was provided from the NIH to ASB, R01DK107717, P30DK34854, and U24DK076169 for the NIDDK Mouse Metabolic Phenotyping Centers under the MICROMouse Program. JAH received support from the NIH T32DK007529-28. DR was supported by the Swiss National Science Foundation’s Early Postdoc Mobility grant. EDR was supported by NIH R01 DK102173 and DK113669. TB was supported by the São Paulo Research Foundation (Postdoc financial support #2017/25881-0). RNA-seq was performed by the Boston Nutrition and Obesity Research Center’s Functional Genomics and Bioinformatics Core (BNORC, NIH 5P30DK046200).
Footnotes
Declaration of Interests
E.D.R. is a paid consultant of Novartis. B.B.K. consults for Alterna and serves on the Scientific Advisory Board of Janssen Pharmaceuticals. A.S.B. and B.M.S. hold a patent related to this work.
Publisher's Disclaimer: This is a PDF file of an unedited manuscript that has been accepted for publication. As a service to our customers we are providing this early version of the manuscript. The manuscript will undergo copyediting, typesetting, and review of the resulting proof before it is published in its final form. Please note that during the production process errors may be discovered which could affect the content, and all legal disclaimers that apply to the journal pertain.
References
- Altshuler D, Hirschhorn JN, Klannemark M, Lindgren CM, Vohl MC, Nemesh J, Lane CR, Schaffner SF, Bolk S, Brewer C, et al. (2000). The common PPARgamma Pro12Ala polymorphism is associated with decreased risk of type 2 diabetes. Nature genetics 26, 76–80. [DOI] [PubMed] [Google Scholar]
- Amato AA, Rajagopalan S, Lin JZ, Carvalho BM, Figueira AC, Lu J, Ayers SD, Mottin M, Silveira RL, Souza PC, et al. (2012). GQ-16, a novel peroxisome proliferator-activated receptor gamma (PPARgamma) ligand, promotes insulin sensitization without weight gain. J Biol Chem 287, 28169–28179. [DOI] [PMC free article] [PubMed] [Google Scholar]
- Andersson O, Korach-Andre M, Reissmann E, Ibanez CF, and Bertolino P (2008). Growth/differentiation factor 3 signals through ALK7 and regulates accumulation of adipose tissue and diet-induced obesity. Proc Natl Acad Sci U S A 105, 7252–7256. [DOI] [PMC free article] [PubMed] [Google Scholar]
- Banks AS, McAllister FE, Camporez JP, Zushin PJ, Jurczak MJ, Laznik-Bogoslavski D, Shulman GI, Gygi SP, and Spiegelman BM (2015). An ERK/Cdk5 axis controls the diabetogenic actions of PPARgamma. Nature 517, 391–395. [DOI] [PMC free article] [PubMed] [Google Scholar]
- Boden G (1997). Role of fatty acids in the pathogenesis of insulin resistance and NIDDM. Diabetes 46, 3–10. [PubMed] [Google Scholar]
- Bouhlel MA, Derudas B, Rigamonti E, Dièvart R, Brozek J, Haulon S, Zawadzki C, Jude B, Torpier G, and Marx N (2007). PPARγ activation primes human monocytes into alternative M2 macrophages with anti-inflammatory properties. Cell metabolism 6, 137–143. [DOI] [PubMed] [Google Scholar]
- Bouxsein ML, Boyd SK, Christiansen BA, Guldberg RE, Jepsen KJ, and Müller R (2010). Guidelines for assessment of bone microstructure in rodents using micro–computed tomography. Journal of bone and mineral research 25, 1468–1486. [DOI] [PubMed] [Google Scholar]
- Bu Y, Okunishi K, Yogosawa S, Mizuno K, Irudayam MJ, Brown CW, and Izumi T (2018). Insulin Regulates Lipolysis and Fat Mass by Upregulating Growth/Differentiation Factor 3 in Adipose Tissue Macrophages. Diabetes 67, 1761–1772. [DOI] [PubMed] [Google Scholar]
- Camell CD, Sander J, Spadaro O, Lee A, Nguyen KY, Wing A, Goldberg EL, Youm YH, Brown CW, Elsworth J, et al. (2017). Inflammasome-driven catecholamine catabolism in macrophages blunts lipolysis during ageing. Nature 550, 119–123. [DOI] [PMC free article] [PubMed] [Google Scholar]
- Chattopadhyay T, Singh RR, Gupta S, and Surolia A (2017). Bone morphogenetic protein-7 (BMP-7) augments insulin sensitivity in mice with type II diabetes mellitus by potentiating PI3K/AKT pathway. Biofactors 43, 195–209. [DOI] [PubMed] [Google Scholar]
- Chawla A, Barak Y, Nagy L, Liao D, Tontonoz P, and Evans RM (2001). PPAR-gamma dependent and independent effects on macrophage-gene expression in lipid metabolism and inflammation. Nature medicine 7, 48–52. [DOI] [PubMed] [Google Scholar]
- Chen C, Grzegorzewski KJ, Barash S, Zhao Q, Schneider H, Wang Q, Singh M, Pukac L, Bell AC, Duan R, et al. (2003). An integrated functional genomics screening program reveals a role for BMP-9 in glucose homeostasis. Nature biotechnology 21, 294–301. [DOI] [PubMed] [Google Scholar]
- Chen C, Ware SM, Sato A, Houston-Hawkins DE, Habas R, Matzuk MM, Shen MM, and Brown CW (2006). The Vg1-related protein Gdf3 acts in a Nodal signaling pathway in the pre-gastrulation mouse embryo. Development (Cambridge, England) 133, 319–329. [DOI] [PubMed] [Google Scholar]
- Chilcott J, Tappenden P, Jones ML, and Wight JP (2001). A systematic review of the clinical effectiveness of pioglitazone in the treatment of type 2 diabetes mellitus. Clinical therapeutics 23, 1792–1823. [DOI] [PubMed] [Google Scholar]
- Choi JH, Banks AS, Estall JL, Kajimura S, Bostrom P, Laznik D, Ruas JL, Chalmers MJ, Kamenecka TM, Bluher M, et al. (2010). Anti-diabetic drugs inhibit obesity-linked phosphorylation of PPARgamma by Cdk5. Nature 466, 451–456. [DOI] [PMC free article] [PubMed] [Google Scholar]
- Choi JH, Banks AS, Kamenecka TM, Busby SA, Chalmers MJ, Kumar N, Kuruvilla DS, Shin Y, He Y, Bruning JB, et al. (2011). Antidiabetic actions of a non-agonist PPARgamma ligand blocking Cdk5-mediated phosphorylation. Nature 477, 477–481. [DOI] [PMC free article] [PubMed] [Google Scholar]
- Choi SS, Kim ES, Koh M, Lee SJ, Lim D, Yang YR, Jang HJ, Seo KA, Min SH, Lee IH, et al. (2014). A novel non-agonist peroxisome proliferator-activated receptor gamma (PPARgamma) ligand UHC1 blocks PPARgamma phosphorylation by cyclin-dependent kinase 5 (CDK5) and improves insulin sensitivity. J Biol Chem 289, 26618–26629. [DOI] [PMC free article] [PubMed] [Google Scholar]
- Cipolletta D, Cohen P, Spiegelman BM, Benoist C, and Mathis D (2015). Appearance and disappearance of the mRNA signature characteristic of Treg cells in visceral adipose tissue: Age, diet, and PPARgamma effects. Proc Natl Acad Sci U S A 112, 482–487. [DOI] [PMC free article] [PubMed] [Google Scholar]
- Cipolletta D, Feuerer M, Li A, Kamei N, Lee J, Shoelson SE, Benoist C, and Mathis D (2012). PPAR-gamma is a major driver of the accumulation and phenotype of adipose tissue Treg cells. Nature 486, 549–553. [DOI] [PMC free article] [PubMed] [Google Scholar]
- Daluiski A, Engstrand T, Bahamonde ME, Gamer LW, Agius E, Stevenson SL, Cox K, Rosen V, and Lyons KM (2001). Bone morphogenetic protein-3 is a negative regulator of bone density. Nature genetics 27, 84. [DOI] [PubMed] [Google Scholar]
- DeFronzo RA, Tripathy D, Schwenke DC, Banerji M, Bray GA, Buchanan TA, Clement SC, Henry RR, Hodis HN, and Kitabchi AE (2011). Pioglitazone for diabetes prevention in impaired glucose tolerance. New England Journal of Medicine 364, 1104–1115. [DOI] [PubMed] [Google Scholar]
- Fonseca V (2003). Effect of thiazolidinediones on body weight in patients with diabetes mellitus. The American journal of medicine 115, 42–48. [DOI] [PubMed] [Google Scholar]
- Fontaine DA, and Davis DB (2016). Attention to background strain is essential for metabolic research: C57BL/6 and the international knockout mouse consortium. Diabetes 65, 25–33. [DOI] [PMC free article] [PubMed] [Google Scholar]
- Gouda HN, Sagoo GS, Harding A-H, Yates J, Sandhu MS, and Higgins JP (2010). The association between the peroxisome proliferator-activated receptor-γ2 (PPARG2) Pro12Ala gene variant and type 2 diabetes mellitus: a HuGE review and meta-analysis. American journal of epidemiology 171, 645–655. [DOI] [PMC free article] [PubMed] [Google Scholar]
- Hevener AL, Olefsky JM, Reichart D, Nguyen MT, Bandyopadyhay G, Leung HY, Watt MJ, Benner C, Febbraio MA, Nguyen AK, et al. (2007). Macrophage PPAR gamma is required for normal skeletal muscle and hepatic insulin sensitivity and full antidiabetic effects of thiazolidinediones. J Clin Invest 117, 1658–1669. [DOI] [PMC free article] [PubMed] [Google Scholar]
- Hoffmann JM, Grunberg JR, Church C, Elias I, Palsdottir V, Jansson JO, Bosch F, Hammarstedt A, Hedjazifar S, and Smith U (2017). BMP4 Gene Therapy in Mature Mice Reduces BAT Activation but Protects from Obesity by Browning Subcutaneous Adipose Tissue. Cell reports 20, 1038–1049. [DOI] [PubMed] [Google Scholar]
- Hsu DR, Economides AN, Wang X, Eimon PM, and Harland RM (1998). The Xenopus dorsalizing factor Gremlin identifies a novel family of secreted proteins that antagonize BMP activities. Molecular cell 1, 673–683. [DOI] [PubMed] [Google Scholar]
- Izumi N, Mizuguchi S, Inagaki Y, Saika S, Kawada N, Nakajima Y, Inoue K, Suehiro S, Friedman SL, and Ikeda K (2006). BMP-7 opposes TGF-β1-mediated collagen induction in mouse pulmonary myofibroblasts through Id2. American Journal of Physiology-Lung Cellular and Molecular Physiology 290, L120–L126. [DOI] [PubMed] [Google Scholar]
- Jaitin DA, Adlung L, Thaiss CA, Weiner A, Li B, Descamps H, Lundgren P, Bleriot C, Liu Z, Deczkowska A, et al. (2019). Lipid-Associated Macrophages Control Metabolic Homeostasis in a Trem2-Dependent Manner. Cell 178, 686–698 e614. [DOI] [PMC free article] [PubMed] [Google Scholar]
- Jurczak MJ, Lee A-H, Jornayvaz FR, Lee H-Y, Birkenfeld AL, Guigni BA, Kahn M, Samuel VT, Glimcher LH, and Shulman GI (2012). Dissociation of inositol-requiring enzyme (IRE1α)-mediated c-Jun N-terminal kinase activation from hepatic insulin resistance in conditional X-box-binding protein-1 (XBP1) knock-out mice. Journal of Biological Chemistry 287, 2558–2567. [DOI] [PMC free article] [PubMed] [Google Scholar]
- Kim D, Langmead B, and Salzberg SL (2015). HISAT: a fast spliced aligner with low memory requirements. Nature methods 12, 357. [DOI] [PMC free article] [PubMed] [Google Scholar]
- Korchynskyi O, and ten Dijke P (2002). Identification and Functional Characterization of Distinct Critically Important Bone Morphogenetic Protein-specific Response Elements in the Id1 Promoter. Journal of Biological Chemistry 277, 4883–4891. [DOI] [PubMed] [Google Scholar]
- Lehmann JM, Moore LB, Smith-Oliver TA, Wilkison WO, Willson TM, and Kliewer SA (1995). An antidiabetic thiazolidinedione is a high affinity ligand for peroxisome proliferator-activated receptor gamma (PPAR gamma). J Biol Chem 270, 12953–12956. [DOI] [PubMed] [Google Scholar]
- Levine AJ, and Brivanlou AH (2006). GDF3, a BMP inhibitor, regulates cell fate in stem cells and early embryos. Development (Cambridge, England) 133, 209–216. [DOI] [PubMed] [Google Scholar]
- Levine AJ, Levine ZJ, and Brivanlou AH (2009). GDF3 is a BMP inhibitor that can activate Nodal signaling only at very high doses. Developmental biology 325, 43–48. [DOI] [PMC free article] [PubMed] [Google Scholar]
- Liao Y, Smyth G, and Shi W (2014). featureCounts: an efficient general purpose program for assigning sequence reads to genomic features. Bioinformatics (Oxford, England) 30, 923. [DOI] [PubMed] [Google Scholar]
- Lim DA, Tramontin AD, Trevejo JM, Herrera DG, Garcia-Verdugo JM, and Alvarez-Buylla A (2000). Noggin antagonizes BMP signaling to create a niche for adult neurogenesis. Neuron 28, 713–726. [DOI] [PubMed] [Google Scholar]
- Lu M, Sarruf DA, Talukdar S, Sharma S, Li P, Bandyopadhyay G, Nalbandian S, Fan W, Gayen JR, and Mahata SK (2011). Brain PPAR-γ promotes obesity and is required for the insulin–sensitizing effect of thiazolidinediones. Nature medicine 17, 618. [DOI] [PMC free article] [PubMed] [Google Scholar]
- Majithia AR, Flannick J, Shahinian P, Guo M, Bray MA, Fontanillas P, Gabriel SB, Go TDC, Project NJFAS, Consortium STD, et al. (2014). Rare variants in PPARG with decreased activity in adipocyte differentiation are associated with increased risk of type 2 diabetes. Proc Natl Acad Sci U S A 111, 13127–13132. [DOI] [PMC free article] [PubMed] [Google Scholar]
- Mao T, Kusefoglu D, Hooks BM, Huber D, Petreanu L, and Svoboda K (2011). Long-range neuronal circuits underlying the interaction between sensory and motor cortex. Neuron 72, 111–123. [DOI] [PMC free article] [PubMed] [Google Scholar]
- Mayoral R, Osborn O, McNelis J, Johnson AM, Oh DY, Izquierdo CL, Chung H, Li P, Traves PG, Bandyopadhyay G, et al. (2015). Adipocyte SIRT1 knockout promotes PPARgamma activity, adipogenesis and insulin sensitivity in chronic-HFD and obesity . Molecular metabolism 4, 378–391. [DOI] [PMC free article] [PubMed] [Google Scholar]
- Mina AI, LeClair RA, LeClair KB, Cohen DE, Lantier L, and Banks AS (2018). CalR: A Web-Based Analysis Tool for Indirect Calorimetry Experiments. Cell Metab 28, 656–666 e651. [DOI] [PMC free article] [PubMed] [Google Scholar]
- Morán-Salvador E, López-Parra M, García-Alonso V, Titos E, Martínez-Clemente M, González-Périz A, López-Vicario C, Barak Y, Arroyo V, and Clària J (2011). Role for PPARγ in obesity-induced hepatic steatosis as determined by hepatocyte- and macrophage-specific conditional knockouts. The FASEB Journal 25, 2538–2550. [DOI] [PubMed] [Google Scholar]
- Nicholson A, Reifsnyder PC, Malcolm RD, Lucas CA, MacGregor GR, Zhang W, and Leiter EH (2010). Diet-induced obesity in Two C57BL/6 substrains with intact or mutant nicotinamide nucleotide transhydrogenase (Nnt) gene. Obesity 18, 1902–1905. [DOI] [PMC free article] [PubMed] [Google Scholar]
- Odegaard JI, Ricardo-Gonzalez RR, Goforth MH, Morel CR, Subramanian V, Mukundan L, Eagle AR, Vats D, Brombacher F, Ferrante AW, et al. (2007). Macrophage-specific PPAR[ggr] controls alternative activation and improves insulin resistance. Nature 447, 1116–1120. [DOI] [PMC free article] [PubMed] [Google Scholar]
- Parlee SD, Lentz SI, Mori H, and MacDougald OA (2014). Quantifying size and number of adipocytes in adipose tissue In Methods in enzymology (Elsevier), pp. 93–122. [DOI] [PMC free article] [PubMed] [Google Scholar]
- Pauk M, Bordukalo-Niksic T, Brkljacic J, Paralkar VM, Brault AL, Dumic-Cule I, Borovecki F, Grgurevic L, and Vukicevic S (2019). A novel role of bone morphogenetic protein 6 (BMP6) in glucose homeostasis. Acta Diabetol 56, 365–371. [DOI] [PMC free article] [PubMed] [Google Scholar]
- Qian SW, Tang Y, Li X, Liu Y, Zhang YY, Huang HY, Xue RD, Yu HY, Guo L, Gao HD, et al. (2013). BMP4-mediated brown fat-like changes in white adipose tissue alter glucose and energy homeostasis. Proc Natl Acad Sci U S A 110, E798–807. [DOI] [PMC free article] [PubMed] [Google Scholar]
- Ramirez-Zacarias J, Castro-Munozledo F, and Kuri-Harcuch W (1992). Quantitation of adipose conversion and triglycerides by staining intracytoplasmic lipids with Oil red O. Histochemistry 97, 493–497. [DOI] [PubMed] [Google Scholar]
- Ray A, and Dittel BN (2010). Isolation of mouse peritoneal cavity cells. JoVE (Journal of Visualized Experiments), e1488. [DOI] [PMC free article] [PubMed] [Google Scholar]
- Robinson MD, McCarthy DJ, and Smyth GK (2010). edgeR: a Bioconductor package for differential expression analysis of digital gene expression data. Bioinformatics 26, 139–140. [DOI] [PMC free article] [PubMed] [Google Scholar]
- Schneider CA, Rasband WS, and Eliceiri KW (2012). NIH Image to ImageJ: 25 years of image analysis. Nature methods 9, 671–675. [DOI] [PMC free article] [PubMed] [Google Scholar]
- Schreiber I, Dörpholz G, Ott C-E, Kragesteen B, Schanze N, Lee CT, Köhrle J, Mundlos S, Ruschke K, and Knaus P (2017). BMPs as new insulin sensitizers: Enhanced glucose uptake in mature 3T3-L1 adipocytes via PPARγ and GLUT4 upregulation. Scientific reports 7, 17192. [DOI] [PMC free article] [PubMed] [Google Scholar]
- Schulz TJ, Graja A, Huang TL, Xue R, An D, Poehle-Kronawitter S, Lynes MD, Tolkachov A, O’Sullivan LE, Hirshman MF, et al. (2016). Loss of BMP receptor type 1A in murine adipose tissue attenuates age-related onset of insulin resistance. Diabetologia 59, 1769–1777. [DOI] [PMC free article] [PubMed] [Google Scholar]
- Schulz TJ, Huang P, Huang TL, Xue R, McDougall LE, Townsend KL, Cypess AM, Mishina Y, Gussoni E, and Tseng Y-H (2013). Brown-fat paucity due to impaired BMP signalling induces compensatory browning of white fat. Nature 495, 379. [DOI] [PMC free article] [PubMed] [Google Scholar]
- Scott GJ, Ray MK, Ward T, McCann K, Peddada S, Jiang FX, and Mishina Y (2009). Abnormal glucose metabolism in heterozygous mutant mice for a type I receptor required for BMP signaling. Genesis 47, 385–391. [DOI] [PMC free article] [PubMed] [Google Scholar]
- Shen JJ, Huang L, Li L, Jorgez C, Matzuk MM, and Brown CW (2009). Deficiency of growth differentiation factor 3 protects against diet-induced obesity by selectively acting on white adipose. Mol Endocrinol 23, 113–123. [DOI] [PMC free article] [PubMed] [Google Scholar]
- Soccio RE, Chen ER, and Lazar MA (2014). Thiazolidinediones and the promise of insulin sensitization in type 2 diabetes. Cell Metab 20, 573–591. [DOI] [PMC free article] [PubMed] [Google Scholar]
- Stechschulte LA, Czernik PJ, Rotter ZC, Tausif FN, Corzo CA, Marciano DP, Asteian A, Zheng J, Bruning JB, Kamenecka TM, et al. (2016). PPARG Post-translational Modifications Regulate Bone Formation and Bone Resorption. EBioMedicine 10, 174–184. [DOI] [PMC free article] [PubMed] [Google Scholar]
- Stratton IM, Adler AI, Neil HAW, Matthews DR, Manley SE, Cull CA, Hadden D, Turner RC, and Holman RR (2000). Association of glycaemia with macrovascular and microvascular complications of type 2 diabetes (UKPDS 35): prospective observational study. Bmj 321, 405–412. [DOI] [PMC free article] [PubMed] [Google Scholar]
- Tontonoz P, and Spiegelman BM (2008). Fat and beyond: the diverse biology of PPARγ. Annu. Rev. Biochem. 77, 289–312. [DOI] [PubMed] [Google Scholar]
- Varga T, Mounier R, Patsalos A, Gogolak P, Peloquin M, Horvath A, Pap A, Daniel B, Nagy G, Pintye E, et al. (2016). Macrophage PPARgamma, a Lipid Activated Transcription Factor Controls the Growth Factor GDF3 and Skeletal Muscle Regeneration. Immunity 45, 1038–1051. [DOI] [PMC free article] [PubMed] [Google Scholar]
- Wang W, Yang Y, Meng Y, and Shi Y (2004). GDF-3 is an adipogenic cytokine under high fat dietary condition. Biochemical and biophysical research communications 321, 1024–1031. [DOI] [PubMed] [Google Scholar]
- Weir Jd.V. (1949). New methods for calculating metabolic rate with special reference to protein metabolism. The Journal of physiology 109, 1–9. [DOI] [PMC free article] [PubMed] [Google Scholar]
- Yore MM, Syed I, Moraes-Vieira PM, Zhang T, Herman MA, Homan EA, Patel RT, Lee J, Chen S, and Peroni OD (2014). Discovery of a class of endogenous mammalian lipids with antidiabetic and anti-inflammatory effects. Cell 159, 318–332. [DOI] [PMC free article] [PubMed] [Google Scholar]
Associated Data
This section collects any data citations, data availability statements, or supplementary materials included in this article.
Supplementary Materials
Data Availability Statement
RNA-seq data from eWAT of WT and A/A mice have been deposited in the Gene Expression Omnibus (GEO) repository under the accession number GSE151030.