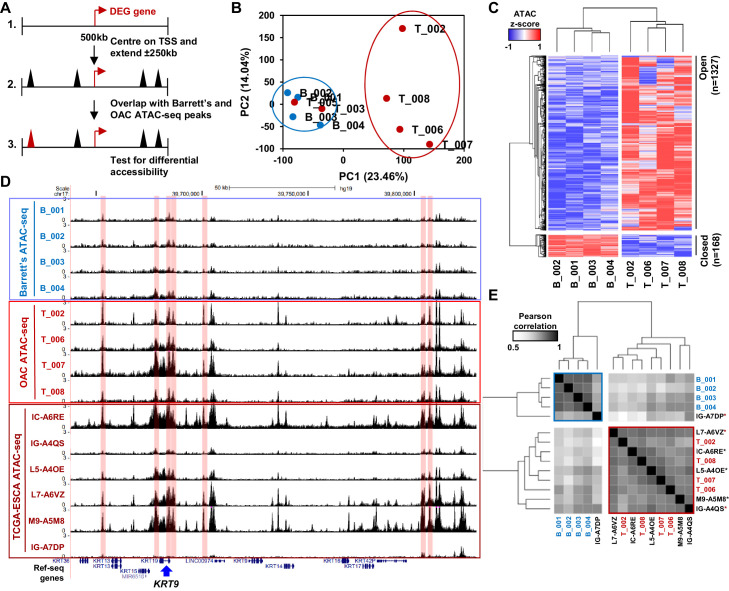
Figure 2. Altered chromatin accessibility landscape during OAC carcinogenesis.
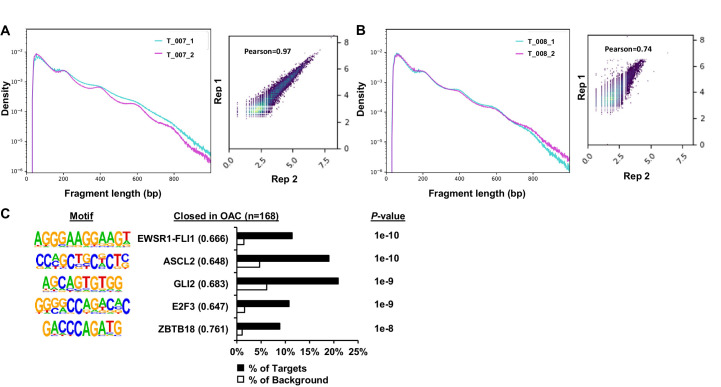
(A) Schematic of ATAC-seq analysis. All peaks within ±250 kb of the TSS of a differentially expressed genes were assessed for differential accessibility between Barrett’s oesophagus and OAC. (B) Principal Component Analysis plot of log2(1+FPKM) ATAC-seq signal from all accessible regions within ±250 kb of a differentially expressed gene TSS from all human Barrett’s oesophagus (B; n = 4) and oesophageal adenocarcinoma samples (T; n = 6). (C) Heatmap of z-score ATAC-seq signal from human Barrett’s oesophagus (B; n = 4) and OAC (T; n = 4) samples at differentially accessible regions (±2 x; Q < 0.1). Hierarchical clustering of samples and regions performed using 1-Pearson correlation. (D) Example UCSC browser view of BO, OAC and TCGA ESCA ATAC-seq data surrounding the KRT19 locus with differentially accessible regions highlighted in red. (E) Correlation plot of Pearson correlation of log2(1+FPKM) ATAC-seq signal at differentially accessible regions. Hierarchical clustering performed using 1-Pearson correlation and the two main clusters are highlighted blue (BO) and red (OAC). TCGA samples are indicated by asterisks. See also Figure 2—figure supplement 1.


