

Abstract
Russia has been currently in the “hard-hit” area of the COVID-19 outbreak, with more than 396,000 confirmed cases as of May 30. It is necessary to analyze and predict its epidemic situation to help formulate effective public health policies. Autoregressive integrated moving average (ARIMA) models were developed to predict the cumulative confirmed, dead, and recovered cases, respectively. R 3.6.2 software was used to fit the data from January 31 to May 20, 2020, and predict the data for the next 30 days. The COVID-19 epidemic in Russia was divided into two stages and reached its peak in May. The epidemic began to stabilize on May 19. The case fatality rate has been at an extremely low level. ARIMA (2,2,1), ARIMA (3,2,0), and ARIMA (0,2,1) were the models of cumulative confirmed, dead, and recovered cases, respectively. After testing, the mean absolute percentage error (MAPE) of three models were 0.6, 3.9, and 2.4, respectively. This paper indicates that Russia’s health system capacity can effectively respond to the COVID-19 pandemic. Three ARIMA models have a good fitting effect and can be used for short-term prediction of the COVID-19 trend, providing a theoretical basis for Russia to formulate new intervention policies.
Keywords: COVID-19, Time series, Estimation, ARIMA, Russia
Introduction
Since January 2020, a new coronavirus from Wuhan, China, has been spreading around the world and is named coronavirus disease 2019 (COVID-19). Since the World War II, the COVID-19 pandemic is the most serious global crisis, affecting almost all countries on our planet [1]. On March 11, WHO publicly announced COVID-19 as a “global pandemic.” As of May 30, 2020, it infected more than 6 million population and killed more than 367,000 people (https://www.who.int/docs/default-source/coronaviruse/situation-reports). The pandemic is still growing in most countries and is far from under control. Russia is currently in the “hard-hit” area of the COVID-19 outbreak, with more than 396,000 confirmed cases as of May 30. From May 2 to May 30, more than 8000 new cases were confirmed daily (https://www.worldometers.info/coronavirus/country/Russia). It is also posing a challenge to the prevention and control of the second wave of the epidemic in China, bordering with Russia. Therefore, the construction of a reasonable prediction model in Russia contributes to prevent and control the spread of COVID-19. Moreover, it can provide a methodological reference for the prediction of infectious diseases in the future.
In recent studies, the prediction models of COVID-19 are mainly divided into two categories, which are infectious disease models and their modified models, and artificial intelligence algorithms based on massive data. For example, Shengli et al. [2] established an SEIR epidemic dynamics model that can be used to evaluate and predict the COVID-19 epidemic in Hubei province. Yang et al. [3] applied modified SEIR and AI to predict the trend of China’s COVID-19 under public health intervention. Pereira et al. [4] developed a modified stacked auto-encoder for modeling the transmission dynamics of the epidemics and applied this model to forecasting COVID-19 dynamics in Brazil. Al-Qaness et al. [5] improved the adaptive neuro-fuzzy inference system (ANFIS) by applying an enhanced flower pollination algorithm using the Salp Swarm Algorithm to estimate the number of confirmed COVID-19 cases in China. However, they also have their disadvantages. Epidemiological models require parameters and depend on many assumptions. Artificial intelligence algorithm requires huge amounts of data, high complexity, and uncertainty [6].
To overcome these limitations and help public health planning and decision-making, we try to use the autoregressive integrated moving average (ARIMA) model, which has the advantages of simple structure, strong applicability, and strong data set interpretation ability [7]. It has been widely used for short-term prediction of infectious diseases. For instance, Earnest et al. [7] used the ARIMA model to predict and monitor the number of beds occupied during a SARS outbreak in a tertiary hospital in Singapore. Wang et al. [8] estimated the morbidity of Influenza in Ningbo, China, 2006–2014 by the ARIMA model. Singh et al. [9] forecasted the transmission trajectory of COVID-19 disease in the 15 worst-hit countries in the next 2 months based on the ARIMA model. Therefore, we respectively established the ARIMA model based on the monitoring data of cumulative confirmed cases, cumulative death cases, and cumulative recovered cases of COVID-19 in Russia as of May 20, 2020, to predict the trend in the next 30 days.
Methods
Data Collection
From January 31 to May 30, 2020, Russia’s COVID-19 daily reported cumulative confirmed, dead, and recovered data were extracted from the John Hopkins Coronavirus resource center (https://coronavirus.jhu.edu/). The data from January 31 to May 20 is used as a training set to build ARIMA models, and the data from May 21 to May 30 is used as a verification set to test the accuracy of these models.
Excel 2010 is used to build the Russian COVID-19 time series database, and R 3.6.2 software is used to build and predict the ARIMA model. Descriptive statistics of the COVID-19 data of Russia between 2020/1/31 and 2020/5/20 are given in Table 1.
Table 1.
Descriptive statistics of COVID-19 in Russia 2020/1/31–2020/5/20
| Cases | Confirmed | Dead | Recovered |
|---|---|---|---|
| Mean | 48,819 | 451 | 8313 |
| St. Dev | 85,093 | 794 | 18,299 |
| Maximum | 308,705 | 2972 | 85,392 |
| Minimum | 2 | 0 | 0 |
| Skewness | 1.73 | 1.74 | 2.55 |
| Kurtosis | 1.70 | 1.77 | 5.76 |
ARIMA Model
The ARIMA model is a time series forecasting method proposed by Box and Jenkins in the 1970s. The model includes AR(p), MA(q), ARMA (p, q), ARIMA (p, d, q), and so on. Among them, ARIMA (p, d, q) means that the time series is differentiated d times, and each observation in the sequence is represented by a linear combination of the past p observations and q residuals [10]. p and q are the autoregressive order and moving average order, and d is the different order. The basic idea of the model is to treat the sequence as a set of time-dependent random variables and describe it with a mathematical model, based on the previous sequence value to predict future values [11]. The predicted value represents a linear function composed of the most recent true value and the most recent prediction error. The ARIMA (p, d, q) model can be presented as given in the Eq. (1).
| 1 |
The steps to build the ARIMA model include the following:
Stationarity test
Use the augmented Dickey-Fuller (ADF) test to detect whether the time series is stationary. The P value of the ADF test is less than 0.05, indicating that the sequence is stationary. If the original sequence is not stationary, it can be converted to a stationary sequence by differential operation [12, 13], and the value of d is determined.
-
(2)
Model identification
Use the autocorrelation (ACF) graph and partial autocorrelation (PACF) graph to determine the values of p and q.
-
(3)
Fit and evaluation model
Use Box. Test () function to test whether the residual sequence is white noise. P > 0.05, the residual sequence is white noise. The ARIMA model can better fit the data. In this study, mean percentage error (MPE), mean absolute percentage error (MAPE), and mean absolute standardized error (MASE) were applied to verify the fitting effect of the developed ARIMA model.
-
(4)
Predict the data for the next 30 days
Compare the actual values with the predicted values from 5.21 to 5.30 to test the accuracy of the model. With MAPE as the standard, the smaller the value, the higher the model accuracy [14]. It is expressed mathematically in the Eq. (2).
| 2 |
Results
The Tendency Analysis of COVID-19 in Russia
As seen in Fig. 1a, Russia has 308,705 confirmed cases, 2972 deaths, 85,392 recovery cases, and 220,341 existing cases as of May 20, 2020. The cumulative number of confirmed cases remained at 2 cases from January 31 to March 1 and was recovered from the hospital on February 12. Therefore, the Russian epidemic was free from February 12 to March 1. Russia’s case fatality rate has always been at a very low level of 0.96% as of May 20. As seen from Fig. 1b, daily increased confirmed slowly from March 2 to March 24, with a maximum of 71 new cases in a single day. However, from March 25th to May 20th, there was a rapid upward trend, with new cases breaking through 1000, 5000, and 10,000 cases on April 7, April 19, and May 2, respectively. It reached a maximum of 11,656 cases on May 11. Since then, there has been a downward trend. The number of recovered cases has been on the rise. From May 7, the number of newly recovered cases per day was maintained at more than 2000. In particular, on May 20 up to 9262 cases were recovered, which coincided with newly confirmed cases. It indicated that the epidemic in Russia maintained a balanced state and was controlled.
Fig. 1.
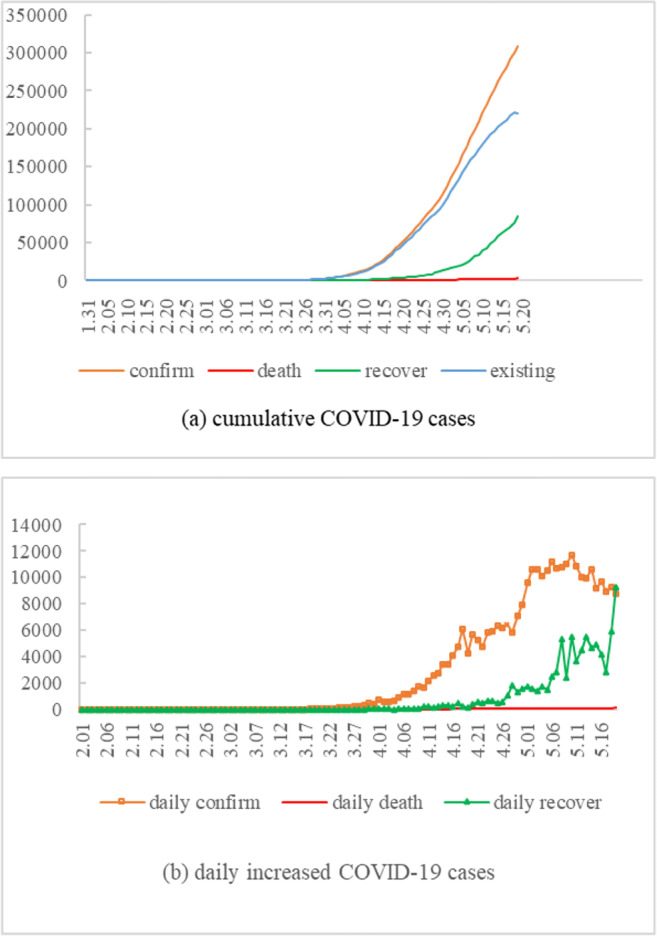
The cumulative confirmed, death, recovered, and existing COVID-19 cases between Jan 31st, 2020, and May 20th, 2020 (a). The daily new confirmed, death, and recovered COVID-19 cases between Feb 1st, 2020, and May 20th, 2020 (b)
Estimating the Cases of COVID-19 Using the ARIMA Model
Stationarity test
Judging from Fig. 1a, the original sequence has a clear long-term trend, indicating that it is not stable. Use the diff () function for the second-order difference, and then use the adf.test () function for the ADF test. The results show that Dickey-Fuller (confirm) = 3.55, P = 0.04; Dickey-Fuller (death) = 7.01, P = 0.01; Dickey-Fuller (recover) = − 6.66, P = 0.01, so the sequence after the difference is stationary, and d = 2.
-
(2)
Model identification
Determine the value of p and q according to ACF and PACF graphs of the sequence after difference. Figure 2a shows that ACF and PACF are both gradually reduced to 0, using the ARIMA (p, d, q) model. Take 0, 1, 2, respectively, and experiment from low order to high order one by one. Debug one by one according to the minimum principle of Akaike information criterion (AIC), and finally choose ARIMA (2,2,1) as the confirmed model. Figure 2b shows that the ACF graph shows tailing, and the PACF graph decreases to 0 after the third order, that is, the third-order truncation, P = 3, so the dead model is ARIMA (3,2,0). Figure 2c shows that the ACF graph decreases to 0 after the first order, that is, the first-order truncation, q = 1, and the PACF graph shows tailing, so the recovered model is ARIMA (0,2,1).
-
(3)
Fit and evaluation model
Fig. 2.

The ACF and PACF graphs for the series of confirmed (a), death (b), and recovered (c)
It is seen from Table 2 that the residual sequences are all white noise sequences (P > 0.05). The values of MPE, MAPE, and MASE are also small, and the maximum values of the three indicators are 2.05, 11.75, and 0.30, respectively, indicating that the models fit well.
Table 2.
Forecast index of ARIMA models
| Models | Box-Pierce test | Fitting index of model | ||||
|---|---|---|---|---|---|---|
| γ2 | df | P values | MPE | MAPE | MASE | |
| ARIMA (2,2,1) | 18.31 | 15 | 0.25 | 1.15 | 4.32 | 0.08 |
| ARIMA (3,2,0) | 15.32 | 15 | 0.43 | 2.13 | 11.75 | 0.16 |
| ARIMA (0,2,1) | 13.49 | 15 | 0.57 | 2.05 | 7.71 | 0.30 |
-
(4)
Prediction
Test the accuracy of the model by comparing the difference between the predicted value and the actual value from May 21 to May 30, 2020. As seen in Table 3, the MAPE of the confirmed model is 0.60, indicating that the model has high prediction accuracy and is robust. The MAPEs of the death model and the recovery model were 3.90 and 2.40, respectively, indicating that models are relatively robust. Use established ARIMA models to predict the cumulative confirmed, death, and recovered data for the next 30 days in Russia. As seen in Fig. 3, On June 19, the cumulative number of confirmed, death, and recovered cases will reach 547,143, 6487, 305,558.
Table 3.
Comparison of the reality and predicted values of 5.21–5.30
| Date | Confirmed | Death | Recovered | ||||||
|---|---|---|---|---|---|---|---|---|---|
| Reality | Predict | ∣et/yt∣ | Reality | Predict | ∣et/yt∣ | Reality | Predict | ∣et/yt∣ | |
| 5.21 | 317,554 | 317,466 | 0.00 | 3099 | 3096 | 0.00 | 92,681 | 92,731 | 0.00 |
| 5.22 | 326,448 | 326,087 | 0.00 | 3249 | 3205 | 0.01 | 99,825 | 100,070 | 0.00 |
| 5.23 | 335,882 | 334,621 | 0.00 | 3388 | 3316 | 0.02 | 107,936 | 107,409 | 0.00 |
| 5.24 | 344,481 | 343,064 | 0.00 | 3541 | 3435 | 0.03 | 113,299 | 114,747 | 0.01 |
| 5.25 | 353,427 | 351,427 | 0.01 | 3633 | 3557 | 0.02 | 118,798 | 122,086 | 0.03 |
| 5.26 | 362,342 | 359,716 | 0.01 | 3807 | 3675 | 0.03 | 131,129 | 129,425 | 0.01 |
| 5.27 | 370,680 | 367,937 | 0.01 | 3968 | 3789 | 0.05 | 142,208 | 136,764 | 0.04 |
| 5.28 | 379,051 | 376,096 | 0.01 | 4142 | 3906 | 0.06 | 150,993 | 144,103 | 0.05 |
| 5.29 | 387,623 | 384,199 | 0.01 | 4374 | 4024 | 0.08 | 159,257 | 151,442 | 0.05 |
| 5.30 | 396,575 | 392,250 | 0.01 | 4555 | 4142 | 0.09 | 167,469 | 158,781 | 0.05 |
| MAPE | 0.60 | 3.90 | 2.40 | ||||||
Fig. 3.

The cumulative confirmed (a), death (b), and recovered (c) COVID-19 cases predicted by the ARIMA model in the next 30 days in Russia
Discussion
COVID-19 in Russia was divided into two stages. From January 31 to March 1, there was no impact on the epidemic. From March 2 to the March 20, the disease broke out, spread, and grew exponentially. There were three main reasons for the Russian epidemic: (1) Russia did not strictly control the entry of people in Europe immediately after the outbreak in Europe. According to relevant reports, more than 100,000 people entered Russia from Europe, and they were distributed in various places in Russia. (2) After the domestic epidemic had been controlled, Russia had also relaxed its prevention and control. (3) Compared with international standards, Russian self-developed kits had two grades lower, so many patients with asymptomatic and mild symptoms were not diagnosed and separated in time. Analyzing these reasons had a good warning meaning to the countries that had controlled the epidemic and prevent the spread of the second wave of the epidemic.
The epidemic in Russia peaked in May, with more than 10,000 new cases confirmed daily for 10 consecutive days. Since May 11, there had been a downward trend. Judging from the recovery curve, the daily confirmed cases and recovered cases coincided on May 19, which showed that the epidemic situation in Russia tended to be stable. Russia’s case-fatality rate had been at a very low level of 0.96%, which might be because the cases were mostly mild, which also indirectly shown that its intervention measures are effective. Although the number of confirmed cases ranked among the top 5 in the world on May 20, Russia’s health system capacity could effectively respond to the COVID-19 pandemic.
Time series data can help to predict epidemic trends and improve prevention systems. The time series forecasting models include the exponential smoothing model and artificial neural network. Although these models can be used to predict the incidence of infectious diseases, they have some limitations. For exponential smoothing model, it is difficult to determine the smoothing coefficient because the weight decreases with the extension of the forecast period. For artificial neural networks, it may not well explain the nonlinear relationship in time series data. The ARIMA model is the most popular and classic time series forecasting model because of its simplicity, system structure, and acceptable prediction performance [15]. It obtains a smooth sequence through difference and then selects the best model for prediction. It can not only solve the problem of data autocorrelation but also analyze data with periodic effects. Therefore, it can better simulate the past epidemic situation and obtain better prediction effect.
In my study, ARIMA models were developed to predict the cumulative confirmed, dead, and recovered cases of COVID-19 in Russia, respectively. Taking the data from 5.21 to 5.30 as a test set to evaluate the extrapolation effect of the models with MAPE as the evaluation standard. The cumulative confirmed model was very robust, with the MAPE of 0.60. From the MAPEs of 3.9 and 2.4, the cumulative death and recovery models were relatively stable. There have been many articles using the ARIMA model to predict the trend of COVID-19 in different countries [9, 16]. In Iran, Moftakhar et al. [17] used the ARIMA model and artificial neural network to predict the daily new COVID-19 infections, which showed that the ARIMA model was more accurate. Ceylan [16] estimated the prevalence of COVID-19 in Italy, Spain, and France, with MAPE(Italy) = 4.752, MAPE(Spain) = 5.849, and MAPE(France) = 5.634. Therefore, the ARIMA (2,2,1), ARIMA (3,2,0), and ARIMA (0,2,1) models were considered to be reasonable for forecasting with high accuracy.
According to the predicted data from 5.21 to 6.19, although the cumulative number of confirmed cases is still on the rise, the number of daily new confirmed cases on May 30 fell to 8000, and then basically stabilized at about 7000, lower than the daily new recovery cases. Therefore, the Russian epidemic will be further controlled. Constructing the predictive model based on time series data is an important method for the prevention and control of infectious diseases. The ARIMA model has a mature theoretical basis and clear criteria, which can effectively predict the epidemic trend of infectious diseases. This will help to effectively allocate medical resources and will have guiding significance for scientific prevention and control of COVID-19.
Conclusions
Russia’s interventions on COVID-19 have achieved remarkable effects. Russia’s health system capacity can effectively respond to the COVID-19 pandemic. Established ARIMA models had a good fitting effect and can be used for short-term prediction of the COVID-19 trend, providing a theoretical basis for Russia to formulate new intervention policies.
Authors’ Contribution
Conceptualization, Lanlan Fang and Dingjian Wang. Methodology, Lanlan Fang. Software, Dingjian Wang. Validation, Dingjian Wang. Formal analysis, Lanlan Fang. Investigation, Dingjian Wang. Resources, Lanlan Fang. Data curation, Dingjian Wang. Writing—original draft preparation, Lanlan Fang. Writing—review and editing, Guixia Pan. Visualization, Lanlan Fang. Supervision, Guixia Pan. Project administration, Guixia Pan. Funding acquisition, Guixia Pan. All authors have read and agreed to the published version of the manuscript.
Funding
This paper was supported by the Special Funding for the Prevention and Control of New Coronary Pneumonia Epidemic from China Postdoctoral Science Foundation (2020T130001ZX), the Anhui Medical University Doctoral Research Foundation (XJ201414) and the Anhui Postdoctoral Foundation (2017B237).
Data Availability
The datasets used and/or analyzed during the current study are available from the websites.
Compliance with Ethical Standards
Conflict of Interest
The authors declare that they have no competing interests.
Ethical Approval and Consent to Participate
Not applicable.
Footnotes
Publisher’s Note
Springer Nature remains neutral with regard to jurisdictional claims in published maps and institutional affiliations.
Contributor Information
Lanlan Fang, Email: fanglanlanxi@163.com.
Dingjian Wang, Email: Wangdingjian666@163.com.
Guixia Pan, Email: pgxkd@163.com.
References
- 1.Boccaletti S, Ditto W, Mindlin G, Atangana A. Modeling and forecasting of epidemic spreading: the case of Covid-19 and beyond. Chaos Solitons Fractals. 2020;135:109794. doi: 10.1016/j.chaos.2020.109794. [DOI] [PMC free article] [PubMed] [Google Scholar]
- 2.Shengli C, Peihua F, Pengpeng S. Study on the epidemic development of corona virus disease-19 (COVID-19) in Hubei province by a modified SEIR model. J Zhejiang Univ (Med Sci) 2020;33–1248:178–184. doi: 10.3785/j.issn.1008-9292.2020.02.05. [DOI] [PMC free article] [PubMed] [Google Scholar]
- 3.Yang Z, Zeng Z, Wang K, Wong SS, Liang W, Zanin M, Liu P, Cao X, Gao Z, Mai Z, et al. Modified SEIR and AI prediction of the epidemics trend of COVID-19 in China under public health interventions. J Thorac Dis. 2020;12:165–174. doi: 10.21037/jtd.2020.02.64. [DOI] [PMC free article] [PubMed] [Google Scholar]
- 4.Pereira IG, Guerin JM, Silva Júnior AG, Garcia GS, Piscitelli P, Miani A, et al. Forecasting Covid-19 dynamics in Brazil: a data driven approach. Int J Environ Res Public Health. 2020;17. 10.3390/ijerph17145115. [DOI] [PMC free article] [PubMed]
- 5.Al-Qaness MAA, Ewees AA, Fan H, Abd El Aziz M. Optimization method for forecasting confirmed cases of COVID-19 in China. J Clin Med. 2020;9. 10.3390/jcm9030674. [DOI] [PMC free article] [PubMed]
- 6.Martín Noguerol T, Paulano-Godino F, Martín-Valdivia MT, Menias CO, Luna A. Strengths, weaknesses, opportunities, and threats analysis of artificial intelligence and machine learning applications in radiology. J Am Coll Radiol. 2019;16:1239–1247. doi: 10.1016/j.jacr.2019.05.047. [DOI] [PubMed] [Google Scholar]
- 7.Earnest A, Chen MI, Ng D, Sin LY. Using autoregressive integrated moving average (ARIMA) models to predict and monitor the number of beds occupied during a SARS outbreak in a tertiary hospital in Singapore. BMC Health Serv Res. 2005;5:36. doi: 10.1186/1472-6963-5-36. [DOI] [PMC free article] [PubMed] [Google Scholar]
- 8.Wang C, Li Y, Feng W, Liu K, Zhang S, Hu F, et al. Epidemiological features and forecast model analysis for the morbidity of influenza in Ningbo, China, 2006–2014. Int J Environ Res Public Health. 2017:14. 10.3390/ijerph14060559. [DOI] [PMC free article] [PubMed]
- 9.Singh RK, Rani M, Bhagavathula AS, Sah R, Rodriguez-Morales AJ, Kalita H, Nanda C, Sharma S, Sharma YD, Rabaan AA, Rahmani J, Kumar P. Prediction of the COVID-19 pandemic for the top 15 affected countries: advanced autoregressive integrated moving average (ARIMA) model. JMIR Public Health Surveill. 2020;6:e19115. doi: 10.2196/19115. [DOI] [PMC free article] [PubMed] [Google Scholar]
- 10.Fanoodi B, Malmir B, Jahantigh FF. Reducing demand uncertainty in the platelet supply chain through artificial neural networks and ARIMA models. Comput Biol Med. 2019;113:103415. doi: 10.1016/j.compbiomed.2019.103415. [DOI] [PubMed] [Google Scholar]
- 11.Peruggia, M. The analysis of time series: an introduction (6th ed.). J Am Stat Assoc 2004; 906–907.
- 12.Wulff SS. Time series analysis: forecasting and control, 5th edition. J Qual Technol. 2017;49:418–420. doi: 10.1080/00224065.2017.11918006. [DOI] [Google Scholar]
- 13.Ruby-Figueroa R, Saavedra J, Bahamonde N, Cassano A. Permeate flux prediction in the ultrafiltration of fruit juices by ARIMA models. J Membr Sci. 2017:108–16. 10.1142/9781860949388_0006.
- 14.Zou JJ, Jiang GF, Xie XX, Huang J, Yang XB. Application of a combined model with seasonal autoregressive integrated moving average and support vector regression in forecasting hand-foot-mouth disease incidence in Wuhan, China. Medicine (Baltimore) 2019;98:e14195. doi: 10.1097/MD.0000000000014195. [DOI] [PMC free article] [PubMed] [Google Scholar]
- 15.Wang YW, Shen ZZ, Jiang Y. Comparison of ARIMA and GM(1,1) models for prediction of hepatitis B in China. PLoS One. 2018;13:e0201987. doi: 10.1371/journal.pone.0201987. [DOI] [PMC free article] [PubMed] [Google Scholar]
- 16.Ceylan Z. Estimation of COVID-19 prevalence in Italy, Spain, and France. Sci Total Environ. 2020;729:138817. doi: 10.1016/j.scitotenv.2020.138817. [DOI] [PMC free article] [PubMed] [Google Scholar]
- 17.Moftakhar L, Seif M, Safe MS. Exponentially increasing trend of infected patients with COVID-19 in Iran: a comparison of neural network and ARIMA forecasting models. Iran J Public Health. 2020;49:92–100. doi: 10.34172/aim.2020.03. [DOI] [PMC free article] [PubMed] [Google Scholar]
Associated Data
This section collects any data citations, data availability statements, or supplementary materials included in this article.
Data Availability Statement
The datasets used and/or analyzed during the current study are available from the websites.