

Abstract
Oxygen (O2) is a critical component of life; without proper O2 levels, cells are unable to respire, meaning glucose cannot be utilized. Thus, hypoxia (low O2 levels) is a well-documented stressor, especially in aquatic environments. Neuropeptides are a major class of regulators for stress-induced responses; however, their global expression changes during stress are not well characterized due to the natural complexity of the nervous system. Beyond being a neurological model organism, crustaceans are regularly exposed to hypoxia, making them a relevant system for this study. Several neuropeptide families, including orcokinins, RFamides, and allatostatin A-types, show dynamic dysregulation due to hypoxia stress. In particular, the brain showed the most dynamic changes with a survival mechanism “switching” (i.e., significant increase to decrease) of neuropeptide content between moderate and severe hypoxia (e.g., NFDEDRSGFA, FDAFTTGFGHS, NRNFLRFamide, and APSGFLGMRamide). Globally, neuropeptides in different tissues appeared to exhibit unique expression patterns at the various severities of hypoxia, including LSSSNSPSSTPL and NFDEIDRSSFGF. Overall, this study provides clear evidence for the benefits of globally analyzing biomolecules and that neuropeptides play a critical role in how crustaceans adapt due to hypoxia stress.
Keywords: Callinectes sapidus, mass spectrometry, neuropeptide, hypoxia stress, duplex reductive dimethylation, stable isotopic labeling for quantitation
Graphical Abstract

Introduction
Hypoxia, or low oxygen (O2) levels, poses a physiological challenge for many organisms, especially aquatic invertebrates. Estuarine ecosystems, for example, are well known to have seasonal hypoxic/anoxic zones (e.g., dead zones) from stratification of the water due to eutrophication (i.e., enrichment of the environment with nutrients).1–3 The presence of these zones decreases the quality of the habitat leading to mortality of organisms unable to escape. Several studies have been done to understand the physical and biochemical changes that occur due to these conditions.4–13 Flounder growth rates were seen to drop by ~90% at low O2 levels when coupled to temperature elevation.4 Feeding rates also decreased at all temperatures when the flounder was exposed to hypoxia. Furthermore, in the estuarine fish Fundulus grandis, reproduction rates were reduced considerably after hypoxia exposure.5 It is clear that hypoxia stress can have a major effect on the population of an organism, and the evolutionarily developed survival mechanisms need to be studied.
Crustaceans are well known for residing and surviving where hypoxia is rampant. The blue crab, Callinectes sapidus, for example, is a well-studied organism in hypoxia research, as it mainly resides in coastal estuaries, such as the Chesapeake Bay.6–13 While the survival of blue crabs in low dissolved O2 levels does decline with increasing exposure time, crabs still have a surprisingly high survival rate, with over 80% surviving at <20% oxygen saturation for 30 hours.10 Molecularly, another study showed that hypoxia has a dramatic impact on phenoloxidase enzyme activity in C. sapidus, which can have a direct effect on the organism’s ability to fight deadly infections.6 Other molecular players, such as hemocyanin, the protein that assists in oxygen transfer in the crustacean body, has been shown to be different for hypoxia-tolerant and hypoxia-sensitive crustaceans.7, 9, 10 Ultimately, there is a lack of knowledge on the precise molecular mechanisms that allow crustaceans to survive during these stressful conditions.
Neuropeptides, one of the most diverse and complex classes of signaling molecules, are thought to be major regulators of the stress response. For example, in mammalians, hypoxia is a well-documented stressor (i.e., during cancer, exercise, respiratory distress, etc.), and thus, has been the focus of multiple studies.14–18 Of particular interest are mammalian neuropeptide Y (NPY)14, 17–19 and substance P (SP).17, 18 In comparison, most crustacean neuropeptide studies have focused on other stressors, such as temperature or salinity stress.20, 21 With their simple, well-characterized nervous system, crustaceans, especially the blue crab, provide not only a model organism for neuropeptide studies but also a relevant system for understanding environmental hypoxia stress. Interestingly, NPY and SP are homologous to crustacean neuropeptide families RFamides and tachykinin22–26, respectively, and results from crustacean-focused studies can be translated to higher order organisms. Until recently,27 the only neuropeptide studies involving both hypoxia and crustaceans have been on crustacean hyperglycemic hormone (CHH) and crustacean cardioactive peptide (CCAP) neuropeptides.12, 28–31 Other invertebrates, such as C. elegans, have been used for hypoxia studies, including the investigation of how hypoxia-inducible transcription factor-1 upregulated serotonin as well as induced other neurological alterations.32 Overall, there is a large knowledge gap in understanding the global neuromodulation of hypoxia-induced stress.
Neuropeptides provide a unique challenge for analysis since they exist at low in vivo concentrations.33, 34. Thus, absolute quantitation is still extremely challenging,35 with some in vivo concentrations of crustacean neuropeptides residing in the sub-micro- to sub-nano-molar levels in tissues and low pico-molar levels in hemolymph.36, 37 This is exacerbated by the fact that neuropeptide families contain multiple isoforms that may only differ by a single amino acid, making antibody-based assays difficult.36 To comprehensively characterize all the neuropeptide changes due to hypoxia stress, we must utilize a simple, relative quantitation method coupled to a sensitive, selective technology for detection and identification.
Here, we utilized matrix-assisted laser desorption/ionization (MALDI-) and electrospray ionization (ESI-) mass spectrometry (MS) technologies to profile the global neuropeptidomic changes with high mass resolution in the blue crab Callinectes sapidus.33 Three tissues, including the sinus gland (SG), brain, and pericardial organ (PO), were collected to understand the dynamic changes due to three different severities of hypoxia stress using duplex reductive dimethylation, a simple, cost-effective, well-characterize relative quantitation method proven effective in multiple related studies.27, 38, 39 Not only were distinct trends seen across each tissue type, especially the brain, but neuropeptides found in all three tissues also showed variable expression changes depending on the hypoxic severity (e.g., allatostatin A-type NPYSFGLamide, mass-to-charge ratio (m/z) 796.399).
Results and Discussion
Visualizing Reductive Dimethylation and Its Application to Hypoxia
In order to compare the neuropeptidomic changes due to different severities of hypoxia (severe (1 parts per million (ppm) O2, 10% O2 water saturation, n=7), moderate (2 ppm O2, 20% O2 water saturation, n=5), and mild (5 ppm O2, 50% O2 water saturation, n=5)) to control conditions (8–10 ppm O2, 80–100% O2 water saturation), a duplex reductive dimethylation strategy was utilized to increase throughput and quantitative accuracy.27, 38, 39 An example spectrum is shown in Figure 1, where the light labels (closed hexagon) and heavy labels (open hexagon) reflect neuropeptide levels in the control and hypoxia-affected crustacean, respectively. In this example, it can be visually inferred that the highlighted neuropeptides from the orcokinin family decrease due to hypoxia stress. These intensity levels can be visualized in bar graphs to infer trends across different severities of hypoxia in various tissue types, including the SG, brain, and PO (Figures S1, 2, and 3, respectively).
Figure 1.
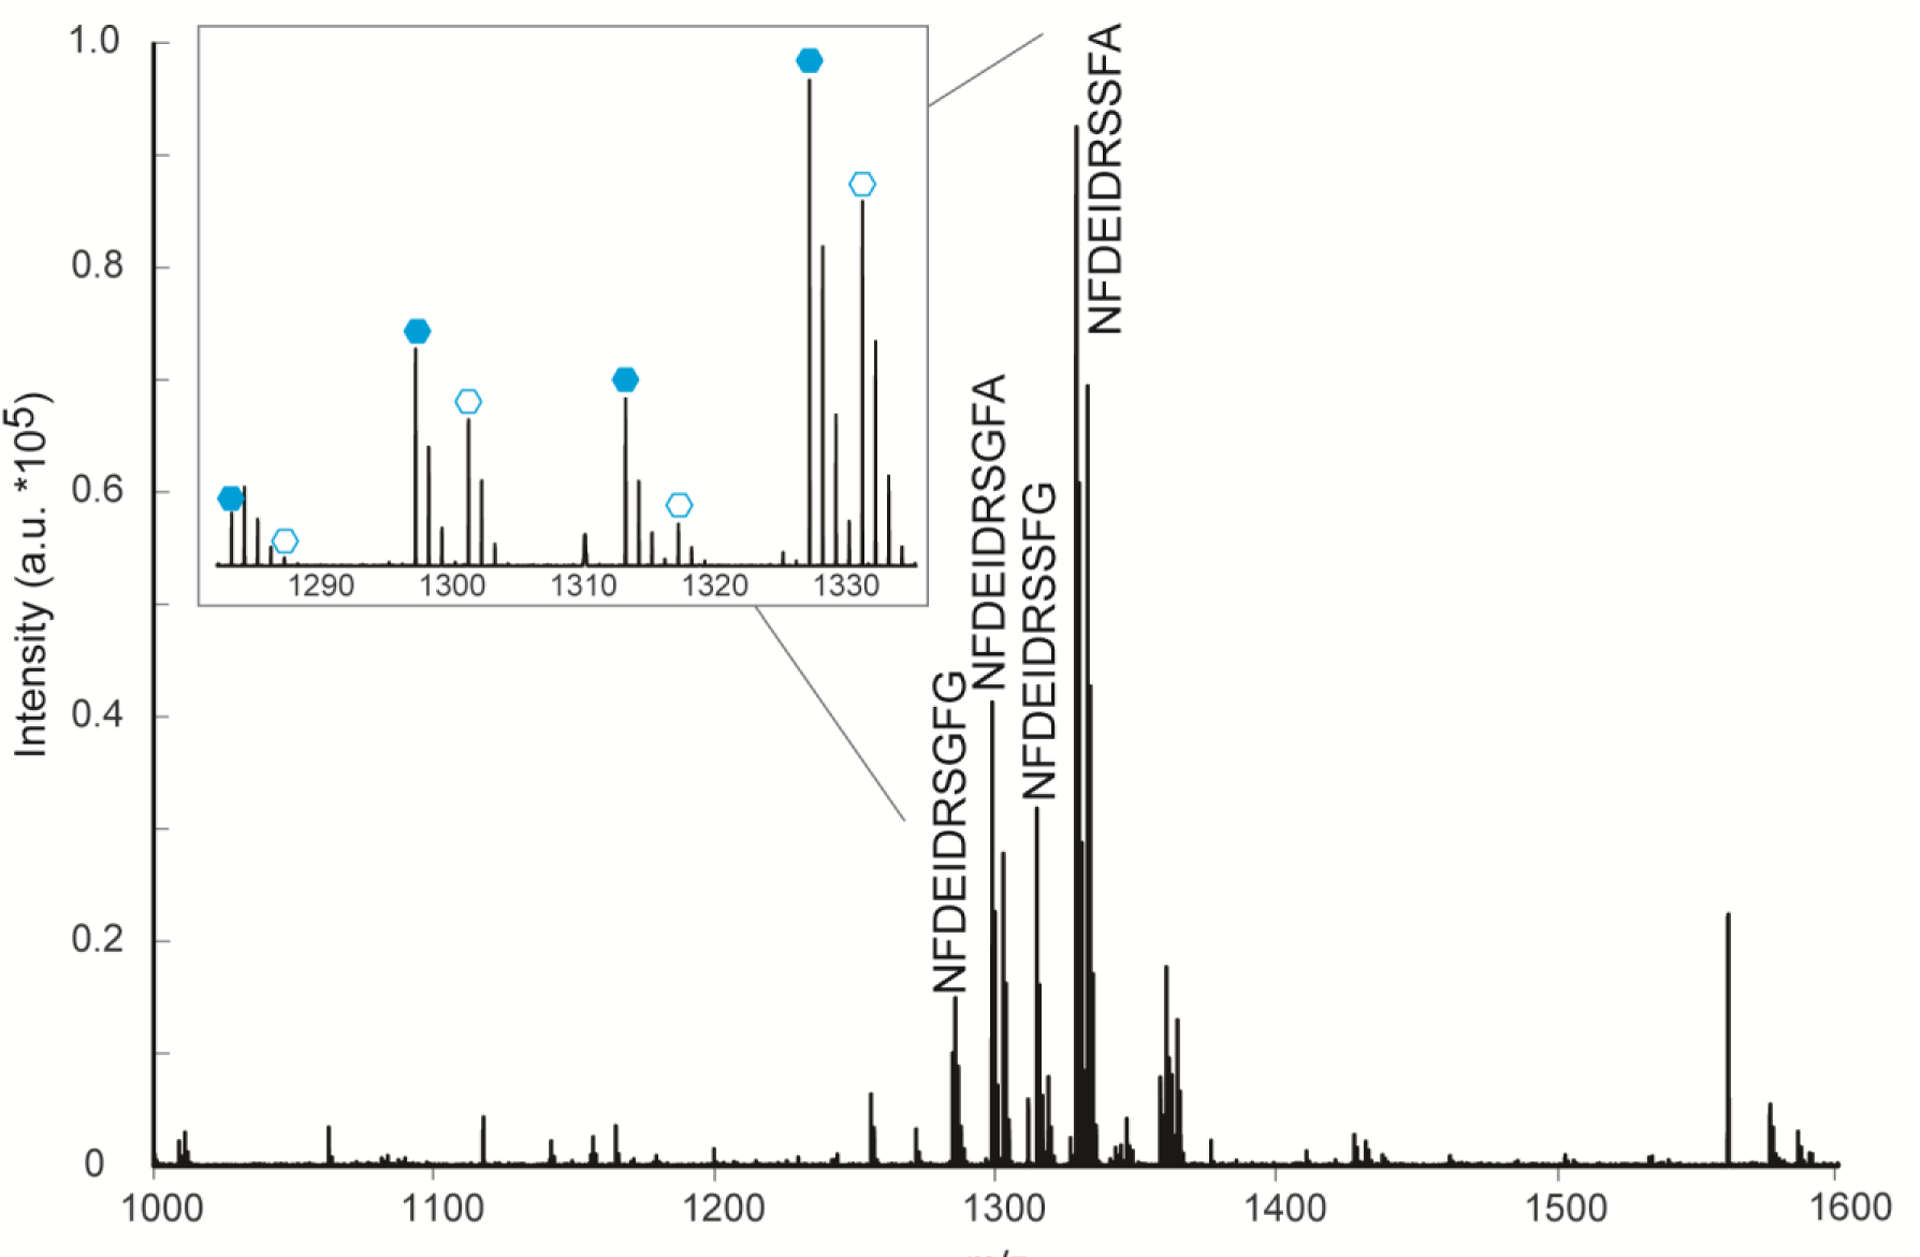
A representative MALDI-MS spectrum where duplex reductive dimethylation was utilized to compare neuropeptide levels between a control (light labeled, closed hexagons) and hypoxia (1 ppm O2, 1 hour) stressed (heavy labeled, open hexagons) blue crabs. Several orcokinin neuropeptides are highlighted.
Neuropeptide Identification Verification Using ESI-MS
This study focuses on the utilization of MALDI-MS to quantify neuropeptides. Because MALDI-MS is well known to produce singly-charged ions, accurate mass matching (instead of tandem MS (MS/MS)) of the full-length, intact peptide must be performed in order to confidently identify peptides. In contrast, ESI-MS produces multiply charged ions, which offers better fragmentation efficiency and permits us to perform MS/MS instead of accurate mass matching for peptide identification. Consequently, this also allows us to also analyze and detect truncated forms of the neuropeptides. Thus, liquid chromatography (LC)-ESI-MS/MS was used to further verify the neuropeptides identified by MALDI-MS. The neuropeptides that were detected by both MALDI-MS and ESI-MS are indicated in Tables S1, S2, and S3. For the SG, brain, and PO tissue extracts, 44%, 49%, and 35% of neuropeptides detected in MALDI-MS were also detected by ESI-MS, respectively, with an overall average of 39% for all neuropeptides detected in this study (Figure S2). Although the overlap is less than 50% overall (since MALDI and ESI are complementary ionization sources), the overlap between neuropeptides detected from these techniques aligns with similar, previous studies.39–41 One case where verifying with ESI-MS is beneficial is the rare occurrence where two neuropeptides appear to have identical masses at the mass resolution offered by the Orbitrap instruments used in this study. For example, AGWSSMRGAWamide and QWSSMRGAWamide share the same mass and both were tentatively identified as significantly upregulated in the brain tissue at 2 ppm O2 hypoxia severity by MALDI-MS (Table S2). While we cannot say QWSSMRGAWamide is not present, AGWSSMRGAWamide was identified by ESI-MS/MS, further supporting its existence. Thus, we have confidence that at least one of those neuropeptides is present in the samples beyond accurate mass matching. In this study, 110 neuropeptides with unique masses and 11 neuropeptides with non-unique masses were detected (4 sets of two neuropeptides with identical masses and 1 set of three neuropeptides with identical masses). ESI-MS/MS confirmed the presence of one neuropeptide from each of these sets, except for one pair of RYamide neuropeptides from the PO tissue (Table S3); however, the change in expression for this peptide was not significant. Another case where utilizing ESI-MS becomes beneficial is when two peptides have masses that are within ± 5 ppm. There was only 1 set of two neuropeptides detected that fit this description, RFamides GAHKNYLRFamide and AQPSMRLRFamide (Table S3), and GAHKNYLRFamide was detected by ESI-MS/MS analysis.
Interestingly, the brain and SG tissues contained the highest similarity in neuropeptide families (allatostatin A-type (AST-A), RFamide, and tachykinin) that overlapped between MALDI-MS and ESI-MS, which is not surprising as there already is a relatively large overlap in neuropeptide content between these tissues overall (Figure 4). Additionally, CHH precursor-related peptide (CPRP) family neuropeptides were uniquely detected by ESI-MS/MS. These observations further highlight the complementarity of these two ionization techniques and benefits of combining both methods to achieve more comprehensive neuropeptidomic characterization.
Figure 4.

A Venn diagram depicting the neuropeptide overlap (regardless of expression changes) of the three tissues studied. Neuropeptides that are found in any of the 3 conditions (severe (1 ppm O2, 1 hour), moderate (2 ppm O2, 1 hour), and mild (5 ppm O2, 1 hour) hypoxia) and in at least 3 bioreplicates (of n=7, n=5, and n=5, respectively) in a tissue are included. The neuropeptides included can be found in Tables S1-S3. SG: Sinus Glad; PO: Pericardial Organ.
Probing Neuropeptidomic Changes Across All Severity Conditions
Initially, to gain the greatest biological resolution, only neuropeptides that were quantified in all 3 severity conditions were probed. Located in the eyestalks of the crab, the SG is a neuroendocrine organ close to the brain (i.e., the central nervous system) and is known to secrete peptide hormones or neuropeptides involved in blood glucose levels and hydro-mineral balance.42, 43 Compared to the other tissues in this study, the SG’s changes appear muted, as shown in Figure S1. Most of the neuropeptides identified in the SG show no differences compared to a control, except for in the most extreme severity of hypoxia (1 ppm O2), including orcokinins NFDEIDRGFG (m/z 1256.554) and NFDEIDRSGFGFA (m/z 1474.660). In fact, many neuropeptides show no significant changes in any of the three severities conditions evaluated, including proctolin RYLPT (m/z 649.367), RFamide GHRNFLRFamide (m/z 1045.580), and tachykinin YPSGFLGMRamide (m/z 1026.519) (Table S1). The only outlier to this trend is CPRP RSAEGLGRMamide (m/z 975.515), which displays significant changes for the severe (1ppm O2) and mild (5 ppm O2) hypoxia, but not the moderate (2 ppm O2) hypoxia condition. From the above results, it is clear that the mild (5 ppm O2) and moderate (2 ppm O2) hypoxia does not substantially affect the SG neuropeptidome within an hour of exposure. Even if a neuropeptide’s expression level is affected by the severe hypoxia (1 ppm O2) (Table S1), the dynamic range of the changes is relatively minimal compared to changes we observe in the brain (Table S2) and PO (Table S3). Interestingly, HL/IGSL/IYRamide (m/z 844.479) only shows significant changes in the SG at severe hypoxia, thus this neuropeptide likely plays a distinct role in how the SG handles hypoxia stress compared to the brain and PO, suggesting tissue-specific response of this peptide.
Likely due to its central regulatory role in the nervous system, the brain has the most dramatic changes when increasing the hypoxic severity (Figure 2, Table S2).43 Very few neuropeptides, one example being CPRP LSSSNSPSSTPLG (m/z 1233.596), show a trend towards increased expression due to increasing hypoxic severity, regardless of the degree of severity. However, the most distinct and interesting trend is no change at 5 ppm O2, a significant increase at 2 ppm O2, and either no change or significant decrease at 1 ppm O2. This trend has been observed across several neuropeptide families, such as AST-A PRNYAFGLamide (m/z 936.505), RFamide NRNFLRFamide (m/z 965.543), and tachykinin YPSGFLGMRamide (m/z 1026.519). It appears that, between 2 ppm and 5 ppm O2, there may be a survival mechanism “switching” point. This is consistent with what has been observed during the actual stress exposure, as a physical difference between the behaviors of the crustaceans under the exposure of 1 ppm O2 and 5 ppm/2 ppm O2 was noted, where the latter groups are more active. This trend is not readily found in the literature, although vasopressin (a neuropeptide transmitter) has been found to have different mechanisms depending upon the strength of the external stimulus.44 Beyond the significant changes, it is interesting to see that two neuropeptide families, tachykinins and RFamides, show little change compared to a control in any hypoxia severity (Table S2). Both of these families have human neuropeptide homologs (SP and NPY, respectively) that have been previously implicated in mammalian hypoxia stress.23–26, 45–47 The lack of detection of statistically significant differences in these molecules in response to hypoxia stress could be due to (a) biological variability and/or (b) instrumental sensitivity. Further experiments to target these neuropeptidomic families will be a priority.
Figure 2.

Bar graphs that represent the dynamic neuropeptide changes due to severe (1 ppm O2, purple, n=7), moderate (2 ppm O2, blue, n=5), and mild (5 ppm O2, green, n=5) hypoxia exposure for 1 hour in the brain. The x-axis shows the neuropeptides’ sequences, while the y-axis represents the log-base 10 of the ratio of hypoxia-stressed divided by control. A log-base 10 ratio close to 0 indicates no change in neuropeptides for that hypoxia condition compared to the control. Neuropeptides that are deemed significant (p<0.05) in their change are indicated with an asterisk (*). The error bars represent standard error of the mean (SEM). Exact ratios can be found in Table S2. AST-A: Allatostatin A-type; AST-B: Allatostatin B-type; CPRP: CHH Precursor Related Peptide.
In contrast to the SG and brain, the PO tissue is in direct contact with the heart, meaning all secretions can have a direct impact on the animal’s reaction to stress by modulating the frequency or amplitude of heart contractions.43, 48 In general, similar trends occur in this tissue as what has been previously discussed in the SG and brain, as demonstrated in Figure 3 and Table S3. We still see the survival mechanism “switching” as seen in the brain (Figure 2), where the 2 ppm O2 severity condition has led to the most dramatic, significant changes in neuropeptidome content. In contrast, some neuropeptides show constant downregulation (allatotropin GFKNVEMMTARGFamide (m/z 1486.729)) or upregulation (CPRP LSSSNSPSSTPLG (m/z 1233.596)) due to all severities of hypxoia. Neuropeptides that show this pattern of expression regardless of the hypoxic severity level could be a part of a “flight or fight” response. Another similar trend involves cases where only the severe hypoxia (1 ppm O2) level results in significant changes in expression (CPRP GFLSQDVHS (m/z 989.469)). While it seems that the PO may not be as influenced by hypoxia as the brain, the PO plays a distinct role in how the blue crab handles hypoxia stress.
Figure 3.

Bar graphs that represent the dynamic neuropeptide changes due to severe (1 ppm O2, purple, n=7), moderate (2 ppm O2, blue, n=5), and mild (5 ppm O2, green, n=5) hypoxic condition for 1 hour in the PO. The x-axis shows the neuropeptides’ sequences, while the y-axis represents the log-base 10 of the ratio of hypoxia-stressed divided by control. A log-base 10 ratio close to 0 indicates no change in neuropeptides for that hypoxia condition compared to the control. Neuropeptides that are deemed significant (p<0.05) in their changes are indicated with an asterisk (*). The error bars represent standard error of the mean (SEM). Exact ratios can be found in Table S3. AST-A: Allatostatin A-type; AST-B: Allatostatin B-type; CPRP: CHH Precursor Related Peptide.
Whole System Trends
Across the three tissues studied, several neuropeptides are unique to one tissue but there are also many that overlapped across tissues, as shown in Figure 4. The brain (i.e., part of the central nervous system) contain the fewest unique neuropeptides compared to the SG and PO (i.e., part of the neuroendocrine system). The most interesting neuropeptides lie in the center, and trends for three select neuropeptides found in multiple tissues are illustrated in Figure 5.
Figure 5.

Line graphs showing the variable changes between the same neuropeptide in the SG (pink), brain (orange) and PO (yellow). (a) Allatostatin A-type NPYSFGLamide (m/z 796.399). (d) Orcokinin NFDEIDRSSFGF (m/z 1433.633). (c) CPRP LSSSNSPSSTPLG (m/z 1233.596). Neuropeptides that are deemed significant (p<0.05) in their changes are indicated with an asterisk (*). All points in this graph have at least 3 biological replicates for each condition (1 ppm O2, 1 hour: n=7; 2 ppm O2, 1 hour: n=5; 5 ppm O2, 1 hour: n=5) unless marked with an “X”. Those points marked with an “X” were only observed in 2 biological replicates. SG: Sinus Glad; PO: Pericardial Organ.
In Figure 5a, AST-A NPYSFGLamide (m/z 796.399) shows no change due to 5 ppm O2hypoxia compared to the control for the tissues examined in this study (brain, PO, and SG). In the brain, as the severity is decreased, NPYSFGLamide levels initially increase (1 ppm to 2 ppm O2; ratio = 0.047 to 3.742, respectively) but then decrease (2 ppm to 5 ppm O2; ratio = 3.742 to 1.025, respectively). Although we cannot comment on the statistical significance of these trends, there are similar trends that we observe in the brain for other neuropeptides (e.g., allatostatin B-type). This trend in the brain has no observable consistency with trends from the PO tissue, which shows an increase in neuropeptide expression that is capped at a ratio = ~2.5 as severity decreases, and the SG, which shows no change even as the O2 saturation is lowered. AST-A neuropeptides are known to be localized throughout the crustacean nervous system which includes neuroendocrine organs and synapses, suggesting that they work both locally and as long-distance hormones.36 Their function is also well-defined as inhibitory neuro/myo-modulators, in particular targeting the cardiac neuromuscular system and the stomatogastric nervous systems (STNS).36 While we have not studied tissues within either of these systems, NPYSFGLamide could be indirectly affecting them by targeting the PO, which is in direct contact with the heart, and the brain, which is connected to the STNS.
Similarly, orcokinins are located throughout the crustacean nervous system and can act locally and from long distances.36 While they are involved in modulating the STNS, they also have known roles in increasing frequency and amplitude of spontaneous hindgut contraction.36 In Figure 5b, orcokinin NFDEIDRSSFA (m/z 1433.633) seems to show the same trend across all tissue types besides the PO. Several other orcokinins are found in all three tissues, including NFDEIDRSSFGF (m/z 1300.580), NFDEIDRSSFGFA (m/z 1504.670), and NFDEIDRSSFGFN (m/z 1547.676), all of which have variable responses to hypoxia stress. In fact, NFDEIDRSSFGFN shows no changes due to hypoxia stress in any tissue. This is an example of the diverse and distinct roles that neuropeptide isoforms from the same family have within the crustacean nervous system.
Finally, when looking at CPRP LSSSNSPSSTPLG (m/z 1233.596) (Figure 5c), the brain once again exhibits interesting trends, where the neuropeptide level increases due to low severity conditions (5 ppm O2) (ratio = 12.745) and decreases as hypoxia severity is increased (ratio = 4.684 and 2.431 for 2ppm and 1 ppm O2, respectively). In general, this trend is also seen in peptides from the SG tissue, as shown in Figure 5, although we cannot comment on statistically significant changes from the SG in this figure. Additionally, this peptide in the PO shows no difference in response regardless of hypoxic severity (ratio = ~4.5). CPRPs are co-released with CHH, an important neuropeptide that regulates glucose metabolism in the crustaceans.36 Until recently27, in the literature, CHH is the only neuropeptide that has been implicated to mediate hypoxia stress in blue crabs, where CHH levels in the hemolymph increases in response to hypoxia stress.12 This could also imply an increase in CPRPs. In our studies, the magnitude of CPRP upregulation decreased in all tissues as the hypoxic severity is elevated. This decrease of CPRP levels in tissues could indicate their release into the hemolymph, matching well with previous literature, although all the CPRP levels are still higher than those in a control crab. Thus, we may be seeing a buildup phase prior to the release of the CHH/CPRPs into the hemolymph. One thing to note is that the different isoforms of CHH are known to be produced in the PO and the SG, so it is interesting that we see the most variable response in the brain.36, 49 It could indicate that the brain is a target of these CPRPs that are being produced elsewhere or that are already circulating. This result aligns well with the fact that we see the most dynamic neuropeptidomic changes overall in the brain (Table S2) compared to the SG (Table S1) and PO (Table S3).
Condition-Specific Neuropeptidomic Regulation
Although our initial focus was on neuropeptides that were quantified in all conditions, interestingly, there are several exceptions. Within the duplex reductive dimethylation quantitation scheme, to be quantified, it is required that both the light- and heavy-labeled peptides be identified. Thus, for spots that are “blacked out” in Tables S1-S3, meaning that no quantifiable data was collected for that condition, the instrument was unable to detect signal for the peptide from either the control or stressed condition. We know that a particular neuropeptide was present in a control crustacean if the neuropeptide was able to be quantified in at least one hypoxic severity condition. Although each condition had its own control, for the sake of this discussion, we will assume that any condition that was unable to be quantified was due to the lack of signal from the stressed condition. If we consider neuropeptides that were only quantified in the moderate (2 ppm O2) condition, specifically, in the SG, we now see data reminiscent of the “switch” observed in the brain. This is true for 3 AST-A neuropeptides, AST Combo DPYAFGLGKRPADL (m/z 1519.790), CPRP RSAQGLGKM(O)ERL (m/z 1361.732), 3 RFamide peptides, RYamide SGFYADRYamide (m/z 977.448), and tackykinin APSGFLGMRG (m/z 992.498). This evidence leads us to believe that this “switch” is not tissue dependent, which is further corroborated with the fact that the PO contains 10 peptides that only contain significant changes at the moderate (2 ppm O2). Although this trend seems most apparent in the brain, all other discussed trends are still evident in all the studied tissues.
As expected from a previous study27, there are several neuropeptides that are not present in all severity conditions. Beyond neuropeptides that are only present at the moderate severity condition, we see some neuropeptides, mainly in the RFamides, allatostatins, RYamide, and tachykinin families, in all 3 tissues that are missing primarily in the most severe (1 ppm O2) condition. This is unexpected, as RFamides and tachykinin, for example, are homologous to neuropeptides known to have a role in the mammalian hypoxia stress response (i.e., NPY and SP, respectively). Other trends include (1) the neuropeptide is only present during the most mild hypoxia condition (5 ppm O2) or (2) the neuropeptide is only present during the most severe condition (1 ppm O2), even if changes are not significant. Overall, these results boast the importance of global studies, as there is likely more than one mechanism occurring; although, to follow up, complementary studies employing orthogonal approaches are important to confirm our observations.
Conclusions and Future Directions
It is clear that neuropeptides play a dynamic role in how crustaceans, specifically C. sapidus, survive hypoxia stress, and even neuropeptides from different tissues appear to have distinct functions in the animal’s ability to handle this stress. It is suggested that between 2 ppm and 1 ppm O2, there is a “switch” that occurs in neuropeptide expression, and this “switch” corresponds with defensive behaviors that both we and previous researchers observed. The brain (i.e., the central nervous system) provides the strongest evidence of this assumption, although it will require studying additional hypoxia severity levels to quantitatively determine the exact level of hypoxia at which this occurs. Until we have more research into the functionality of each of these neuropeptides, it is difficult to conclude how the crustaceans are being affected by the hypoxic environment. Although, with hypoxia being well-documented in mammalian biology (i.e., NPY and SP), results from homologous neuropeptides (i.e., RFamides and tachykinin, respectively) can be used to complement and develop new studies on how different levels of hypoxia can influence cardiovascular health, for example.
Studies involving how the duration of exposure affects crustacean neuropeptides in these tissues have been recently published,27 but future studies in process include (a) exploring neuropeptidomic changes in hemolymph and (b) a top-down MS approach to quantify changes in CHH and other CPRPs. Furthermore, not explored here, post-translational modifications (PTMs), including glycosylation, impact the functionality of neuropeptides. These aspects are currently being explored by our lab50, 51 and will be further explored in the context of hypoxia. Finally, to probe the specific roles of some of these neuropeptides, especially in the context of the “switch” occurring, electrophysiology studies will be performed in the future.
Materials and Methods
Methanol (MeOH), glacial acetic acid (GAA), ammonium bicarbonate, and all crab saline components (see below) were purchased from Fisher Scientific (Pittsburgh, PA). H2-formaldehyde, 2H2-formaldehyde, and borane pyridine were acquired from Sigma-Aldrich (St. Louis, MO). 2, 5-dihydroxybenzoic acid (DHB) was obtained from Acros Organics (Morris, New Jersey), while formic acid (FA) was purchased through Fluka (Mexico City, Mexico). All water (H2O) used in this study was doubly distilled on a Millipore filtration system (Burlington, MA) or Fisher HPLC grade (Pittsburgh, PA), and C18 Ziptips were purchased from Millipore (Burlington, MA). All aquarium supplies were obtained from local pet stores or publicly available, pet-centric online vendors.
Animals, Tank Set Up, and Stress Experiments
Due to working with invertebrates, no institutional approval is required, but all experiments were performed in accordance with all national or local guidelines and regulations. In this study, ten-gallon tanks filled with artificial seawater (made with Instant Ocean Sea Salt) were made to be 35 parts per thousand (ppt) (confirmed with a hydrometer), pH=~8.3, 17–18 °C, and 8–10 ppm dissolved O2 (~80–100% O2 water saturation). Before crabs were placed in the tanks, the water quality (i.e., ammonia, nitrates, nitrites, and pH) were all confirmed or adjusted into healthy levels using commercially available reagents (i.e., Seachem Prime). Female blue crabs, Callinectes sapidus, were either purchased from Midway Asian Market (Madison, WI) or LA Crawfish Company (Natchitoches, LA) between March 2013 and March 2018. After transport, crabs were allowed to recover for several days prior to being exposed to hypoxia. For stress experiments, the tank was sparged with nitrogen (N2) gas for 30–40 minutes to bring the dissolved O2 down to the desired level as measured by a Pinpoint II Oxygen Monitor, which was calibrated prior to each experiment. The levels of interest included severe hypoxia (1 ppm, ~10% O2 water saturation, n=7), moderate hypoxia (2 ppm, ~20% O2 water saturation, n=5), and mild hypoxia (5 ppm, ~50% O2 water saturation, n=5). A plastic tarp was placed on top of the water’s surface to minimize water-air oxygen exchange during the experiment. A crab was then placed in the tank to allow hypoxia exposure for 1 hour. Next, the crab was anesthetized on ice for 20 minutes and sacrificed as previously described.52 Then, the tissues of interest (an SG pair, the brain, and then an PO pair) were removed, submerged in acidified MeOH (90:9:1 MeOH:H2O:GAA; volume (v):v:v)), and stored at −80 °C until needed. All dissections were performed in chilled (approximately 10 °C) physiological saline (composition: 440 mM NaCl; 11 mM KCl; 13 mM CaCl2; 26 mM MgCl2; 10 mM Trizma acid; pH 7.4 (adjusted with NaOH)).
Sample Preparation
For each sample, tissues from 3 crabs were pooled together and extracted with a manual homogenizer with chilled acidified MeOH (90:9:1 MeOH:H2O:GAA; v:v:v). The sample was centrifuged at 13,200 rotations per minute (rpm) for 10 minutes, and the supernatant was collected. The resulting pellet was re-extracted twice with the supernatant collected each time. The combined supernatant fractions were dried down in a Savant SCV100 Speedvac concentrator. All crude extracts were purified using C18 ZipTips following the manufacturer’s protocol; samples were centrifuged at 13,200 rpm prior to purification to pellet any particulates. Control and hypoxia-exposed samples were then differentially labeled using duplex reductive dimethylation following a previously published protocol.20, 21, 53 All control samples were labeled with H2-formaldehyde (+28.0313 Daltons (Da)), while all hypoxia-exposed (stress) samples were labeled with 2H2-formaldehyde (+32.0564 Da). Borane pyridine was used as the reducing agent, and ammonium bicarbonate was used to quench the reaction. After labeling, control and experimental samples were mixed at a 1:1 (v:v) ratio and dried down prior to analysis.
MS Data Collection and Analysis
Samples were redissolved at one tissue set (exposed/control) per 5 μL (i.e., 15 μL for 3 pooled tissue), spotted 1:1 with 150 mg/mL DHB (in 50:50 MeOH:H2O with 0.1% FA) in triplicate, and analyzed in the m/z 500–2000 range at a resolution of 60,000 on the Thermo Scientific MALDI-LTQ-Orbitrap XL. The peak list was exported from Thermo Xcalibur software, and a program written in Java was used to find neuropeptides in the peak list by accurate mass matching to full length peptides within a ±5 ppm error to a custom, in-house crustacean neuropeptide database (containing 766 neuropeptides, found in Supplemental Information) with an intensity threshold cutoff of 100. The database was generated through (1) de novo sequencing of MS data, (2) transcriptomics mining, and (3) homology analysis of neuropeptide-rich tissues from multiple crustacean species; some representative references provided here.54, 55 If both light- and heavy-labeled peaks were found, a peak ratio was calculated by dividing the intensity of the heavy peak by that of the light peak. A peak ratio of “1.0” means no change in abundance between the stressed sample and a control. A student’s two-tailed t-test was used to determine statistical significance of the results. Only those neuropeptides found in at least 2 out of 3 technical replicates and in at least 3 biological replicates were analyzed for statistical differences. A p-value<0.05 was said to be significant. More details on the data collection and analysis can be found in Table S4.
To verify neuropeptides identified by MALDI-MS, a representative subset of samples (27 out of 51 total samples) were chosen for ESI-MS/MS analysis. Prior to MALDI-MS analysis, 5 μL of sample was removed and further purified using C18 ZipTips with the same protocol described above, dried down, and redissolved in 10 μL of 0.1% FA in H2O. These samples were then analyzed using a Waters NanoAcquity LC in line with a Thermo Scientific Q-Exactive (QE) MS. Samples were injected in triplicate onto a homemade C18 column (14–16 cm), from which the analytes were eluted using a 90-minute gradient (10% B to 35% B) with H2O (0.1% FA) (Solvent A) and ACN (0.1% FA) (Solvent B) and analyzed by the QE in a mass range of m/z 200–2000 with a top 15 data-dependent acquisition method with high-energy collision dissociation (HCD). MS and MS/MS spectra were collected at a 70,000 and 17,500 mass resolution, respectively. ESI-MS raw data were imported into PEAKS X+ software for de novo sequencing and database matching. Database search results were filtered using a 1% false discovery rate and neuropeptides that were identified in at least 1 biological replicate were exported. These identified neuropeptides (truncated and full length) were cross compared to the MALDI-MS identified peptides. More details on the data collection and analysis can be found in Table S5 and S6. Neuropeptide identities that were confirmed by ESI-MS/MS are marked in Tables S1-S3.
Supplementary Material
Funding Sources
This work was supported by a National Science Foundation grant (CHE-1710140) and the National Institutes of Health (NIH) through grant 1R01DK071801. The MALDI-Orbitrap instrument was purchased through the support of an NIH shared instrument grant (NIH-NCRR S10RR029531). A.R.B. was funded through the NIH in the form of a General Medical Sciences NRSA Fellowship 1F31GM119365. K.D. acknowledges a predoctoral fellowship supported by the National Institutes of Health-General Medical Sciences F31 National Research Service Award (1F31GM126870-01A1) for funding. N.Q.V. is funded through a Biotechnology Training Program predoctoral traineeship sponsored by the National Institute of General Medical Sciences of the NIH under Award Number T32GM008349 and a predoctoral traineeship from T32 HL 007936 training grant from the National Heart Lung and Blood Institute to the University of Wisconsin-Madison Cardiovascular Research Center. LL acknowledges a Vilas Distinguished Achievement Professorship and Charles Melbourne Johnson Professorship with funding provided by the Wisconsin Alumni Research Foundation and University of Wisconsin-Madison School of Pharmacy.
Abbreviations
- O2
Oxygen
- NPY
Neuropeptide Y
- SP
Substance P
- CHH
Crustacean Hyperglycemic Hormone
- CCAP
Crustacean Cardioactive Peptide
- ESI
Electrospray Ionization
- MALDI
Matrix-assisted Laser Desorption Ionization
- MS
Mass Spectrometry/Spectrometer
- SG
Sinus Gland
- PO
Pericardial Organ
- m/z
Mass-to-charge Ratio
- MS/MS
Tandem MS
- LC
Liquid Chromatography/Chromatograph
- CPRP
CHH Precursor Related Peptide
- AST-A
Allatostatin A-type
- STNS
Stomatogastric Nervous System
- PTMs
Post-translational Modifications
- MeOH
Methanol
- GAA
Glacial Acetic Acid
- DHB
β-dihydroxybenzoic Acid
- FA
Formic Acid
- H2O
Water
- ppt
Parts Per Thousand
- v
Volume
- rpm
Rotations Per Minute
- Da
Daltons
- QE
Q Exactive
- HCD
High-energy Collision Dissociation
Footnotes
Conflict of Interest
The authors declare no competing financial interest.
- FASTA (.FASTA): In-house crustacean database FASTA used to search data in manuscript.
References
- [1].Diaz RJ, and Rosenberg R (1995) Marine benthic hypoxia: A review of its ecological effects and the behavioural responses of benthic macrofauna, Oceanogr. Mar. Bio 33, 245–303. [Google Scholar]
- [2].Gray JS, Wu RSS, and Or YY (2002) Effects of hypoxia and organic enrichment on the coastal marine environment, Mar. Ecol.: Prog. Ser 238, 249–279. [Google Scholar]
- [3].Santana R, Lessa GC, Haskins J, and Wasson K (2018) Continuous Monitoring Reveals Drivers of Dissolved Oxygen Variability in a Small California Estuary, Estuaries Coasts 41, 99–113. [Google Scholar]
- [4].Neilan RM, and Rose K (2014) Simulating the effects of fluctuating dissolved oxygen on growth, reproduction, and survival of fish and shrimp, J. Theor. Biol 343, 54–68. [DOI] [PubMed] [Google Scholar]
- [5].Landry CA, Steele SL, Manning S, and Cheek AO (2007) Long term hypoxia suppresses reproductive capacity in the estuarine fish, Fundulus grandis, Comp. Biochem. Physiol., Part A: Mol. Integr. Physiol 148, 317–323. [DOI] [PubMed] [Google Scholar]
- [6].Tanner CA, Burnett LE, and Burnett KG (2006) The effects of hypoxia and pH on phenoloxidase activity in the Atlantic blue crab, Callinectes sapidus, Comp. Biochem. Physiol., Part A: Mol. Integr. Physiol 144, 218–223. [DOI] [PubMed] [Google Scholar]
- [7].Stover KK, Burnett KG, McElroy EJ, and Burnett LE (2013) Locomotory Fatigue During Moderate and Severe Hypoxia and Hypercapnia in the Atlantic Blue Crab, Callinectes sapidus, Bio. Bull 224, 68–78. [DOI] [PubMed] [Google Scholar]
- [8].Brouwer M, Larkin P, Brown-Peterson N, King C, Manning S, and Denslow N (2004) Effects of hypoxia on gene and protein expression in the blue crab, Callinectes sapidus, Mar. Environ. Res 58, 787–792. [DOI] [PubMed] [Google Scholar]
- [9].Bell GW, Eggleston DB, and Noga EJ (2009) Environmental and Physiological Controls of Blue Crab Avoidance Behavior During Exposure to Hypoxia, Bio. Bull 217, 161–172. [DOI] [PubMed] [Google Scholar]
- [10].Bell GW, Eggleston DB, and Noga EJ (2010) Molecular keys unlock the mysteries of variable survival responses of blue crabs to hypoxia, Oecologia 163, 57–68. [DOI] [PubMed] [Google Scholar]
- [11].Hardy KM, Follett CR, Burnett LE, and Lema SC (2012) Gene transcripts encoding hypoxia-inducible factor (HIF) exhibit tissue- and muscle fiber type-dependent responses to hypoxia and hypercapnic hypoxia in the Atlantic blue crab, Callinectes sapidus, Comp. Biochem. Physiol., Part A: Mol. Integr. Physiol 163, 137–146. [DOI] [PubMed] [Google Scholar]
- [12].Chung JS, and Zmora N (2008) Functional studies of crustacean hyperglycemic hormones (CHHs) of the blue crab, Callinectes sapidus - the expression and release of CHH in eyestalk and pericardial organ in response to environmental stress, FEBS J. 275, 693–704. [DOI] [PubMed] [Google Scholar]
- [13].Webster SG (1996) Measurement of crustacean hyperglycaemic hormone levels in the edible crab Cancer pagurus during emersion stress, J. Exp. Biol 199, 1579–1585. [DOI] [PubMed] [Google Scholar]
- [14].Duszczyk M, Gamdzyk M, Ziembowicz A, Boguszewski PM, Lazarewicz JW, and Salinska E (2015) Antidepressant-like and anxiolytic-like effects of mild hypobaric hypoxia in mice: possible involvement of neuropeptide Y, Acta Neurobiol. Exp 75, 364–371. [PubMed] [Google Scholar]
- [15].Whailova A, Karaszewski B, Faergestad EM, Hauser R, Nyka WM, Lundanes E, and Greibrokk T (2008) Two-dimensional LC-MS/MS in detection of peptides in hypothalamus of the rat subjected to hypoxic stress, J. Sep. Sci 31, 468–479. [DOI] [PubMed] [Google Scholar]
- [16].Duszczyk M, Ziembowicz A, Gadamski R, Wieronska JM, Smialowska M, and Lazarewicz JW (2009) Changes in the NPY immunoreactivity in gerbil hippocampus after hypoxic and ischemic preconditioning, Neuropeptides 43, 31–39. [DOI] [PubMed] [Google Scholar]
- [17].Kusakabe T, Hayashida Y, Matsuda H, Gono Y, Powell FL, Ellisman MH, Kawakami T, and Takenaka T (1998) Hypoxic adaptation of the peptidergic innervation in the rat carotid body, Brain Res. 806, 165–174. [DOI] [PubMed] [Google Scholar]
- [18].Sharma SD, Raghuraman G, Lee MS, Prabhakar NR, and Kumar GK (2009) Intermittent hypoxia activates peptidylglycine alpha-amidating monooxygenase in rat brain stem via reactive oxygen species-mediated proteolytic processing, J. Appl. Physiol. (1985) 106, 12–19. [DOI] [PMC free article] [PubMed] [Google Scholar]
- [19].Schwarzer C, Sperk G, Rauca C, and Pohle W (1996) Neuropeptide Y and somatostatin immunoreactivity in the rat hippocampus after moderate hypoxia, Naunyn-Schmiedeberg’s Arch. Pharmacol 354, 67–71. [DOI] [PubMed] [Google Scholar]
- [20].Chen RB, Xiao MM, Buchberger A, and Li LJ (2014) Quantitative Neuropeptidomics Study of the Effects of Temperature Change in the Crab Cancer borealis, J. Proteome Res 13, 5767–5776. [DOI] [PMC free article] [PubMed] [Google Scholar]
- [21].Zhang Y, Buchberger A, Muthuvel G, and Li L (2015) Expression and distribution of neuropeptides in the nervous system of the crab Carcinus maenas and their roles in environmental stress, Proteomics 15, 3969–3979. [DOI] [PMC free article] [PubMed] [Google Scholar]
- [22].Satake H, Kawada T, Nomoto K, and Minakata H (2003) Insight into tachykinin-related peptides, their receptors, and invertebrate tachykinins: a review, Zoolog Sci 20, 533–549. [DOI] [PubMed] [Google Scholar]
- [23].Husson SJ, Mertens I, Janssen T, Lindemans M, and Schoofs L (2007) Neuropeptidergic signaling in the nematode Caenorhabditis elegans, Prog. Neurobiol 82, 33–55. [DOI] [PubMed] [Google Scholar]
- [24].Dockray GJ (2004) The expanding family of -RFamide peptides and their effects on feeding behaviour, Exp. Physiol 89, 229–235. [DOI] [PubMed] [Google Scholar]
- [25].Coast GM, and Schooley DA (2011) Toward a consensus nomenclature for insect neuropeptides and peptide hormones, Peptides 32, 620–631. [DOI] [PubMed] [Google Scholar]
- [26].Poncet L, Denoroy L, Dalmaz Y, Pequignot JM, and Jouvet M (1996) Alteration in central and peripheral substance P- and neuropeptide Y-like immunoreactivity after chronic hypoxia in the rat, Brain Res. 733, 64–72. [DOI] [PubMed] [Google Scholar]
- [27].Buchberger AR, Sauer CS, Vu NQ, DeLaney K, and Li LJ (2020) Temporal Study of the Perturbation of Crustacean Neuropeptides Due to Severe Hypoxia Using 4-Plex Reductive Dimethylation, J. Proteome Res 19, 1548–1555. [DOI] [PMC free article] [PubMed] [Google Scholar]
- [28].Shan DY, Fu HT, Qiao H, Sun SM, Zhang WY, Jin SB, Jiang SF, Gong YS, Xiong YW, and Wu Y (2018) Molecular Cloning, Characterization, and Expression of Crustacean Cardioactive Peptide in Oriental River Prawn, Macrobrachium nipponense, during Acute Hypoxia and Reoxygenation, J. World Aquacult. Soc 49, 356–365. [Google Scholar]
- [29].Hui M, Song CW, Liu Y, Li CL, and Cui ZX (2017) Exploring the molecular basis of adaptive evolution in hydrothermal vent crab Austinograea alayseae by transcriptome analysis, PLoS One 12, 17. [DOI] [PMC free article] [PubMed] [Google Scholar]
- [30].Mosco A, Pegoraro S, Giulianini PG, and Edomi P (2013) CLONING OF THE CRUSTACEAN HYPERGLYCEMIC HORMONE GENE PROMOTER OF ASTACUS LEPTODACTYLUS, J. Crustacean Biol 33, 56–61. [Google Scholar]
- [31].Chung JS, and Webster SG (2005) Dynamics of in vivo release of molt-inhibiting hormone and crustacean hyperglycemic hormone in the shore crab, Carcinus maenas, Endocrinology 146, 5545–5551. [DOI] [PubMed] [Google Scholar]
- [32].Chang AJ, and Bargmann CI (2008) Hypoxia and the HIF-1 transcriptional pathway reorganize a neuronal circuit for oxygen-dependent behavior in Caenorhabditis elegans, Proc. Natl. Acad. Sci. U. S. A 105, 7321–7326. [DOI] [PMC free article] [PubMed] [Google Scholar]
- [33].Buchberger A, Yu Q, and Li L (2015) Advances in Mass Spectrometric Tools for Probing Neuropeptides, Annu. Rev. Anal. Chem 8, 485–509. [DOI] [PMC free article] [PubMed] [Google Scholar]
- [34].DeLaney K, Buchberger AR, Atkinson L, Grunder S, Mousley A, and Li LJ (2018) New techniques, applications and perspectives in neuropeptide research, J. Exp. Biol 221. [DOI] [PMC free article] [PubMed] [Google Scholar]
- [35].Romanova EV, and Sweedler JV (2015) Peptidomics for the discovery and characterization of neuropeptides and hormones, Trends Pharmacol. Sci 36, 579–586. [DOI] [PMC free article] [PubMed] [Google Scholar]
- [36].Christie AE, Stemmler EA, and Dickinson PS (2010) Crustacean neuropeptides, Cell. Mol. Life. Sci 67, 4135–4169. [DOI] [PMC free article] [PubMed] [Google Scholar]
- [37].Van Eeckhaut A, Maes K, Aourz N, Smolders I, and Michotte Y (2011) The absolute quantification of endogenous levels of brain neuropeptides in vivo using LC-MS/MS, Bioanalysis 3, 1271–1285. [DOI] [PubMed] [Google Scholar]
- [38].Chen RB, Hui LM, Cape SS, Wang JH, and Li LJ (2010) Comparative Neuropeptidomic Analysis of Food Intake via a Multifaceted Mass Spectrometric Approach, ACS Chem. Neurosci 1, 204–214. [DOI] [PMC free article] [PubMed] [Google Scholar]
- [39].Liu Y, Buchberger AR, DeLaney K, Li Z, and Li L (2019) Multifaceted Mass Spectrometric Investigation of Neuropeptide Changes in Atlantic Blue Crab, Callinectes sapidus, in Response to Low pH Stress, J. Proteome Res 18, 2759–2770. [DOI] [PMC free article] [PubMed] [Google Scholar]
- [40].Nadler WM, Waidelich D, Kerner A, Hanke S, Berg R, Trumpp A, and Rösli C (2017) MALDI versus ESI: The Impact of the Ion Source on Peptide Identification, J. Proteome Res 16, 1207–1215. [DOI] [PubMed] [Google Scholar]
- [41].DeLaneya K, and Li LJ (2020) Capillary electrophoresis coupled to MALDI mass spectrometry imaging with large volume sample stacking injection for improved coverage of C. borealis neuropeptidome, Analyst 145, 61–69. [DOI] [PMC free article] [PubMed] [Google Scholar]
- [42].Fu Q, Goy MF, and Li LJ (2005) Identification of neuropeptides from the decapod crustacean sinus glands using nanoscale liquid chromatography tandem mass spectrometry, Biochem. Biophys. Res. Commun 337, 765–778. [DOI] [PubMed] [Google Scholar]
- [43].Hopkins PM (2012) The eyes have it: A brief history of crustacean neuroendocrinology, Gen. Comp. Endocrinol 175, 357–366. [DOI] [PubMed] [Google Scholar]
- [44].Smith DW, Sibbald JR, Khanna S, and Day TA (1995) RAT VASOPRESSIN CELL RESPONSES TO SIMULATED HEMORRHAGE - STIMULUS-DEPENDENT ROLE FOR A1 NORADRENERGIC NEURONS, Am. J. Physiol.-Regulatory Integrative and Comparative Physiology 268, R1336–R1342. [DOI] [PubMed] [Google Scholar]
- [45].Wang ZZ, Dinger B, Fidone SJ, and Stensaas LJ (1998) Changes in tyrosine hydroxylase and substance P immunoreactivity in the cat carotid body following chronic hypoxia and denervation, Neuroscience 83, 1273–1281. [DOI] [PubMed] [Google Scholar]
- [46].Lee EW, Michalkiewicz M, Kitlinska J, Kalezic I, Switalska H, Yoo P, Sangkharat A, Ji H, Li LJ, Michalkiewicz T, Ljubisavljevic M, Johansson H, Grant DS, and Zukowska Z (2003) Neuropeptide Y induces ischemic angiogenesis and restores fimction of ischemic skeletal muscles, J. of Clin. Invest 111, 1853–1862. [DOI] [PMC free article] [PubMed] [Google Scholar]
- [47].Moss IR, and Laferriere A (2002) Central neuropeptide systems and respiratory control during development, Respiratory Physiol. Neurobiol 131, 15–27. [DOI] [PubMed] [Google Scholar]
- [48].Stangier J, Hilbich C, Beyreuther K, and Keller R (1987) UNUSUAL CARDIOACTIVE PEPTIDE (CCAP) FROM PERICARDIAL ORGANS OF THE SHORE CRAB CARCINUS-MAENAS, Proc. Natl. Acad. Sci. U. S. A 84, 575–579. [DOI] [PMC free article] [PubMed] [Google Scholar]
- [49].Webster SG, Keller R, and Dircksen H (2012) The CHH-superfamily of multifunctional peptide hormones controlling crustacean metabolism, osmoregulation, moulting, and reproduction, Gen. Comp. Endocrinol 175, 217–233. [DOI] [PubMed] [Google Scholar]
- [50].Cao QJW, Yu Q, Liu Y, Chen ZW, and Li LJ (2020) Signature-Ion-Triggered Mass Spectrometry Approach Enabled Discovery of N- and O-Linked Glycosylated Neuropeptides in the Crustacean Nervous System, J. of Proteome Res 19, 634–643. [DOI] [PMC free article] [PubMed] [Google Scholar]
- [51].Liu Y, Cao QJW, and Li LJ (2019) Isolation and characterization of glycosylated neuropeptides, In Post-Translational Modifications That Modulate Enzyme Activity (Garcia BA, Ed.), pp 147–202, Academic Press Ltd-Elsevier Science Ltd, London. [Google Scholar]
- [52].Gutierrez GJ, and Grashow RG (2009) Cancer borealis stomatogastric nervous system dissection, J. Vis. Exp 25, 1207. [DOI] [PMC free article] [PubMed] [Google Scholar]
- [53].DeLaney K, Buchberger A, and Li L (2018) Identification, Quantitation, and Imaging of the Crustacean Peptidome, Methods Mol. Biol 1719, 247–269. [DOI] [PMC free article] [PubMed] [Google Scholar]
- [54].Jia CX, Lietz CB, Ye H, Hui LM, Yu Q, Yoo S, and Li LJ (2013) A multi-scale strategy for discovery of novel endogenous neuropeptides in the crustacean nervous system, J. Proteomics 91, 1–12. [DOI] [PMC free article] [PubMed] [Google Scholar]
- [55].Hui LM, Cunningham R, Zhang ZC, Cao WF, Jia CX, and Li LJ (2011) Discovery and Characterization of the Crustacean Hyperglycemic Hormone Precursor Related Peptides (CPRP) and Orcokinin Neuropeptides in the Sinus Glands of the Blue Crab Callinectes sapidus Using Multiple Tandem Mass Spectrometry Techniques, J. Proteome Res 10, 4219–4229. [DOI] [PMC free article] [PubMed] [Google Scholar]
Associated Data
This section collects any data citations, data availability statements, or supplementary materials included in this article.