

Abstract
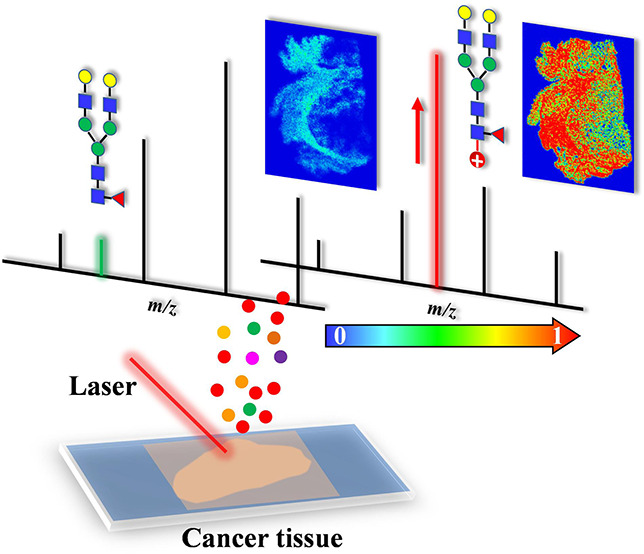
Glycosylation is a major protein post-translational modification whose dysregulation has been associated with many diseases. Herein, an on-tissue chemical derivatization strategy based on positively charged hydrazine reagent (Girard’s reagent P) coupled with matrix-assisted laser desorption/ionization mass spectrometry imaging (MALDI-MSI) was developed for analysis of N-glycans from FFPE treated tissue sections. The performance of the proposed approach was evaluated by analysis of monosaccharides, oligosaccharides, N-glycans released from glycoproteins, as well as MS imaging of N-glycans from human cancer tissue sections. The results demonstrated that the signal-to-noise ratios for target saccharides were notably improved after chemical derivatization, in which signals were enhanced by 230-fold for glucose and over 28-fold for maltooctaose. Improved glycome coverage was obtained for N-glycans derived from glycoproteins and tissue samples after chemical derivatization. Furthermore, on-tissue derivatization was applied for MALDI-MSI of N-glycans from human laryngeal cancer and ovarian cancer tissues. Differentially expressed N-glycans among the tumor region, adjacent normal tissue region, and tumor proximal collagen stroma region were imaged, revealing that high-mannose type N-glycans were predominantly expressed in the tumor region. Overall, our results indicate that the on-tissue labeling strategy coupled with MALDI-MSI shows great potential to spatially characterize N-glycan expression within heterogeneous tissue samples with enhanced sensitivity. This study provides a promising approach to better understand the pathogenesis of cancer related aberrant glycosylation, which is beneficial to the design of improved clinical diagnosis and therapeutic strategies.
Glycans are essential biomolecules involved in a variety of biological processes including protein folding, maintenance of cell or tissue structures, cell recognition, molecular signal transduction, cell–cell interactions, etc.1−3 Dysregulation of glycosylation is often associated with various pathophysiological processes such as cancer,4,5 Alzheimer’s disease,6 diabetes,7 and autoimmune diseases.8 Therefore, profiling disease-relevant glycans is of vital significance for better understanding of pathological mechanisms at the molecular level and development of new therapeutic approaches.
The past decade has seen the emergence of mass spectrometry (MS) as one of the most powerful tools for large-scale and in-depth glycan analysis in biological samples, owing to its excellent sensitivity and specificity.9−11 It is still challenging to perform direct MS profiling of glycans in complex biological samples due to the low abundance of glycans and severe ion suppression from other readily ionized compounds such as lipids, peptides, and proteins. The highly hydrophilic nature of glycans also leads to low signal intensities during MS detection. As a result, various glycan enrichment and separation approaches including capillary electrophoresis (CE),12 anion-exchange chromatography,13 reversed phase chromatography,14 hydrophilic interaction liquid chromatography (HILIC),15 graphitic carbon chromatography,16 lectin affinity chromatography (LAC),17 solid-phase extraction (SPE),18etc. have been intensively explored prior to MS detection, but the spatial distribution information on glycans is lost over the course of elaborate sample purification processes. Undoubtedly, spatial visualization of glycans at the molecular level is of increasing interest for identifying and localizing disease-relevant glycans as well as improving our understanding of their functions.
MALDI-MS is a powerful tool to detect a wide range of analytes at molecular level from various biological and clinical samples.19,20 In recent years, MALDI-MS imaging has been successfully employed for spatial visualization of N-glycans in various clinical tissue samples,21−24 even for in situ characterization of linkage-specific sialic acid-containing glycans in carcinoma tissues.25 Also, a novel subatmospheric pressure (SubAP)/MALDI source was developed for in situ imaging of N-glycans with improved spatial resolution.26 However, MALDI source presents limited sensitivity in detection of native glycans due to relatively high hydrophilicity of glycans, which poses significant challenges for sensitive detection and visualization of glycans from biological samples.
One approach to increasing detection sensitivity is to chemically derivatize glycans with strategies such as permethylation, reductive amination, Michael addition, and hydrazide labeling.11,27,28 For example, Ciucanu and Kerek introduced the basic permethylation derivatization protocol using methyl iodide under alkaline conditions,29 which is now a commonly applied labeling protocol for glycomic analysis. In comparison with underivatized counterparts, permethylated glycans generally produce higher MS signals. Recently, our group also developed a series of novel amine- or carbonyl-reactive isobaric tags for improved sensitivity, better quantification, and higher throughput in glycan analysis.30−33 It is noted that positively charged hydrazine reagents including Girard’s reagent T,34 Girard’s reagent P,35 and their analogues36,37 have been employed to improve MS sensitivity for glycans by introducing a permanent cationic site to the glycan molecules.38−40 Nevertheless, these chemical derivatization methods are usually carried out in bulk solutions in which reactions occur under relatively strong basic, acidic, or high temperature conditions. Furthermore, tedious cleanup procedures are often necessary to remove excess salts and labeling reagents after derivatization. Consequently, few of these bulk-solution based derivatization approaches are compatible with MALDI-MS imaging methodology for acquiring the spatial distribution information on glycans from tissues. Recently, on-tissue chemical derivatization methods which deposit the derivatization reagents onto the tissue via sublimation or spray have been developed as a promising strategy to improve the sensitivity for mass spectrometry imaging (MSI) of target biomolecules such as fatty acids,41 phospholipids,42 amino acids,43 steroids,44 neurotransmitters,45etc. Therefore, development of chemical derivatization methodology for glycan MSI is in great demand.
Herein, a new spatial visualization method based on in situ/on-tissue chemical derivatization of N-glycans with Girard’s reagent P (GP) was developed for N-glycan MS imaging with improved sensitivity and glycome coverage. As a proof-of-concept demonstration, we first applied the methodology to analyze reducing monosaccharides and oligosaccharides. In addition, N-glycans released from glycoproteins including bovine thyroglobulin (BTG) and human immunoglobulin G (IgG) were studied. Furthermore, spatial distributions of N-glycans in human laryngeal cancer and ovarian cancer tissues were profiled, exhibiting differential expression patterns of N-glycans unique to the tumor regions and adjacent normal tissue.
Experimental Section
Chemicals and Materials
This study involved experiments on saccharide standards, glycoproteins, formalin-fixed and paraffin-embedded (FFPE) human laryngeal cancer (squamous cell carcinoma with clinical grading of T3), and ovarian cancer tissue sections. Note that the experiments using human laryngeal cancer and ovarian cancer tissues adhered to the tenets of the Helsinki Declaration46 and were approved by the Institutional Review Board of the University of Wisconsin—Madison School of Medicine and Public Health. For details about the materials and chemicals used in the study, refer to the Supporting Information.
Histology Staining
H&E staining was performed according to prior literature.47 For details about the H&E staining, refer to the Supporting Information.
Preparation of N-Glycans Released from Glycoproteins
Releasing of N-glycans from glycoproteins was performed by filter-aided N-glycan separation (FANGS)48 with minor modification. For details about the releasing of N-glycans from glycoproteins, refer to the Supporting Information.
Sample Preparation for MALDI-MS Imaging
The schematic analytical workflow of on-tissue chemical derivatization of N-glycans for MALDI-MS imaging was shown in Figure S1. The FFPE tissue sections were heated on a heating plate at 60 °C for 20 min to enhance the adherence of the tissue section on glass slides. After cooling at room temperature, the tissue sections were sequentially deparaffinized through three washes with xylene. After deparaffinization, the slide was washed by 100% ethanol, 95% ethanol, and 70% ethanol to get rid of xylene. Following this, the tissues were heated for 1 h in 20 mM citrate buffer (pH 6.0) at 95 °C for antigen retrieval as previously described.22,49,50 Antigen retrieval was performed in a heated citrate buffer to break protein cross-links formed by formalin and increase enzyme access to the protein.49 Note that the antigen retrieval at a heating condition has been routinely performed for in situ imaging of glycans by MALDI-MS of formalin-fixed paraffin-embedded (FFPE) tissues.22,49−51 Afterward, the slides were dried in a desiccator for 10 min at room temperature. To release N-glycans, 20 μL of PNGase F dissolved in 380 μL of 15 mM ammonium bicarbonate solution was sprayed onto the tissue sections at a flow rate of 10 μL min–1 using a TM-Sprayer (HTX Technologies, Carrboro, NC). The nozzle nitrogen gas pressure was 8 psi. The nozzle temperature was set to 35 °C with moving velocity of 800 mm min–1 and 2 mm tracking space. Eight passes were performed with a drying time of 30 s between each pass. Then, tissue sections were incubated at 37 °C for 12 h in a humidified chamber.
For on-tissue derivatization, 10 mg mL–1 GP reagent in 50% (v/v) methanol aqueous containing 10% acetic acid was sprayed onto the tissue sections using a TM-Sprayer with a flow rate of 10 μL min–1. The nozzle temperature was set to 30 °C, and the tray temperature was set to 45 °C. The nozzle nitrogen gas pressure was 10 psi. The nozzle moving velocity was set to 800 mm min–1 with 2 mm tracking space for 10 passes (30 s drying time between each pass). Following the GP deposition, the tissue sections were incubated in a chamber with acetic acid vapor (acetic acid, 40% (v/v) aqueous solution) for 30 min. DHB in MeOH/H2O/TFA (v/v/v, 70:30:0.1) solution at a concentration of 40 mg mL–1 was sprayed onto the tissue section at a flow rate of 50 μL min–1 for 20 passes (30 s drying time between each pass). The nozzle temperature was set to 80 °C, and the tray temperature was set to 30 °C. The nozzle moving velocity was 1000 mm min–1 with 2 mm tracking space, and the nozzle nitrogen gas pressure was 10 psi. For samples without on-tissue derivatization, GP reagent was skipped from the solution. The tissue sections were dried inside a desiccator for 30 min before use.
Data Acquisition and Analysis
All MALDI-MS experiments were carried out using a MALDI-LTQ-Orbitrap XL mass spectrometer (Thermo Scientific, Bremen, Germany) with a 60 Hz 337 nm N2 laser focused to a 75 μm diameter circular spot on the MALDI target. Mass spectra were collected in the mass range of m/z 100 to 3000 with mass resolution of 60 K under positive ion detection mode. For MS imaging, mass spectra were collected across the tissue surface with a raster step size of 100 μm and laser energy of 20 μJ. MS data was processed using Xcalibur and ImageQuest (Thermo Scientific, Bremen, Germany). Observed N-glycan peaks on the mass spectra were annotated by using the GlycoWorkbench52 (https://code.google.com/archive/p/glycoworkbench/) with less than 10 ppm mass error tolerance. N-Glycan compositions were tentatively assigned by searching across the UniCarbKB database (http://www.glygen.org). Note that more confident chemical identification of N-glycan compositions could be obtained by using tandem MS analysis of each target ion. Signal intensities of N-glycans were normalized based on total ion count (TIC) to construct N-glycan images with mass error tolerance less than 5 ppm.
Results and Discussion
On-Target Derivatization of Reducing Saccharides
The GP derivatization of glycans is based on a hydrazide labeling procedure, in which the hydrazine group of the GP reagent reacts with the reducing terminus of glycan to yield a GP–glycan conjugate (Scheme S1). After the GP labeling, a permanent positive charge is introduced onto the glycan molecule, which notably enhances the ionization efficiency of the labeled N-glycan species.38−40 It is noted that, for sialylated N-glycans, the GP labeling mainly improves the signal-to-noise ratios of the labile sialylated N-glycans as the hydrazine group of the GP reagent specifically reacts with the reducing terminus of the sialylated N-glycan, rather than reacting with the sialic acid moiety of the sialylated N-glycan molecule. The GP-glycan conjugate ([M]+) has a characteristic mass increment of 134.0718 Da to the molecular weight of the native saccharide. The applicability of hydrazine derivatives has been shown in the analysis of glycans using CE-ESI-MS, LC-ESI-MS, and MALDI-MS with improved separation efficiency and ionization efficiency.34,40,53 In comparison with previous reports,34,40,53 we simplified the labeling procedure and optimized the efficiency by on-plate labeling of glycans, in which the glycan, GP reagent, and DHB matrix were sequentially spotted and mixed onto the MALDI sample plate. The mixed sample spot was naturally dried on the MALDI plate at room temperature (ca. 2 min), followed by direct MALDI-MS analysis. Reducing saccharides including glucose and maltooctaose were first assessed. The signal intensity of the tagged glucose at m/z 314.1333 (S/N = 7060) was enhanced by ∼230-fold over the native glucose at m/z 203.0521 (S/N = 31) via chemical labeling (Figure 1a–b). It is noted that the differences for noise signals, such as m/z 273.0384, in the GP-treated and -untreated conditions could possibly be explained by the ion suppression on the background signals after chemical derivatization of target saccharides. Moreover, in comparison to the signal intensity of the internal standard of γ-cyclodextrin, the signal intensity of maltooctaose increased more than 28-fold after on-plate GP labeling (Figure 1c–d). As seen, notably enhanced detection sensitivity was obtained for both monosaccharide and oligosaccharide via the on-plate GP labeling.
Figure 1.
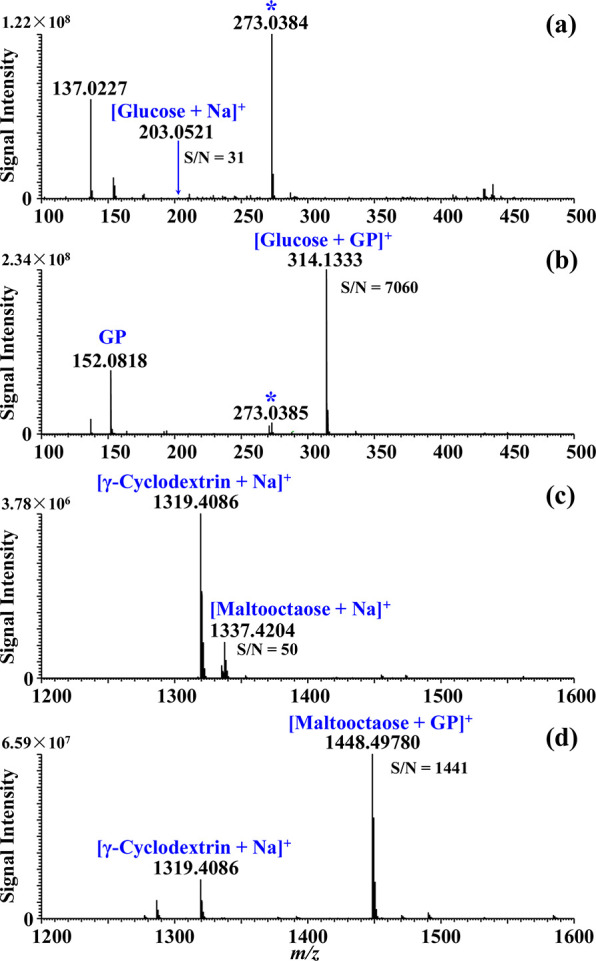
MALDI-MS spectra obtained from saccharides: (a) glucose without GP derivatization, (b) glucose with GP derivatization, (c) maltooctaose without GP derivatization, (d) maltooctaose with GP derivatization. An asterisk (*) indicates noise.
To optimize labeling efficiency, the effect of the molar ratio between glycans and GP reagent was evaluated using maltooctaose reacting with the GP reagent. High labeling efficiencies (>97.3%) were achieved by using molar ratios of GP reagent to maltooctaose greater than 10:1 (Figure S2). As a result, a high labeling efficiency was obtained through on-plate labeling of glycans. Note that complete derivatization of glycans using the GP reagent could be achieved by heating or longer reaction time.38−40 Indeed, since the glycan concentration in real samples was unknown, a sufficient amount of GP reagent (10 mg mL–1) was used to derivatize all of the glycans. Furthermore, the method was used for quantification of glycans by detecting a series of concentrations of maltooctaose (2–2000 nM mL–1). The signal response curve of maltooctaose is shown in Figure S3. Linearity R2 ≥ 0.99 and RSDs were below 9.6% (n = 3) for all the tested concentrations. The limit of detection (LOD) of maltooctaose defined by a signal-to-noise ratio (S/N) of 3 was estimated to be 0.81 nM mL–1.
Analysis of N-Glycans from Glycoproteins
The analysis of N-glycans on glycoproteins is helpful to interpret the biological function of proteins as well as to develop pharmaceuticals for treating diseases. N-glycans enzymatically released from bovine thyroglobulin (BTG) and human immunoglobulin G (IgG) were profiled using the proposed method. The released N-glycans were subjected to MALDI-MS analysis directly without any elaborate preconcentration or purification processes. Equal amounts of N-glycans released from glycoprotein sample (8 μg) with or without GP derivatization were analyzed under identical MALDI-MS settings in parallel. The results show that 10 sodium adducted N-glycans ([M + Na]+) were obtained from the BTG protein (8 μg) without the GP derivatization (Figure 2a and detailed in Table S1). Strikingly, 38 N-glycans with enhanced signal intensities were obtained from the BTG protein using the on-plate GP derivatization strategy (Figure 2b and detailed in Table S2). The Venn diagram shows that the N-glycans found in the nonderivatization condition were entirely present in the GP labeling scenario (Figure S4a). For the analysis of IgG protein, only 2 sodium adducted N-glycans with low signal intensities were obtained without the GP labeling (Figure 2c and detailed in Table S3), whereas 16 N-glycans with notably enhanced signal intensities were observed after GP labeling (Figure 2d, detailed in Table S4). The N-glycans found in underivatized sample were also entirely included in the GP derivatization result (Figure S4b). Most of the N-glycans found in the IgG protein were fucosylated and bisecting GlcNAc N-glycans, which is consistent with previous reports.54,55
Figure 2.
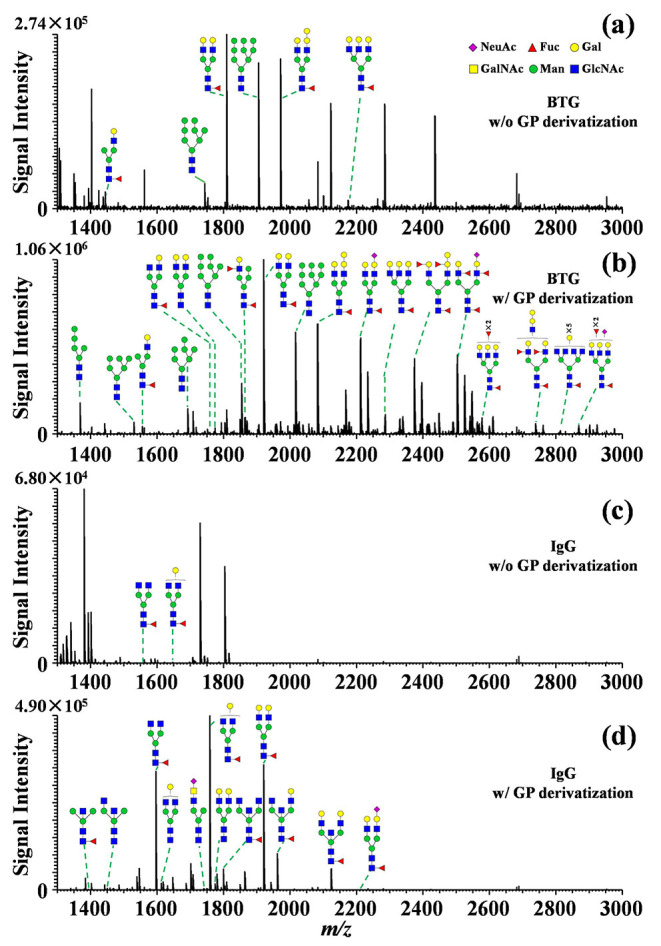
MALDI orbitrap mass spectra of N-glycans released from the glycoproteins: (a) BTG without chemical derivatization, (b) BTG with chemical derivatization, (c) IgG without chemical derivatization, and (d) IgG with chemical derivatization. Green circle represents mannose (Man), yellow circle represents galactose (Gal), blue square represents N-acetylglucosamine (GlcNAc), yellow square represents N-acetylgalactosamine (GalNAc), red triangle represents fucose (Fuc), purple diamond represents N-acetylneuraminic acid (NeuAc).
To assess the detection sensitivity, a series of samples with decreasing amounts of N-glycans from glycoproteins was treated with GP derivatization. The GP treated samples and untreated samples were subjected to MALDI-MS analysis in parallel. As shown in Figure S5, for equal amount of N-glycans released from the BTG protein, higher and cleaner N-glycans signals were obtained after the GP derivatization over that of the underivatized ones, respectively. Major N-glycan species such as Hex5HexNAc4dHex1 (m/z 1920.7148) and Hex9HexNAc2 (m/z 2016.7141) derived from as little as 0.083 μg of BTG protein can be successfully detected after GP derivatization, whereas these major N-glycans could hardly be observed without GP derivatization at sample amount below 4.16 μg (Figure S5). Furthermore, improvement of the detection sensitivity for N-glycans derived from IgG protein was also observed in the analysis of decreasing amounts of IgG protein samples; the major N-glycans such as Hex4HexNAc4dHex1 (m/z 1758.6682) and Hex5HexNAc4dHex1 (m/z 1920.7192) were successfully detected from as little as 0.16 μg IgG protein (Figure S6). We note that different glycoprotein amount was selected to assess the minimal detection limitation of the proposed method, suggesting the distinct sensitivity for BTG and IgG proteins associated with the N-glycan modification quantity and the mass of the protein itself. Therefore, notable enhancement of detection sensitivity for N-glycans was achieved via GP derivatization, regardless of glycoprotein size and modifications, encouraging its application to on-tissue N-glycan profiling via MALDI-MSI.
MALDI-MSI of N-Glycans in Human Laryngeal Cancer Tissue Sections
To test the applicability of this derivatization strategy for MS imaging in real biological samples, FFPE human laryngeal cancer tissue section slides were treated with PNGase F enzyme to release the N-glycans followed by on-tissue GP derivatization. Mass spectra obtained from the same region of two consecutive tissue sections show that a high abundance of GP labeled N-glycans were observed from the GP reagent treated sample (Figure 3), indicating effectiveness of the on-tissue GP derivatization for clinical tissue specimens. A total of 46 N-glycans including high-mannose N-glycans, fucosylated N-glycans, and sialylated N-glycans were detected via on-tissue GP labeling, whereas only 27 N-glycans were detected in the underivatized tissue section, out of which all 27 N-glycans were commonly detected in both the underivatized scenario and on-tissue GP labeling condition (Figure 4a, detailed in Table S5 and Table S6). Specifically, 7 sialylated N-glycans were obtained after GP labeling while this glycan type was hardly detected in the native form due to their lability and low ionization efficiency. Glycan profiles under nonderivatization and derivatization conditions are shown in Figure 3, with the majority of N-glycan ions being detected as sodium adducts for the underivatized sample. Usually, for native N-glycans, the absence of basic sites could result in decreased detection sensitivity and complicated mass spectra due to the attachment of alkali metal ions (e.g., Na+ and K+). In contrast, only [glycan-GP]+ ions were obtained after GP derivatization indicating that GP derivatization could simplify the mass spectral patterns of N-glycans and thus be beneficial for data interpretation. After derivatization, a generally higher signal intensity and better signal-to-noise ratio were obtained for the N-glycans from the tissue, and ion suppression from the lower m/z range was reduced as seen for the background mass spectral peak at m/z 1134.2667 (Figure S7). As a result, the data showed that enhanced sensitivity and higher coverage of N-glycans were achieved via on-tissue chemical derivatization.
Figure 3.
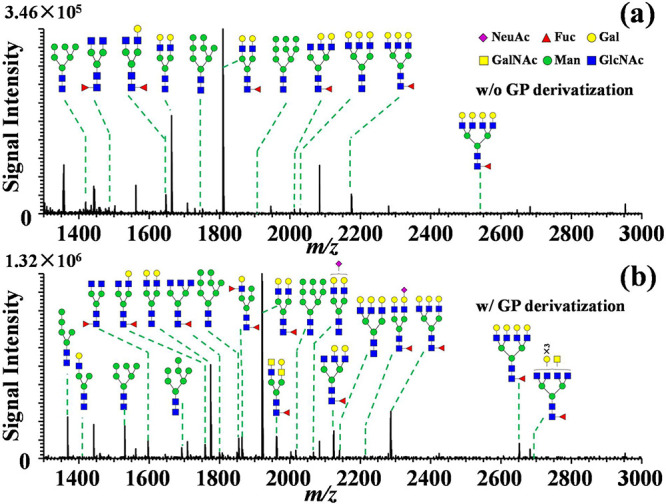
Mass spectra obtained from the same region of two consecutive FFPE laryngeal tissue sections using MALDI Orbitrap MS platform: (a) without chemical derivatization and (b) with on-tissue chemical derivatization via GP reagent.
Figure 4.
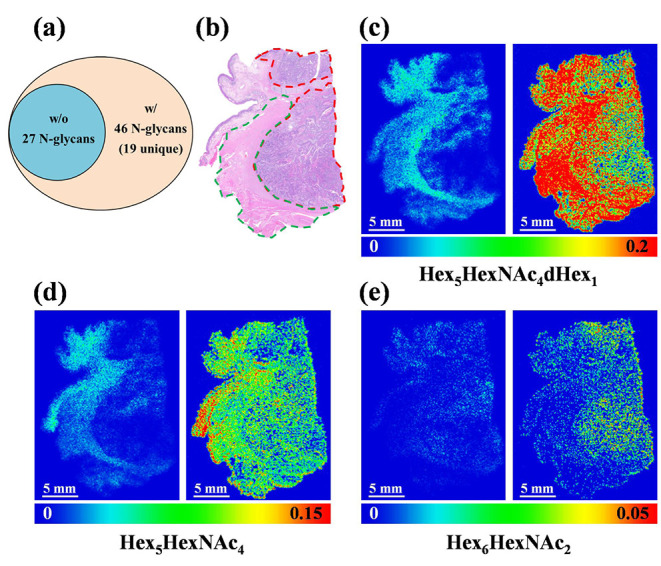
MALDI-MS imaging of N-glycans in human laryngeal cancer tissue section: (a) Venn diagram presenting numbers of N-glycans detected in human laryngeal tissue without (w/o) and with (w/) chemical derivatization, (b) H&E staining of laryngeal tissue showing tumor region outlined inside by red dashed lines and the surrounding tissues encircled by green dashed lines. (c) MS images of N-glycan of Hex5HexNAc4dHex1 without chemical derivatization (m/z 1809.6335, left panel) and with chemical derivatization (m/z 1920.7225, right panel), (d) MS images of N-glycan of Hex5HexNAc4 without chemical derivatization (m/z 1663.5822, left panel) and with chemical derivatization (m/z 1774.6682, right panel), (e) MS images of N-glycan of Hex6HexNAc2 without chemical derivatization (m/z 1419.4772, left panel) and with chemical derivatization (m/z 1530.5578, right panel). Scale bar is 5 mm.
Representative ion images derived from the GP labeled tissue section and underivatized counterpart are shown in Figure 4c–e. The dominant N-glycans such as Hex5HexNAc4dHex1 and Hex5HexNAc4 showed similar localizations in the native and GP derivatization treated tissue section samples, whereas clearer lateral distribution patterns were obtained from the GP treated tissue section. Coregistration of the MS imaging result and histological image of the tissue section showed that high-mannose type N-glycans including Hex5HexNAc2, Hex6HexNAc2, Hex7HexNAc2, and Hex8HexNAc2 were predominantly expressed in the laryngeal cancer region, whereas complex/hybrid N-glycans such as Hex3HexNAc4dHex1, Hex4HexNAc4dHex1, Hex5HexNAc4, Hex5HexNAc4dHex1, Hex6HexNAc5dHex1, etc. were relatively more abundant in the adjacent normal tissue (Figure 4 and Figure S8). Our finding indicates that an upregulation of high-mannose N-glycans may be associated with the human laryngeal cancer development, which is consistent with previous reports that upregulated high-mannose N-glycan expression was observed in the cancerous region.50,56 Overall, the result demonstrates that the spatial distributions of N-glycans on the FFPE human laryngeal tissue sections were successfully visualized using the on-tissue derivatization strategy.
MALDI-MSI of N-Glycans in Human Ovarian Cancer Tissue
We then tested the applicability of the derivatization strategy for MS imaging with FFPE preserved human ovarian cancer tissue sections. Consecutive tissue sections were digested with PNGase F and then treated with or without GP derivatization respectively as described. FFPE human ovarian cancer tissue sections were subjected to MALDI-MS imaging analysis following the spray application of DHB matrix. Cancer tissues are highly complex and heterogeneous, consisting of cancer cells, mesenchymal stromal cells, and noncellular extracellular matrix. The interactions between cancer cells and surrounding stromal play important roles in cancer initiation, progression, and metastasis.57,58 Glycoproteins are crucial mediators for cancer–stromal interactions.57 The glycan distribution on the ovarian cancer tissue in this study showed a regional specific pattern (Figure 5 and Figure S9). Higher signal-to-noise ratios of N-glycans were obtained and a greater number of glycans were detected with the assistance of GP derivatization in comparison to the underivatized counterpart. Remarkably, some N-glycans (e.g., Hex5HexNAc3dHex1, Hex4HexNAc5dHex1, Hex5HexNAc4NeuAc1, and Hex5HexNAc5dHex1) were hardly detectable in the underivatized scenario (Figure 5f–i). Interestingly, one of the major N-glycans, Hex5HexNAc4 (m/z 1774.6682), was found to be distributed in cancer cells and the surrounding mesenchymal region, while Hex5HexNAc4 was also found to be upregulated in the mesenchymal region adjacent to relatively mature cancer cells (Figure 5c). This observation suggests that N-glycan Hex5HexNAc4 may play a significant role in the interactions between cancer cells and stromal cells. Furthermore, higher abundances of N-glycans such as Hex5HexNAc3dHex1 and Hex5HexNAc4NeuAc1 were also accumulated in the tumor proximal stroma region (Figure 5f and 5h). However, low abundance of Hex5HexNAc4 and other types of N-glycans were found in the distal tumor stroma region (Figure 5 and Figure S9d). These results indicated that several glycans were enriched in cancer cells while others were higher in cancer surrounding mesenchymal areas. These differentially distributed glycans could serve as promising candidates for novel ovarian cancer biomarkers for more in-depth evaluation. Further study is needed to provide insights into the biosynthesis mechanisms of cancer-relevant glycans and their pathophysiological functions during tumor cell differentiation.
Figure 5.
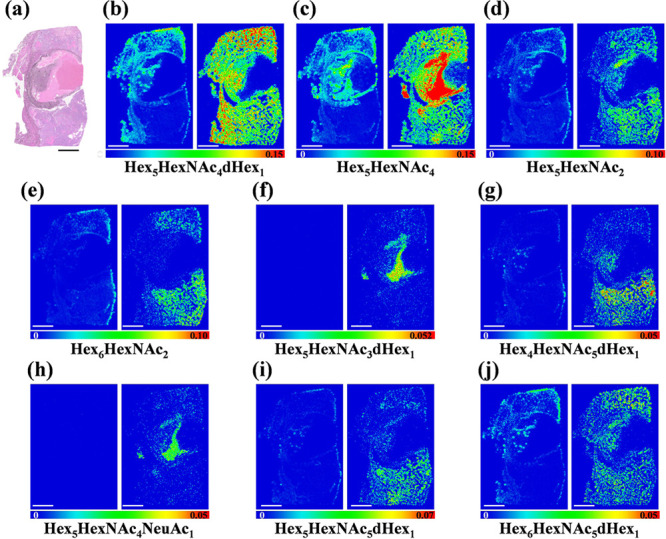
MALDI-MSI ion maps of representative N-glycans in human ovarian cancer tissue: (a) H&E staining result of the ovarian cancer tissue, (b) Hex5HexNAc4dHex1 without GP derivatization (m/z 1809.6335, left panel) and with GP derivatization (m/z 1920.7225, right panel), (c) Hex5HexNAc4 without GP derivatization (m/z 1663.5822, left panel) and with GP derivatization (m/z 1774.6682, right panel), (d) Hex5HexNAc2 w/o without GP derivatization (m/z 1257.4218, left panel) and with GP derivatization (m/z 1368.50382, right panel), (e) Hex6HexNAc2 without GP derivatization (m/z 1419.47575, left panel) and with GP derivatization (m/z 1530.5578, right panel), (f) Hex5HexNAc3dHex1 without GP derivatization (m/z 1606.5491, left panel) and with GP derivatization (m/z 1717.6312, right panel), (g) Hex4HexNAc5dHex1 without GP derivatization (m/z 1850.6570, left panel) and with GP derivatization (m/z 1961.7391, right panel), (h) Hex5HexNAc4NeuAc without GP derivatization (m/z 1954.6686, left panel) and with GP derivatization (m/z 2065.7506, right panel), (i) Hex5HexNAc5dHex1 without GP derivatization (m/z 2012.7204, left panel) and with GP derivatization (m/z 2123.8014, right panel), (j) Hex6HexNAc5dHex1 without GP derivatization (m/z 2174.7681, left panel) and with GP derivatization (m/z 2285.8627, right panel). Scale bar is 5 mm.
Conclusions
In summary, highly sensitive spatial characterization of N-glycans from cancer tissue samples was achieved by on-tissue GP derivatization coupled with MALDI-MSI. The ionization efficiency of N-glycans was remarkably improved since the N-glycans were tagged with a permanent positive charge after the chemical derivatization. Improved sensitivity and glycome coverage for N-glycan interrogation were demonstrated by spatial mapping of N-glycan expression patterns in human laryngeal cancer and ovarian cancer tissue samples. In addition, as a permanent cationic site conjugated to the reducing end of the N-glycans, only positively charged molecular ions were obtained without multiple metal ion adducts, simplifying the mass spectral interpretation. This study presents a versatile platform for profiling N-glycans derived from biological samples (e.g., glycoproteins and cell lysates), as well as in situ mapping the spatial distribution of N-glycans directly on tissue sections with high sensitivity. These advancements will facilitate research endeavors to investigate glycosylation pattern changes related to various biological processes and to explore potential glycan biomarkers in disease pathogenesis and pharmaceutical development. Furthermore, owing to the notably enhanced sensitivity, coupling the GP labeling strategy with higher spatial resolution MSI platforms holds the potential for analysis of N-glycans at the single-cell level on a tissue section. A related study is currently underway in our laboratory.
Acknowledgments
Aspects of this work were supported by the NIH grants R01 DK071801, R56MH110215, RF1AG052324, and U01CA231081. This research was supported in part by the University of Wisconsin Head and Neck SPORE grant (P50DE026787). The MALDI Orbitrap instrument was purchased through support from an NIH shared instrument grant (NIH-NCRR S10RR029531) and the University of Wisconsin—Madison, Office of the Vice Chancellor for Research and Graduate Education with funding from the Wisconsin Alumni Research Foundation. G.L. acknowledges the funding support for a Postdoctoral Career Development Award provided by the American Society for Mass Spectrometry (2019). L.L. acknowledges a Vilas Distinguished Achievement Professorship and Charles Melbourne Johnson Distinguished Chair Professorship, with funding provided by the Wisconsin Alumni Research Foundation and the University of Wisconsin—Madison School of Pharmacy.
Supporting Information Available
The Supporting Information is available free of charge at https://pubs.acs.org/doi/10.1021/acs.analchem.0c02704.
Additional information as noted in text. Chemicals and materials, histology staining, preparation of N-glycans released from glycoproteins, MALDI spot analysis, supplementary Figures S1–S9 and Tables S1–S6 (PDF)
The authors declare no competing financial interest.
Supplementary Material
References
- Hart G. W.; Copeland R. J. Glycomics hits the big time. Cell 2010, 143, 672–676. 10.1016/j.cell.2010.11.008. [DOI] [PMC free article] [PubMed] [Google Scholar]
- Moremen K. W.; Tiemeyer M.; Nairn A. V. Vertebrate protein glycosylation: diversity, synthesis and function. Nat. Rev. Mol. Cell Biol. 2012, 13, 448–462. 10.1038/nrm3383. [DOI] [PMC free article] [PubMed] [Google Scholar]
- Varki A. Biological roles of glycans. Glycobiology 2017, 27, 3–49. 10.1093/glycob/cww086. [DOI] [PMC free article] [PubMed] [Google Scholar]
- Pinho S. S.; Reis C. A. Glycosylation in cancer: mechanisms and clinical implications. Nat. Rev. Cancer 2015, 15, 540–555. 10.1038/nrc3982. [DOI] [PubMed] [Google Scholar]
- Kailemia M. J.; Park D.; Lebrilla C. B. Glycans and glycoproteins as specific biomarkers for cancer. Anal. Bioanal. Chem. 2017, 409, 395–410. 10.1007/s00216-016-9880-6. [DOI] [PMC free article] [PubMed] [Google Scholar]
- Glass C. K.; Saijo K.; Winner B.; Marchetto M. C.; Gage F. H. Mechanisms underlying inflammation in neurodegeneration. Cell 2010, 140, 918–934. 10.1016/j.cell.2010.02.016. [DOI] [PMC free article] [PubMed] [Google Scholar]
- Banerjee P. S.; Ma J.; Hart G. W. Diabetes-associated dysregulation of O-GlcNAcylation in rat cardiac mitochondria. Proc. Natl. Acad. Sci. U. S. A. 2015, 112, 6050–6055. 10.1073/pnas.1424017112. [DOI] [PMC free article] [PubMed] [Google Scholar]
- Pagan J. D.; Kitaoka M.; Anthony R. M. Engineered Sialylation of Pathogenic Antibodies In Vivo Attenuates Autoimmune Disease. Cell 2018, 172, 564–577. 10.1016/j.cell.2017.11.041. [DOI] [PMC free article] [PubMed] [Google Scholar]
- Xiao H.; Sun F.; Suttapitugsakul S.; Wu R. Global and site-specific analysis of protein glycosylation in complex biological systems with Mass Spectrometry. Mass Spectrom. Rev. 2019, 38, 356–379. 10.1002/mas.21586. [DOI] [PMC free article] [PubMed] [Google Scholar]
- Kailemia M. J.; Xu G.; Wong M.; Li Q.; Goonatilleke E.; Leon F.; Lebrilla C. B. Recent advances in the mass spectrometry methods for glycomics and cancer. Anal. Chem. 2018, 90, 208–224. 10.1021/acs.analchem.7b04202. [DOI] [PMC free article] [PubMed] [Google Scholar]
- Kailemia M. J.; Ruhaak L. R.; Lebrilla C. B.; Amster I. J. Oligosaccharide analysis by mass spectrometry: a review of recent developments. Anal. Chem. 2014, 86, 196–212. 10.1021/ac403969n. [DOI] [PMC free article] [PubMed] [Google Scholar]
- Szigeti M.; Guttman A. High-resolution glycan analysis by temperature gradient capillary electrophoresis. Anal. Chem. 2017, 89, 2201–2204. 10.1021/acs.analchem.7b00016. [DOI] [PubMed] [Google Scholar]
- Stadheim T. A.; Li H.; Kett W.; Burnina I. N.; Gerngross T. U. Use of high-performance anion exchange chromatography with pulsed amperometric detection for O-glycan determination in yeast. Nat. Protoc. 2008, 3, 1026–1031. 10.1038/nprot.2008.76. [DOI] [PubMed] [Google Scholar]
- Lareau N. M.; May J. C.; McLean J. A. Non-derivatized glycan analysis by reverse phase liquid chromatography and ion mobility-mass spectrometry. Analyst 2015, 140, 3335–3338. 10.1039/C5AN00152H. [DOI] [PMC free article] [PubMed] [Google Scholar]
- D’Atri V.; Novakova L.; Fekete S.; Stoll D.; Lauber M.; Beck A.; Guillarme D. Orthogonal middle-up approaches for characterization of the glycan heterogeneity of etanercept by hydrophilic interaction chromatography coupled to high-resolution mass spectrometry. Anal. Chem. 2019, 91, 873–880. 10.1021/acs.analchem.8b03584. [DOI] [PubMed] [Google Scholar]
- Melmer M.; Stangler T.; Premstaller A.; Lindner W. Comparison of hydrophilic-interaction, reversed-phase and porous graphitic carbon chromatography for glycan analysis. J. Chromatogr. A 2011, 1218, 118–123. 10.1016/j.chroma.2010.10.122. [DOI] [PubMed] [Google Scholar]
- Zeng Z.; Hincapie M.; Pitteri S. J.; Hanash S.; Schakwijk J.; Hogan J. M.; Wang H.; Hancock W. S. A proteomics platform combining depletion, multi-lectin affinity chromatography (M-LAC), and isoelectric focusing to study the breast cancer proteome. Anal. Chem. 2011, 83, 4845–4854. 10.1021/ac2002802. [DOI] [PMC free article] [PubMed] [Google Scholar]
- Cai Y.; Zhang Y.; Yuan W. J.; Yao J.; Yan G. Q.; Lu H. J. A thiazolidine formation-based approach for ultrafast and highly efficient solid-phase extraction of N-Glycoproteome. Anal. Chim. Acta 2020, 1100, 174–181. 10.1016/j.aca.2019.12.001. [DOI] [PubMed] [Google Scholar]
- Buchberger A. R.; DeLaney K.; Johnson J.; Li L. Mass spectrometry imaging: a review of emerging advancements and future insights. Anal. Chem. 2018, 90, 240–265. 10.1021/acs.analchem.7b04733. [DOI] [PMC free article] [PubMed] [Google Scholar]
- Kompauer M.; Heiles S.; Spengler B. Atmospheric pressure MALDI mass spectrometry imaging of tissues and cells at 1.4-mu m lateral resolution. Nat. Methods 2017, 14, 90–96. 10.1038/nmeth.4071. [DOI] [PubMed] [Google Scholar]
- Powers T. W.; Jones E. E.; Betesh L. R.; Romano P. R.; Gao P.; Copland J. A.; Mehta A. S.; Drake R. R. Matrix assisted laser desorption ionization imaging mass spectrometry workflow for spatial profiling analysis of N-linked glycan expression in tissues. Anal. Chem. 2013, 85, 9799–9806. 10.1021/ac402108x. [DOI] [PMC free article] [PubMed] [Google Scholar]
- Drake R. R.; McDowell C.; West C.; David F.; Powers T. W.; Nowling T.; Bruner E.; Mehta A. S.; Angel P. M.; Marlow L. A.; Tun H. W.; Copland J. A. Defining the human kidney N-glycome in normal and cancer tissues using MALDI imaging mass spectrometry. J. Mass Spectrom. 2020, 55, e4490 10.1002/jms.4490. [DOI] [PMC free article] [PubMed] [Google Scholar]
- Eshghi S. T.; Yang S.; Wang X. C.; Shah P.; Li X. D.; Zhang H. Imaging of N-linked glycans from formalin-fixed paraffin-embedded tissue sections using MALDI mass spectrometry. ACS Chem. Biol. 2014, 9, 2149–2156. 10.1021/cb500405h. [DOI] [PMC free article] [PubMed] [Google Scholar]
- Briggs M. T.; Condina M. R.; Ho Y. Y.; Everest-Dass A. V.; Mittal P.; Kaur G.; Oehler M. K.; Packer N. H.; Hoffmann P. MALDI Mass Spectrometry Imaging of Early- and Late-Stage Serous Ovarian Cancer Tissue Reveals Stage-Specific N-Glycans. Proteomics 2019, 19, e1800482 10.1002/pmic.201800482. [DOI] [PubMed] [Google Scholar]
- Holst S.; Heijs B.; de Haan N.; van Zeijl R. J. M.; Briaire-De Bruijn I. H.; van Pelt G. W.; Mehta A. S.; Angel P. M.; Mesker W. E.; Tollenaar R. A.; Drake R. R.; Bovee J.; McDonnell L. A.; Wuhrer M. Linkage-specific in situ sialic acid derivatization for N-glycan mass spectrometry imaging of formalin-fixed paraffin-embedded tissues. Anal. Chem. 2016, 88, 5904–5913. 10.1021/acs.analchem.6b00819. [DOI] [PubMed] [Google Scholar]
- Shi Y. T.; Li Z. H.; Felder M. A.; Yu Q. Y.; Shi X. D.; Peng Y. J.; Cao Q. J. W.; Wang B.; Puglielli L.; Patankar M. S.; Li L. J. Mass Spectrometry Imaging of N-Glycans from Formalin-Fixed Paraffin-Embedded Tissue Sections Using a Novel Subatmospheric Pressure Ionization Source. Anal. Chem. 2019, 91, 12942–12947. 10.1021/acs.analchem.9b02995. [DOI] [PMC free article] [PubMed] [Google Scholar]
- Ruhaak L. R.; Zauner G.; Huhn C.; Bruggink C.; Deelder A. M.; Wuhrer M. Glycan labeling strategies and their use in identification and quantification. Anal. Bioanal. Chem. 2010, 397, 3457–3481. 10.1007/s00216-010-3532-z. [DOI] [PMC free article] [PubMed] [Google Scholar]
- Harvey D. J. Derivatization of carbohydrates for analysis by chromatography; electrophoresis and mass spectrometry. J. Chromatogr. B: Anal. Technol. Biomed. Life Sci. 2011, 879, 1196–1225. 10.1016/j.jchromb.2010.11.010. [DOI] [PubMed] [Google Scholar]
- Ciucanu I.; Kerek F. A simple and rapid method for the permethylation of carbohydrates. Carbohydr. Res. 1984, 131, 209–217. 10.1016/0008-6215(84)85242-8. [DOI] [Google Scholar]
- Zhong X. F.; Chen Z. W.; Snovida S.; Liu Y.; Rogers J. C.; Li L. J. Capillary electrophoresis-electrospray ionization-mass spectrometry for quantitative analysis of glycans labeled with multiplex carbonyl-reactive tandem mass tags. Anal. Chem. 2015, 87, 6527–6534. 10.1021/acs.analchem.5b01835. [DOI] [PMC free article] [PubMed] [Google Scholar]
- Feng Y.; Chen B. M.; Yu Q. Y.; Zhong X. F.; Frost D. C.; Ikonomidou C.; Li L. J. Isobaric multiplex labeling reagents for carbonyl-containing compound (SUGAR) tags: a probe for quantitative glycomic analysis. Anal. Chem. 2019, 91, 3141–3146. 10.1021/acs.analchem.8b05757. [DOI] [PMC free article] [PubMed] [Google Scholar]
- Chen B. M.; Zhong X. F.; Feng Y.; Snovida S.; Xu M.; Rogers J.; Li L. J. Targeted multinotch MS3 approach for relative quantification of N-glycans using multiplexed carbonyl-reactive isobaric tags. Anal. Chem. 2018, 90, 1129–1135. 10.1021/acs.analchem.7b03289. [DOI] [PMC free article] [PubMed] [Google Scholar]
- Chen B. M.; Feng Y.; Frost D. C.; Zhong X. F.; Buchberger A. R.; Johnson J.; Xu M.; Kim M.; Puccetti D.; Diamond C.; Ikonomidou C.; Li L. J. Quantitative glycomic analysis by mass-defect-based dimethyl pyrimidinyl ornithine (DiPyrO) tags and high-resolution mass spectrometry. Anal. Chem. 2018, 90, 7817–7823. 10.1021/acs.analchem.8b00548. [DOI] [PMC free article] [PubMed] [Google Scholar]
- Naven T. J. P.; Harvey D. J. Cationic derivatization of oligosaccharides with Girard’s T reagent for improved performance in matrix-assisted laser desorption/ionization and electrospray mass spectrometry. Rapid Commun. Mass Spectrom. 1996, 10, 829–834. . [DOI] [Google Scholar]
- Wang C. J.; Wu Z. Y.; Yuan J. B.; Wang B.; Zhang P.; Zhang Y.; Wang Z. F.; Huang L. J. Simplified quantitative glycomics using the stable isotope label Girard’s reagent P by electrospray ionization mass spectrometry. J. Proteome Res. 2014, 13, 372–384. 10.1021/pr4010647. [DOI] [PubMed] [Google Scholar]
- Bereman M. S.; Comins D. L.; Muddiman D. C. Increasing the hydrophobicity and electrospray response of glycans through derivatization with novel cationic hydrazides. Chem. Commun. 2010, 46, 237–239. 10.1039/B915589A. [DOI] [PubMed] [Google Scholar]
- Walker S. H.; Budhathoki-Uprety J.; Novak B. M.; Muddiman D. C. Stable-isotope labeled hydrophobic hydrazide reagents for the relative quantification of N-linked glycans by electrospray ionization mass spectrometry. Anal. Chem. 2011, 83, 6738–6745. 10.1021/ac201376q. [DOI] [PMC free article] [PubMed] [Google Scholar]
- Gao X.; Lu Y.; Wei M.; Yang M. F.; Zheng C. X.; Wang C. J.; Zhang Y.; Huang L. J.; Wang Z. F. Matrix-assisted laser desorption/ionization time-of-flight mass spectrometry analysis of human milk neutral and sialylated free oligosaccharides using Girard’s reagent P on-target derivatization. J. Agric. Food Chem. 2019, 67, 8958–8966. 10.1021/acs.jafc.9b02635. [DOI] [PubMed] [Google Scholar]
- Zhang Y.; Wang B.; Jin W.; Wen Y.; Nan L.; Yang M.; Liu R.; Zhu Y.; Wang C.; Huang L.; Song X.; Wang Z. Sensitive and robust MALDI-TOF-MS glycomics analysis enabled by Girard’s reagent T on-target derivatization (GTOD) of reducing glycans. Anal. Chim. Acta 2019, 1048, 105–114. 10.1016/j.aca.2018.10.015. [DOI] [PMC free article] [PubMed] [Google Scholar]
- Lattova E.; Perreault H. The usefulness of hydrazine derivatives for mass spectrometric analysis of carbohydrates. Mass Spectrom. Rev. 2013, 32, 366–385. 10.1002/mas.21367. [DOI] [PubMed] [Google Scholar]
- Wu Q.; Comi T. J.; Li B.; Rubakhin S. S.; Sweedler J. V. On-tissue derivatization via electrospray deposition for matrix assisted laser desorption/ionization mass spectrometry imaging of endogenous fatty acids in rat brain tissues. Anal. Chem. 2016, 88, 5988–5995. 10.1021/acs.analchem.6b01021. [DOI] [PMC free article] [PubMed] [Google Scholar]
- Wang S.-S.; Wang Y.-J.; Zhang J.; Sun T.-Q.; Guo Y.-L. Derivatization strategy for simultaneous molecular imaging of phospholipids and low-abundance free fatty acids in thyroid cancer tissue sections. Anal. Chem. 2019, 91, 4070–4076. 10.1021/acs.analchem.8b05680. [DOI] [PubMed] [Google Scholar]
- Duenas M. E.; Larson E. A.; Lee Y. J. Toward Mass Spectrometry Imaging in the Metabolomics Scale: Increasing Metabolic Coverage Through Multiple On-Tissue Chemical Modifications. Front. Plant Sci. 2019, 10, 860. 10.3389/fpls.2019.00860. [DOI] [PMC free article] [PubMed] [Google Scholar]
- Takeo E.; Sugiura Y.; Uemura T.; Nishimoto K.; Yasuda M.; Sugiyama E.; Ohtsuki S.; Higashi T.; Nishikawa T.; Suematsu M.; Fukusaki E.; Shimma S. Tandem mass spectrometry imaging reveals distinct accumulation patterns of steroid structural isomers in human adrenal glands. Anal. Chem. 2019, 91, 8918–8925. 10.1021/acs.analchem.9b00619. [DOI] [PubMed] [Google Scholar]
- Guo S.; Tang W.; Hu Y.; Chen Y.; Gordon A.; Li B.; Li P. Enhancement of on-tissue chemical derivatization by laser-assisted tissue transfer for MALDI MS imaging. Anal. Chem. 2020, 92, 1431–1438. 10.1021/acs.analchem.9b04618. [DOI] [PubMed] [Google Scholar]
- Goodyear M. D. E.; Krleza-Jeric K.; Lernmens T. The declaration of Helsinki. Br. Med. J. 2007, 335, 624–625. 10.1136/bmj.39339.610000.BE. [DOI] [PMC free article] [PubMed] [Google Scholar]
- Ly A.; Buck A.; Balluff B.; Sun N.; Gorzolka K.; Feuchtinger A.; Janssen K.-P.; Kuppen P. J. K.; van de Velde C. J. H.; Weirich G.; Erlmeier F.; Langer R.; Aubele M.; Zitzelsberger H.; McDonnell L.; Aichler M.; Walch A. High-mass-resolution MALDI mass spectrometry imaging of metabolites from formalin-fixed paraffin-embedded tissue. Nat. Protoc. 2016, 11, 1428–1443. 10.1038/nprot.2016.081. [DOI] [PubMed] [Google Scholar]
- Rahman S. A.; Bergstroem E.; Watson C. J.; Wilson K. M.; Ashford D. A.; Thomas J. R.; Ungar D.; Thomas-Oates J. E. Filter-aided N-glycan separation (FANGS): A convenient sample preparation method for mass spectrometric N-glycan profiling. J. Proteome Res. 2014, 13, 1167–1176. 10.1021/pr401043r. [DOI] [PMC free article] [PubMed] [Google Scholar]
- Powers T. W.; Neely B. A.; Shao Y.; Tang H. Y.; Troyer D. A.; Mehta A. S.; Haab B. B.; Drake R. R. MALDI imaging mass spectrometry profiling of N-glycans in formalin-fixed paraffin embedded clinical tissue blocks and tissue microarrays. PLoS One 2014, 9, e106255 10.1371/journal.pone.0106255. [DOI] [PMC free article] [PubMed] [Google Scholar]
- Everest-Dass A. V.; Briggs M. T.; Kaur G.; Oehler M. K.; Hoffmann P.; Packer N. H. N-glycan MALDI imaging mass spectrometry on formalin-fixed paraffin-embedded tissue enables the delineation of ovarian cancer tissues. Mol. Cell. Proteomics 2016, 15, 3003–3016. 10.1074/mcp.M116.059816. [DOI] [PMC free article] [PubMed] [Google Scholar]
- Drake R. R.; West C. A.; Mehta A. S.; Angel P. M., MALDI Mass Spectrometry Imaging of N-Linked Glycans in Tissues. In Glycobiophysics; Yamaguchi Y., Kato K., Eds.; Springer International Publishing Ag: Cham, 2018; Vol. 1104, pp 59–76. [DOI] [PubMed] [Google Scholar]
- Ceroni A.; Maass K.; Geyer H.; Geyer R.; Dell A.; Haslam S. M. GlycoWorkbench: A tool for the computer-assisted annotation of mass spectra of Glycans. J. Proteome Res. 2008, 7, 1650–1659. 10.1021/pr7008252. [DOI] [PubMed] [Google Scholar]
- Lageveen-Kammeijer G. S. M.; de Haan N.; Mohaupt P.; Wagt S.; Filius M.; Nouta J.; Falck D.; Wuhrer M. Highly sensitive CE-ESI-MS analysis of N-glycans from complex biological samples. Nat. Commun. 2019, 10, 2137. 10.1038/s41467-019-09910-7. [DOI] [PMC free article] [PubMed] [Google Scholar]
- Parekh R. B.; Dwek R. A.; Sutton B. J.; Fernandes D. L.; Leung A.; Stanworth D.; Rademacher T. W.; Mizuochi T.; Taniguchi T.; Matsuta K.; Takeuchi F.; Nagano Y.; Miyamoto T.; Kobata A. Association of rheumatoid-arthritis and primary osteo-arthritis with changes in the glycosylation pattern of total serum IgG. Nature 1985, 316, 452–457. 10.1038/316452a0. [DOI] [PubMed] [Google Scholar]
- Lu G.; Holland L. A. Profiling the N-Glycan Composition of IgG with Lectins and Capillary Nanogel Electrophoresis. Anal. Chem. 2019, 91, 1375–1383. 10.1021/acs.analchem.8b03725. [DOI] [PMC free article] [PubMed] [Google Scholar]
- Chen H. H.; Deng Z. A.; Huang C. C.; Wu H. M.; Zhao X.; Li Y. Mass spectrometric profiling reveals association of N-glycan patterns with epithelial ovarian cancer progression. Tumor Biol. 2017, 39, 12. 10.1177/1010428317716249. [DOI] [PubMed] [Google Scholar]
- Xu S. S.; Xu H. X.; Wang W. Q.; Li S.; Li H.; Li T. J.; Zhang W. H.; Yu X. J.; Liu L. The role of collagen in cancer: from bench to bedside. J. Transl. Med. 2019, 17, 309. 10.1186/s12967-019-2058-1. [DOI] [PMC free article] [PubMed] [Google Scholar]
- Theocharis A. D.; Skandalis S. S.; Gialeli C.; Karamanos N. K. Extracellular matrix structure. Adv. Drug Delivery Rev. 2016, 97, 4–27. 10.1016/j.addr.2015.11.001. [DOI] [PubMed] [Google Scholar]
Associated Data
This section collects any data citations, data availability statements, or supplementary materials included in this article.