Abstract
The sudden outbreak of COVID-19 has been responsible for several deaths across the globe. Due to its high contagious nature, it spreads from one human to another very quickly. Now it becomes a global public health threat with no approved treatments. In silico techniques can accelerate the drug development process. Our research aimed to identify the novel drugs for inhibition of Main protease (Mpro) enzyme of COVID-19 by performing in silico approach. In this context, a library consisting of 3180 FDA-approved drugs from ‘the ZINC database’ was used to identify novel drug candidates against ‘the Mpro’ of SARS-CoV-2. Initially, the top 10 drugs out of 3180 drugs were selected by molecular docking according to their binding score. Among 10 selected drugs; seven drugs that showed binding with Mpro enzyme residue Glu166 were subjected to100 ns Molecular dynamics (MD) simulation. Out of seven compounds, four namely, ZINC03831201, ZINC08101052, ZINC01482077, and ZINC03830817 were found significant based on MD simulation results. Furthermore, RMSD, RMSF, RG, SASA, PCA, MMPBSA (for last 40 ns) were calculated for the 100 ns trajectory period. Currently, the world needs potent drugs in a short period and this work suggests that these four drugs could be used as novel drugs against COVID-19 and it also provides new lead compounds for further in vitro, in vivo, and ongoing clinical studies against SARS-CoV-2.
Communicated by Ramaswamy H. Sarma
Keywords: SARS-CoV-2, FDA drugs, zinc database, main protease, molecular dynamic simulation, molecular docking
Introduction
COVID-19 was firstly identified in Wuhan city, China in December 2019 (Gralinski & Menachery, 2020). The name COVID 19 was given by the World Health Organization on 11 February 2020 as it stands for Corona (CO) Virus (VI) Disease (D) and 19(2019) the year that the virus first hit. It is an enveloped + sense, single‐stranded RNA virus belongs to family Coronaviridae. Many reports suggest that the structure of genome of SARS-CoV-2 is in close resemblance to that of previously known diseases SARS-CoV, MERS-CoV and belongs to the same Betacoronavirus genus. The typical symptoms of CoV-2 include upper respiratory tract, gastrointestinal infections, pneumonia, fever, and cough. However, in severe cases, it causes ARDS-Acute Respiratory Distress Syndrome resulting fall in blood pressure, a drop in oxygen level, and shortness of breath (Guan et al., 2020; Paraskevis et al., 2020). A recent study has shown that the main cause of death is respiratory failure. Due to this epidemic, Patients are facing a dire situation, and it is affecting not only the healthcare system but also the global economy. According to the World Health Organization (WHO), as of September 3, 2020, 25,602,665 confirmed cases have been reported in 190 countries with more than 852,758 deaths and additional cases continue to be identified in several countries.
Scientists from worldwide have been trying to develop efficient therapy, but unfortunately, no appropriate vaccine and antiviral drug are available in the market. Repurposing of known compounds seems to be a very efficient way to develop the novel potential drugs to combat coronavirus which could significantly shorten the time and reduce the cost. Recently, several efforts were made to design COVID-19 drugs by drug repurposing methods against the coronavirus (Khan et al., 2020). Two known famous examples of drug repurposing are Aspirin and Sildenafil which were originally used for the treatment of inflammation and hypertension, and later, they were repurposed for cardiovascular disease treatment and erectile dysfunction therapy (Fuster & Sweeny, 2011; Ghofrani et al., 2006). Studies from the last decade also have demonstrated that drug repurposing approaches have already been conducted for the previous two coronaviruses SARS-CoV and MERS-CoV (Zumla et al., 2016).
In a recent report, in vitro study, several drugs like Remdesivir (Wang et al., 2020), Favipiravir (Furuta et al., 2017), Ivermectin (Caly et al., 2020) have been shown to inhibit SARS-CoV-2 and more importantly, these drugs have been previously shown remarkable inhibitory activities against SARS-CoV and MERS-CoV on in vitro and in vivo study (Agostini et al., 2018; Sheahan et al., 2017).
Another, well-known antimalarial agent, hydroxychloroquine was also proven to inhibit the replication of SARS-CoV by impeding the glycosylation of ACE2 (Vincent et al., 2005). In a recent study, hydroxychloroquine was also found to reduce the viral copy number of SARS-CoV-2 (Lan et al., 2020). In this contest, other drugs like chloroquine, lopinavir, ribavirin, or ritonavir also showed significant efficacy against SARS-CoV-2 (Gimeno et al., 2019). Nevertheless, the potentialities of some drugs remain controversial because the clinical effects are unclear, and side effects should be considered seriously (Wang et al., 2020).
Computational techniques have been proven very important tools in drug discovery by reducing cost and time and speeding up analyses of target interactions with small molecules. Therefore, in this study, to search potential inhibitors of SARS-CoV-2, FDA-approved drugs from the ZINC15 database were used against the main protease of SARS-CoV-2. Previously, these drugs were used against Trypanosomacruzi by (Palos et al., 2017). The coronavirus 3-chymotrypsin-like protease (3CLpro), also known as Main protease (Mpro) has been studied by several researchers and it is one of the best-characterized drug targets for the development of new drugs. This enzyme is a non-structural protein that cuts two replicase polyproteins and essential for processing the polyproteins (Thiel et al., 2003). By the inhibition of the Mpro, we can stop virus replication.
The objective of our study is,
To carry out virtual screening against the Main protease of SARS-CoV-2 using 3180 drugs from ZINC database.
To conduct Molecular dynamics on selected seven drug compounds and analyze post-MD results to find out some inhibitors for the discovery of potential drug candidates.
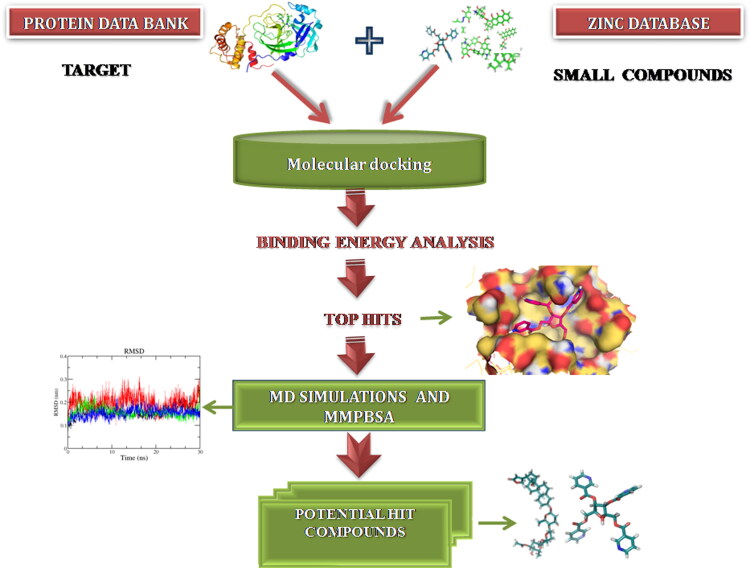
This study may enable the identification of potential therapeutic against the COVID-19 (Figure 1).
Figure 1.
Schematic representation of various steps of the methodology.
2. Materials and methods
2.1. Receptor and ligand preparation
The resolved crystal structure of Main protease (PDB ID: 6W63) was retrieved from the Protein Data Bank (https://www.rcsb.org). For protein preparation, all water molecules, ions, and nonspecific molecules were removed from the protein molecule using PyMOL software. Further, the addition of hydrogen atoms to the receptor molecule was carried out by using the MG Tools of AutoDock Vina software. The structure of the protein was saved in PDB format for further analysis.
A library consisting of 3180 clinically drug compounds was retrieved as mol2 format from the ZINC database website (Irwin et al., 2012). Then OpenBabel (version 2.3.1) (O'Boyle et al., 2011) was used to convert mol2 format files to pdb format. Reference molecule N-(4-tert-butylphenyl)-N-[(1R)-2-(cyclohexylamino)-2-oxo-1-(pyridin-3-yl)ethyl]-1H-imidazole-4-carboxamide or X77(id-145998279) was downloaded from PubChem server. For the preparation of the ligands, hydrogens were added to all the compounds and energy minimization was done with UFF force field using conjugate-gradient algorithm by PyRx software. Later all the compounds were converted into pdbqt format.
2.2. Structure-based virtual screening
To find potential candidates against COVID-19, molecular docking was carried out to screen conformations of ligands with high affinity at the binding site of Mpro by Autodock Vina using PyRx software (GUI version 0.8) (Trott & Olson). Initially, molecular docking analysis was performed with the reference molecule in the active site of Mpro to re-produce the same conformation similar to the co-crystallized ligand. The grid center for docking was set as X= −23.05, Y = 13.32, and Z= −29.93 with dimensions of the grid box 25 × 25 × 25 Å. Throughout the virtual screening, target proteins were kept rigid while the ligands were kept flexible. Re-docking was also performed to validate the docking accuracy of the software PyRx. Finally, the protein-ligand complex with the lower binding energy as compared to reference were selected for further molecular dynamic simulation.
2.3. Visualization
The 2 D interactions of protein-ligand complexes including hydrogen bonds and the bond lengths were analyzed by using Ligplot + v.1.4.5 software (Wallace et al., 1995) while 3 D visualization analysis studies were performed by using PyMol molecular visualization tool (DeLano, 2002).
2.4. Molecular dynamics simulation
The MD simulation is widely used to determine the structural stability of the protein as well as protein-ligand complexes under physiological conditions (Karplus & McCammon, 2002). Herein, top compounds obtained from molecular docking were subjected to MD simulations. MD simulation was performed on a work station with configuration Ubuntu 16.04 LTS 64-bit, 4GB RAM, IntelCore i5-6400 CPU processor. To perform MDS following protocols were used. All MD simulations were done using the GROMACS 5.0.7 software package (Pronk et al., 2013) and the topologies for protein as well as protein-ligand complexes were prepared by using CHARMM 36 force field (Vanommeslaeghe et al., 2010). This topology file contains all of the information that includes non bonded parameters as well as bonded parameters like atom types, charges, and bonded connectivity. Molecules to be simulated must be immersed in solvation medium like water and other solvents to mimic the cellular environment. Therefore salvation was accomplished by using TIP3P water model(Jorgensen et al., 1983). After the solvation process, neutralization of the system was done by the addition of ions.
Furthermore, the energy minimization process was run to ensure that the system has no steric clashes and a reasonable starting structure. This step was done at 10 KJ/mol with the steepest descent algorithm by using Verlet cut-off scheme. After energy minimization, Equilibration was conducted in two phases. Equilibration under the NVT ensemble was performed at 300 K for 10 ps. It stabilized the temperature of the system. The second phase was conducted under an NPT ensemble, followed by a 10 ps NPT simulation at 1 atm. The system was subjected at a constant temperature of 300 K and a constant pressure of 1 atm with a time step of 2 fs, using the Parrinello-Rahman for constant pressure simulation. All MD simulations were conducted for 100 ns (nanosecond). For analyzing the stability of protein and protein-ligand complex system, Root mean square deviation (RMSD), Root mean square fluctuation (RMSF), Radius of gyration (RG), hydrogen bonds, Solvent accessible surface area (SASA) were calculated. The number of distinct hydrogen bonds formed within the complex and protein during the simulation was calculated by hydrogen bond analysis.
2.5. Binding free energy
Subsequently, a detailed analysis of the binding free energy (ΔGbind) was performed using Molecular mechanics Poisson–Boltzmann surface area (MM-PBSA) protocol implemented in the g_mmpbsa package (Kuzmanic & Zagrovic, 2010). MM-PBSA calculation provides a quantitative estimation of the interaction mechanisms of the proteins and the ligand molecules. To determine the total ΔGbind, the free solvation energy (polar and nonpolar solvation energies) and potential energy (electrostatic and Van der Waals interactions) of each protein-ligand complexes were analyzed. The binding-free energy was calculated as follows:
where ΔGbinding = the total binding energy of the complex, Gprotein = the binding energy of native protein, and Gligand = the binding energy of unbounded ligand.
3. Results
3.1. Molecular docking analysis
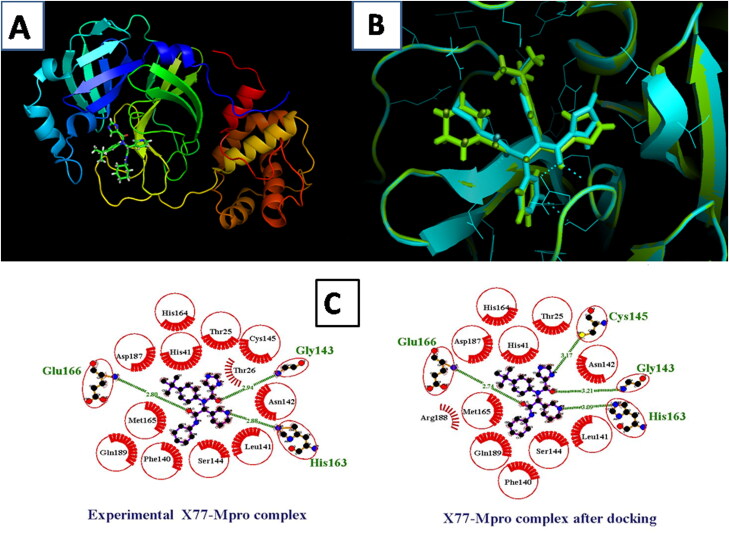
Before conducting the screening, validation of the docking protocol was done by re-docking the reference molecule (X77) into the binding pocket of the active site of Mpro structure. The result indicated that the docked X77 was completely superimposed with co-crystallized reference molecule in PDB (Figure 2), and the RMSD of the superimposed structure is 0.62. Analysis of the crystal structure of Mpro-X77 complex showed that the binding of the ligand was stabilized through three hydrogen bonds with the active site residues, viz, Gly143, His163 and, Glu166 while the in silico docked structure exhibited four hydrogen bonds Gly143, His163, Glu166 and, Cys145.
Figure 2.
(a) 3 D structure of protein and reference complex (b) Superimposition of experimental reference in Green color and docked reference in Cyan color with 3 D structure of protein. (c) The 2 D structure of superimposition of the docked reference molecule (X77) with its X-ray crystal structure (Dotted green lines indicate the hydrogen bond and brick red sparked arc represent hydrophobic interaction).
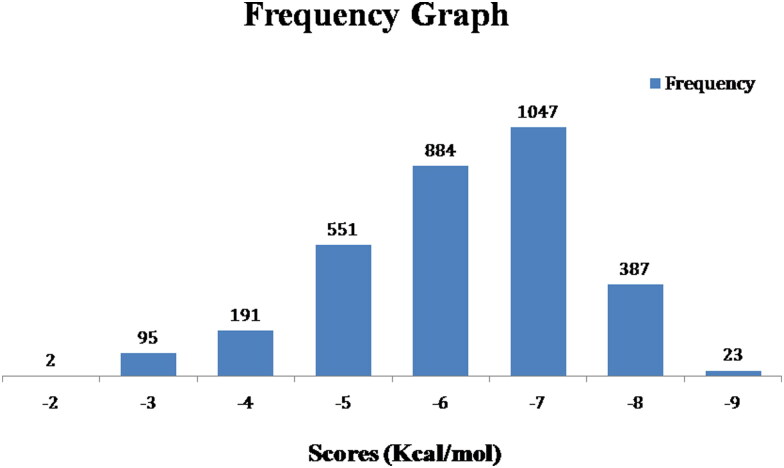
Further, to screen new drug compounds, targeting the Mpro enzyme of COVID-19, a molecular docking study was performed over 3180 compounds by using PyRx. The re-docking was also performed to validate the docking accuracy of the software PyRx, resulted in the binding of the ligand in the same position and orientation with the almost similar binding score. This verified that the selected docking parameters were optimal. Docked compounds are ranked based on their docking score. The frequency graph of all the docked compounds is given in Figure 3. Docking results revealed that 23 Compounds out of 3180 had binding energy between the range of −9.0 kcal/mol to −9.4 Kcal/mol, which was lower or equivalent to binding energy the reference (X77) (-8.4 kcal/mol).
Figure 3.
Frequency distribution graph of 3180 docked compounds over the range of docking scores.
Interestingly, several compounds showed comparatively better binding affinity. Compounds with lower binding energies with similar binding residue comparable to that of inhibitor X77 were considered better agents against the target protein. The binding energy of the top 10 hits is given in Table 1. Amongst all the compounds; ZINC03831201 has the lowest binding energy. In the present study, we focused on the top 10 docked compounds for further analysis as these drug compounds showing higher binding affinity ranging from (-9.4 to −9.0 kcal/mol).
Table 1.
Docking score of 10 hits FDA drugs, molecular formula and chemical structure.
| S.No. | Compound ID | Docking Score | Molecular Formula | Compound name | Chemical structure |
|---|---|---|---|---|---|
| 1 | ZINC03831201 | −9.4 | C30H24N4O10 | [5-hydroxy-3,4-bis(3-pyridylcarbonyloxy)- 5-(3-pyridylcarbonyloxymethyl) tetrahydrofuran-2-yl]methyl | 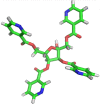 |
| 2 | ZINC03830385 | −9.2 | C26H27NO1 | Carminomycin |  |
| 3 | ZINC03830924 | −9.2 | C26H27NO9 | Idarubicin | 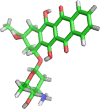 |
| 4 | ZINC08101052 | −9.2 | C43H66O14 | [3-hydroxy-6-[4-hydroxy-6-[4-hydroxy- 6-[[14-hydroxy-10,13-dimethyl-17- (5-oxo-2H-furan-3-yl)-1,2,3,4, |  |
| 5 | ZINC03831508 | −9.2 | C32H32O13S | [9,10-dihydroxy-3-(2-thienyl)-2,4, 7-trioxabicyclo[4.4.0]dec-8-yl]oxy- (4-hydroxy-3,5-dimethoxy-phenyl | 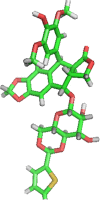 |
| 6 | ZINC01482077 | −9.1 | C27H33 N3O6S | Gliquidone |  |
| 7 | ZINC03830332 | −9.1 | C27H20N4O9S2 | 1-Naphthalenesulfonic acid, 4,4′-((2,4-dihydroxy-5-(hydroxymethyl)- m-phenylene)bis(azo))di-, disodium salt; 1-Naphthalenesulfonic acid, 4,4′-((2,4-dihydroxy-5-(hydroxymethyl)-1, 3-phenylene)bis(azo))bis-, disodium salt; 1538 Brown; 2,4-Dihydroxy-3,5-di(4- 0r LS-194959 |
 |
| 8 | ZINC03830817 | −9.1 | C29H32O13 | (4,5-dihydroxy-8-methyl-2,7,9-trioxabicyclo [4.4.0]dec-3-yl)oxy-(4-hydroxy-3, 5-dimethoxy-phenyl)-BLAH |  |
| 9 | ZINC03978083 | −9.1 | C37H41 N2O6+ | Tubocurarine chloride |  |
| 10 | ZINC11678097 | −9.0 | C30H24 N4O10 | (7R,9R)-9-acetyl-7-[(2S,4R,5S,6S)- 4-amino-5-hydroxy-6-methyl- tetrahydropyran-2-yl]oxy-4,6,9,11-tetra |  |
3.2. Molecular interaction of the top ligands with Mpro
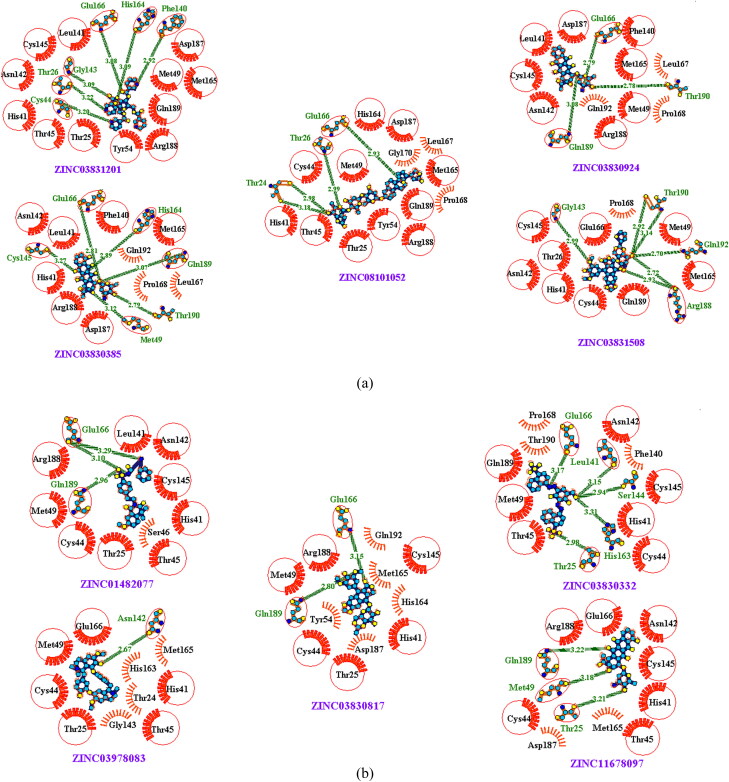
The 2 D interactions of the top 10 hits, as well as the reference compound, were visualized by using LigPlot + v.1.4.5 software. The docked poses demonstrate that the compounds bind within the active site of the SARS-CoV-2 Mpro macromolecular structure. From Figure 4, it has been noticed that the selected ligands interact with the catalytic site of Mpro. LigPlot depicts that the reference molecule X77(id-145998279) shows interaction with Mpro by several residues. It forms four hydrogen bonds Glu166, Cys145, Gly143, His163, and eleven hydrophobic bonds His164, Met165, Asp187, Arg188, Gln189 Thr25, His41, Phe140, Leu141, Asn142, Ser144 with Mpro and yields the binding energy −8.4 kcal/mol by docking. ZINC03831201 shows the highest binding affinity (-9.4 kcal/mol) and forms six hydrogen bonds His164, Glu166, Thr26, Phe140, Cys44 and, Gly143 with Mpro. ZINC03830385 interacted with several hydrophobic residues and make hydrogen bonds with active site residues Glu166, Gln189, Cys145, His164, Met49 and, Thr190. ZINC03830924 makes interaction with Mpro via hydrogen bonds Glu166, Gln189 and Thr190. ZINC08101052 shows interaction with Glu166, Thr24 and Thr26 by making hydrogen bonds with the active side of Mpro. ZINC03831508 forms hydrogen bonds with Gln192, Gly143, Thr190 and Arg188.
Figure 4.
(a and b). 2 D interaction of protein- ligand with H-bonds and Hydrophobic-bonds between the top hit ligands along with Mpro (In all compounds dotted green lines indicate the hydrogen bond, red sparked arc represent hydrophobic interaction and red circle and red ellipses represent common protein residue with reference).
ZINC01482077 interacted with Glu166 and Gln189 via two hydrogen bonds. ZINC03830332 showed hydrogen bonds with Leu141, His163, Ser144, Glu166 and Thr25 residues. ZINC03830817 formed hydrogen bonds with Glu166 and Gln189. ZINC03978083 made interaction via one hydrogen bond Asn142. Compound ZINC11678097 formed three hydrogen bonds Gln189, Met49, and Thr25 with active side residue of Mpro.2D Interactions details between the molecular target (Mpro) and top hits are given in Table 2.
Table 2.
2 D interactions of reference and top10 hit compounds with the SARS CoV-2 Mpro.
| S. No | Compounds | Amino acids involved in interaction through hydrogen bonding | No. of H-bonds | Common active site hydrogen bond residues as compared to reference(X77) | Hydrophobic contact |
|---|---|---|---|---|---|
| 1 | Reference | Glu166, Gly143, His163 Cys145, |
3 | Glu166, Gly143, His163 Cys145, |
Thr25, His41, Leu141, Asn142, Met165, His164 Asp187, Gln189, Thr26, Ser144, Phe140 |
| 2 | ZINC03831201 | His164, Glu166, Thr26, Phe140, Cys44, Gly143 | 6 | Glu166, Gly143 |
Thr25, His41, Leu141, Asn142, Cys145, Met165, Asp187, Arg188, Gln189, Thr45, Tyr 54, Met 49 |
| 3 | ZINC03830385 | Glu166, Gln189, Cys145, His164, Met 49, Thr190 | 6 | Glu166, Cys145 |
His41, Leu141, Asn142, Met165, Asp187, Arg188, Gln192, Leu167, Pro168, Phe140 |
| 4 | ZINC03830924 | Glu166, Gln189, Thr190 | 3 | Glu166 | Leu141, Asn142, Met165, Asp187, Arg188, Gln192, Leu167, Pro168, Phe140, Cys145, Met 49 |
| 5 | ZINC08101052 | Glu166, Thr24, Thr26, |
3 | Glu166 | Met165, Asp187, Arg188, Gln189, Leu167, Pro168, Cys44, Met 49, His41, Thr45, Thr25,Tyr54, Gly170,His164 |
| 6 | ZINC03831508 | Gln192, Gly143, Thr190, Arg188 | 4 | – | Met165, Gln189, Cys44, Cys145, Met 49, Thr26, His41, Asn142, Glu166, Pro168 |
| 7 | ZINC01482077 | Glu166, Gln189 | 2 | Glu166 | Arg188, Leu141, Cys44, Met 49, Thr45, Thr25, His41, Cys145, Ser46, Asn142 |
| 8 | ZINC03830332 | Leu141, His163, Ser144, Glu166, Thr25 | 5 | Glu166 | Gln189, Cys44, Met 49, Thr45, Thr190, His41, Cys145, Asn142, Pro168, Phe140 |
| 9 | ZINC03830817 | Glu166, Gln189 | 2 | Glu166 | Gln192, Cys44, Met 49, Met165, Thr25, Tyr54, His41, Cys145, Asp187,Arg188,His 164 |
| 10 | ZINC03978083 | Asn142 | 1 | – | Cys44, Met 49, Met165, Thr25, His41, His 163, Glu166, Thr24, Gly143, Thr45 |
| 11 | ZINC11678097 | Gln189 Met49 Thr25 |
3 | – | Cys44, Met165, His41, Glu166, Thr45, Asp187, Asn142, Arg188, Cys145 |
From the visualization study of all the ten hits, we observed that the compounds are generally surrounded by the residues similar to the reference, which suggests that these compounds can prevent the viral replication of SARS-CoV-2. From the findings, it can be seen that seven out of 10 hit compounds showed common interaction with Glu166 which was also involved in H-bond interaction with reference and Mpro. Therefore, these seven compounds were selected for further analysis.
3.3. Molecular dynamics simulation
The Molecular dynamic method was used to analyze the physical movements of atoms and molecules and to study the conformational changes on the atomic level. To assess the binding stability and determine binding-free energy against Mpro active site, seven compounds were subjected to a 100 ns molecular dynamics simulation. Further, to examine the protein stability and dynamic behavior throughout the simulation period, all the compounds were analyzed by the RMSD, RG, RMSF, SASA, and MMPBSA calculation. Analyzing the result of MD simulation, we found that four out of seven compounds showed better stability against Mpro enzyme. Therefore, the result of only four compounds namely; ZINC03831201 (L1), ZINC08101052 (L2), ZINC01482077 (L3), ZINC03830817 (L4) were presented in further studies.
3.3.1. Root mean square deviation (RMSD)
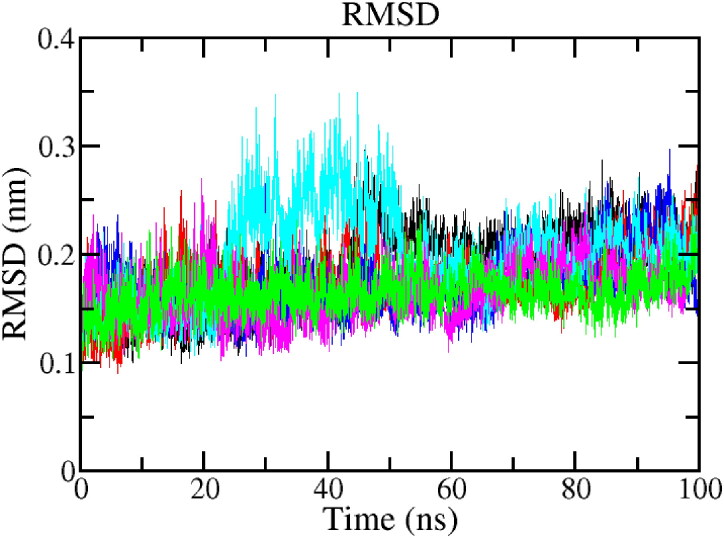
The variation of the all protein-ligand complex was determined by the root mean square deviation (RMSD) during the 100 ns MD simulation. The RMSD is a parameter used to measures the equilibration, protein flexibility, and the average distance between backbone atoms of a protein(Sargsyan et al., 2017). Figure 5 depicts the RMSD plot for native protein and all protein-ligand complexes. RMSD of alpha carbon was calculated for four systems. The entire complex remained stable throughout the simulations, which were calculated for the 100 ns trajectory. The native protein was showing stability in 100 ns simulation with an average RMSD 0.18 nm (Black). In the case of the bound system, the average value of RMSD was 0.17 nm (blue) for (Mpro-L1), 0.16 nm (green) for (Mpro-L2), 0.19 nm (cyan) for (Mpro-L3) and 0.16 nm (magenta) for (Mpro-L4) respectively as compared to the reference 0.17 nm (red). A slight fluctuation in the case of (Mpro-L3) complex was noted during 30 to 45 ns which achieved the equilibrium after 45 ns and remained stable throughout the simulation. Little fluctuations and fewer RMSD values were good indicators of system stability (Kuzmanic & Zagrovic, 2010). In conclusion, the RMSD fluctuation analysis suggests that the MD trajectories are overall stable and were in acceptable range during the simulation period for the entire studied complex.
Figure 5.
RMSD profile of native protein Mpro and all protein-ligand complexes for 100 ns of MD simulation period. Protein (black), protein-reference (X77-Mpro) (Red), Mpro-L1 (Blue), Mpro-L2 (Green), Mpro-L3 (cyan), Mpro-L4 (Magenta).
3.3.2. Root mean square fluctuation (RMSF)
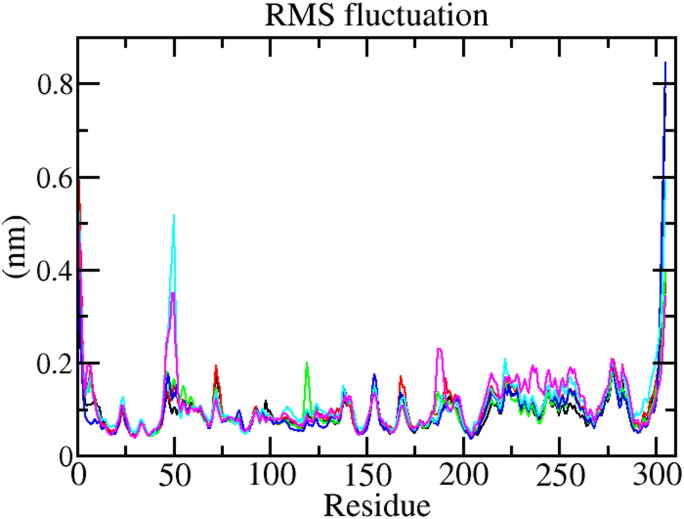
Root Mean Square Fluctuation (RMSF) was used to measure the average movement of the position of atom at a specific temperature and pressure. RMSF analyzes the regions of structures that are fluctuating to the overall structure or specifies a flexible region of the protein. Higher RMSF values indicate greater flexibility during the MD simulation while the lower value of RMSF reflects the good stability of the system. The fluctuations in the constituent residues were observed for protein Mpro and all complexes during the 100 ns trajectory period and plotted to compare the flexibility of each residue in protein and the complexes (Figure 6). Mpro-L3 and Mpro-L4 yielded little fluctuations at Met49, Leu50, and Asn51 residue. Otherwise, the fluctuation during all protein-ligand interaction was below 0.2 nm which is perfectly acceptable. In conclusion, it indicated that RMSF of all complexes is significantly similar compared to reference resulting in less fluctuation and good stability.
Figure 6.
The graphs representing the RMSF values of Cα atoms for 100 ns trajectories. The color code for all panels is Protein (black), protein-reference (X77-Mpro) (Red), Mpro-L1 (Blue), Mpro-L2 (Green), Mpro-L3 (cyan), Mpro-L4 (Magenta).
3.3.3. Radius of gyration (Rg)
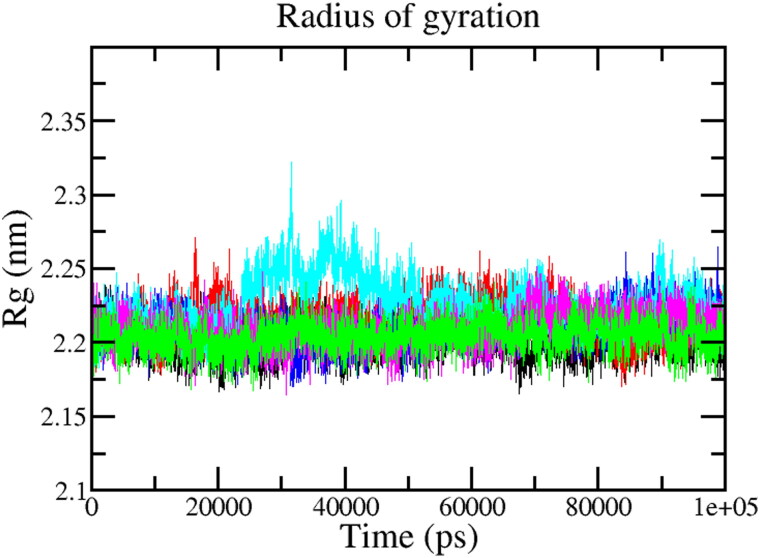
The radius of gyration (Rg) enables us to assess the compactness changes of a ligand-protein complex. In conclusion, Higher the Rg lower the compactness of ligand-protein complex. Rg is used to determine whether the complexes are stably folded or unfolded during the MD simulation. The average Rg value of native protein Mpro was calculated to be around 1.8 ± 0.05 (Black). Furthermore, the average Rg values of Mpro-L1, Mpro-L2, Mpro-L3 and Mpro-L4 complex were 1.8 ± 0.07 nm, 1.8 ± 0.07 nm, 1.9 ± 0.06 nm, and 1.8 ± 0.08 nm respectively, which is significantly similar as compared to reference 1.8 ± 0.08 nm molecule (Figure 7). As stated earlier, If protein will likely maintain a relatively steady value of Rg throughout the MD simulation it can be regarded as stably folded, and if its Rg changed over time, it would be considered unfolded (Ghasemi et al., 2016). As a result, it can be observed, that each complex exhibited relatively similar behavior of compactness and consistent values of Rg as compared to the native and reference. It indicates that these are perfectively superimposed with each other and have excellent stability (Table 3).
Figure 7.
Plots of Radius of Gyration reflecting the changes observed in the conformational behavior of the protein and all protein-ligand complexes for 100 ns of MD simulation. Protein (black), protein-reference (X77-Mpro) (Red), Mpro-L1 (Blue), Mpro-L2 (Green), Mpro-L3 (cyan), Mpro-L4 (Magenta).
Table 3.
The average values of different parameters, RMSD, Rg, RMSF, and SASA.
| S.No | Complex | Average RMSF (nm) | Average RMSD (nm) | Average Rg (nm) | Average SASA (nm2) | Interaction Energy (kJ/mol) |
|---|---|---|---|---|---|---|
| 1 | Native Mpro | 0.09 ± 0.02 | 0.18 ± 0.03 | 1.8 ± 0.05 | – | – |
| 2 | Reference (XX7)-Mpro | 0.10 ± 0.03 | 0.17 ± 0.02 | 1.8 ± 0.08 | 149.2 ± 2.1 | −137.521 |
| 3 | (L1)ZINC03831201-Mpro | 0.09 ± 0.03 | 0.17 ± 0.02 | 1.8 ± 0.07 | 150.6 ± 2.0 | −120.569 |
| 4 | (L2)ZINC08101052-Mpro | 0.09 ± 0.03 | 0.16 ± 0.01 | 1.8 ± 0.07 | 151.5 ± 2.0 | −164.464 |
| 5 | (L3)ZINC01482077-Mpro | 0.11 ± 0.04 | 0.19 ± 0.03 | 1.9 ± 0.06 | 152.1 ± 2.2 | −168.923 |
| 6 | (L4)ZINC03830817-mpro | 0.10 ± 0.04 | 0.16 ± 0.01 | 1.8 ± 0.08 | 150.4 ± 2.2 | −158.354 |
3.3.4. Solvent accessible surface area (SASA)
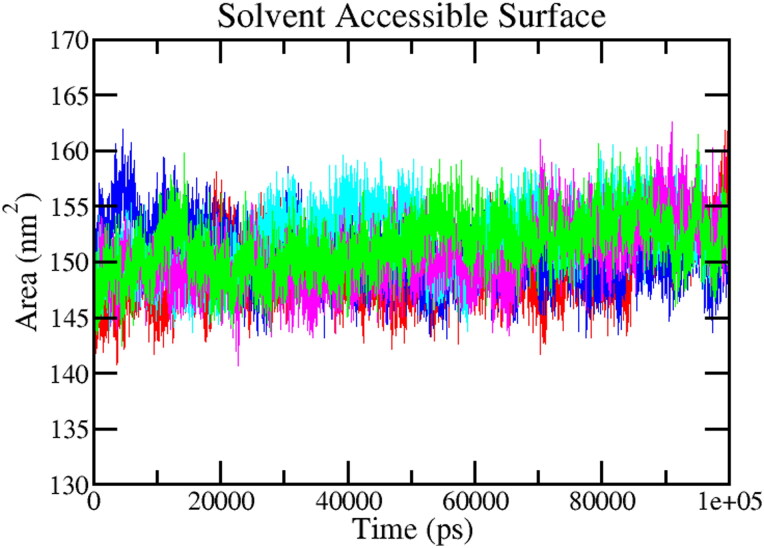
Solvent accessible surface area (SASA) measures the interaction between complexes and solvents. SASA of the ligand-protein complexes were calculated for predicting the extent of the conformational changes that occurred during the interaction. Figure 8 shows the plot of SASA value vs. time for all the protein-ligand complexes. The average SASA value150.6 ± 2.0nm2 was calculated for complex Mpro-L1 and likewise, complex Mpro-L2, Mpro-L3, and Mpro-L4 showed the average value151.5 ± 2.0 nm2, 152.1 ± 2.2 nm2 and 150.4 ± 2.2 nm2 respectively, which were significantly better as compared to the reference (X77-Mpro) 149.2 ± 2.1 nm2 (Red).The average value of SASA was signified in Table 2. These calculations showed that all the complexes have a significantly similar value of SASA as the reference complex.
Figure 8.
SASA curves showing the variation in the solvent accessibility of the studied protein complexes during the 100 ns MD simulations. protein-reference (X77-Mpro) (Red), Mpro-L1 (Blue), Mpro-L2 (Green), Mpro-L3 (cyan), Mpro-L4 (Magenta).
So, we observed that the SASA values for these two protein-ligands complexes during 100 ns MD simulation are relatively stable, indicating no significant changes in the protein structure.
3.3.5. Interaction energy
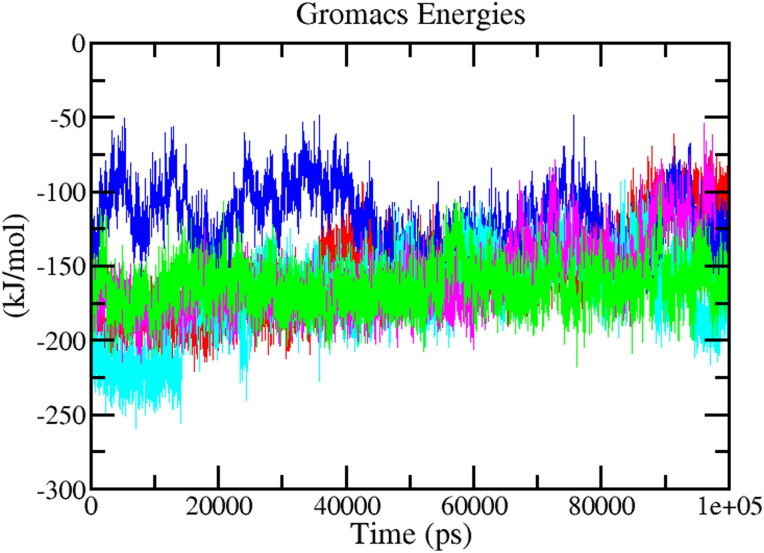
The interaction energy determines the strength of protein-ligand complex systems. To validate the binding energy generated by molecular docking studies, a detailed analysis was performed regarding the calculation of the free energies of interaction associated with the binding of ligands compounds with the structure of protein Mpro using Parrinello–Rahman parameter implemented in GROMACS. The average interaction energy of all the complexes was observed in the acceptable range of −100 to −200 kJ mol−1 in 100 ns simulation period. Average interaction energy for reference X77-Mpro was −137 kJ/mol and for the Mpro-L3 complex interaction energy was found to be highest which was around −168 kJ/mol and for Mpro-L2 complex interaction energy was calculated-164 kJ/mol followed by Mpro-L4 complex (-158 kJ/mol) and Mpro-L1 (-120 kJ/mol) (Figure 9).
Figure 9.
The curve is showing the behavior of the interactions in the form of free energies of binding between the protein and reference molecules (X77-Mpro) (Red), Mpro-L1 (Blue), Mpro-L2 (Green), Mpro-L3 (cyan), Mpro-L4 (Magenta).
These interaction energy calculations validated the molecular docking results and indicating that these compounds were favorable binding with Mpro and can act as a potential drug candidate.
3.3.6. Hydrogen bonding analysis
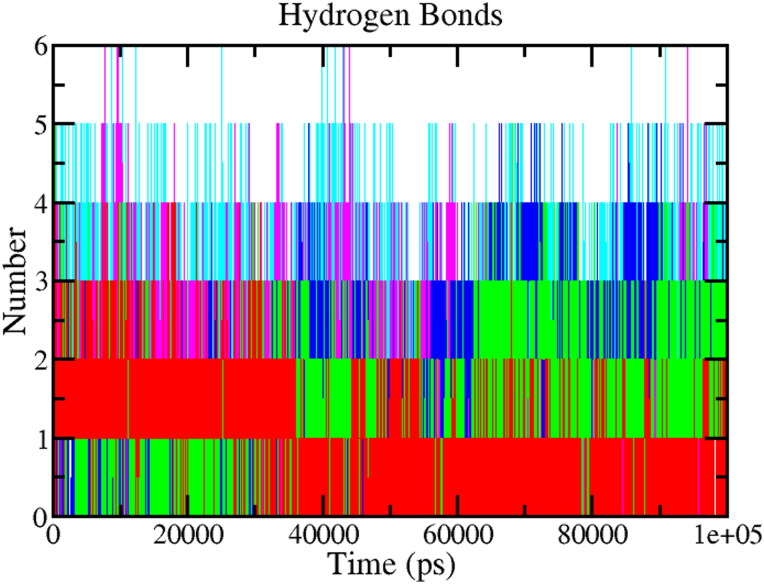
Hydrogen bonding between a ligand and receptor is essential for stabilizing the ligand-protein complex (Chen et al., 2016). It is also responsible for drug specificity, metabolization, and adsorption in drug design. The hydrogen bonds between each ligand-protein complex were also examined. Figure 10 displays the total number of hydrogen bonds present in the complexes, which were calculated after the 100 ns simulation period. Analyzing the reference complex, around four hydrogen bonds (Red) were observed in the complex. At the same time, Mpro-L1 was found to establish five (Blue) hydrogen bonds and five (Green) hydrogen bonds were observed in the complex Mpro-L2. Complex Mpro-L3 and Mpro-L4 were found to establish six hydrogen bonds. Through the above detail H-bond analysis, we can conclude that both the compounds were bound to the Mpro as effectively and tightly as the reference drug, X77.
Figure 10.
Diagram representing the dynamics observed in the hydrogen bonding patterns for protein-reference (X77-Mpro) (Red), Mpro-L1 (Blue), Mpro- L2 (Green), Mpro- L3 (cyan), Mpro-L4 (Magenta).
3.3.7. Principal component analysis (PCA)
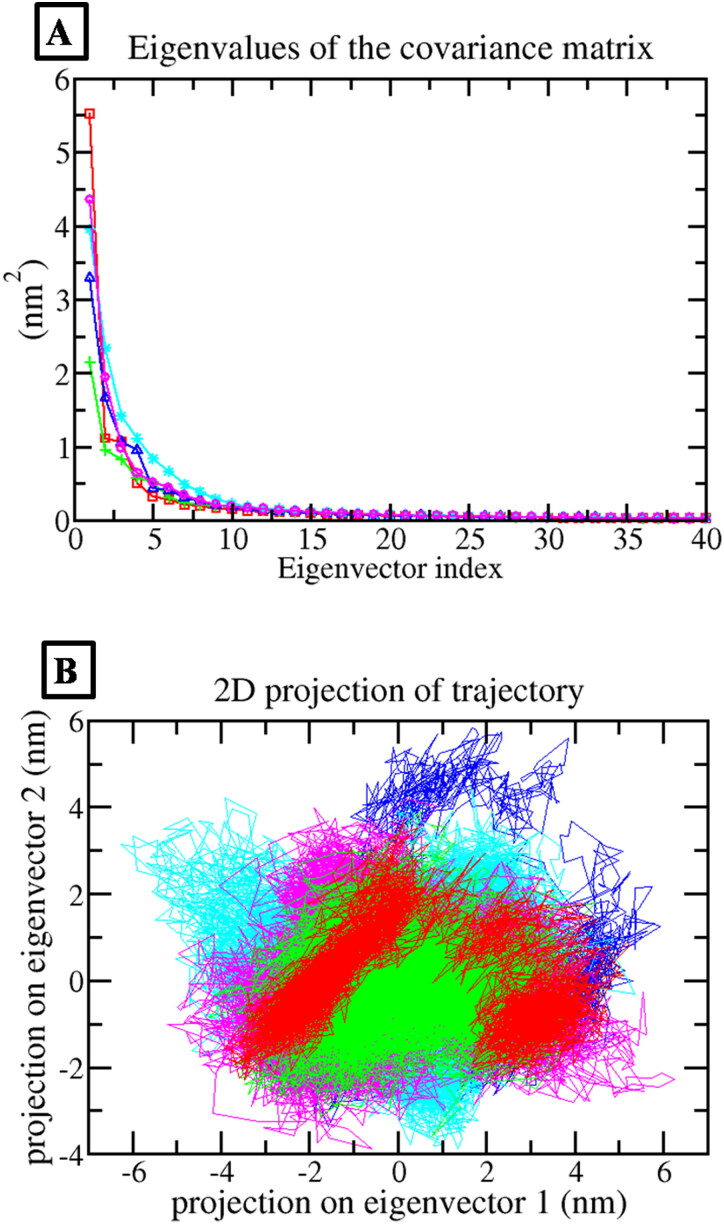
To perform PCA, The eigenvectors, eigenvalues, and their projection were calculated using the essential dynamics (ED) method. PCA helps to determine the most significant motion in dynamics trajectory (David & Jacobs, 2014). PCA was carried out to investigate the significant motions during ligand binding in different complexes. From the study, it is well known that the first few eigenvectors determined the overall motion of the protein. After removing the rotational and translational movements in PCA analysis, a variance/covariance matrix was constructed from the trajectories. By diagonalizing the matrix, a set of eigenvectors was calculated. The motions for the first ten eigenvector were accounted 71% for Mpro-L1, 63% for Mpro-L2, 75% for Mpro-L3 and 72% for Mpro-L4 complex for 100 ns simulation period (Figure 11(a)).
Figure 11.
Principal Component Analysis (a) The Plot of eigenvalues vs. first 40 eigenvectors, (b) First two eigenvectors describing the protein motion in phase space for all the complexes. Protein-reference (X77-Mpro) (Red), Mpro-L1 (Blue), Mpro- L2 (Green), Mpro-L3 (cyan), Mpro-L4 (Magenta).
The dynamics of complexes can also be achieved by generating a 2 D projection plot in PCA (Figure 11(b)). For this study, we selected the first two principal components (PCs) i.e. PC1 and PC2 to investigate the significant motions. It was observed that the complex which occupies less phase space with a stable cluster represented a more stable complex while the complex which occupies more space with a non-stable cluster represented a less stable complex.
These plotted data showed that the entire complex showed a very stable cluster and occupied less phase space than the reference. The reference compound X77-Mpro (red) also showed a stable cluster.
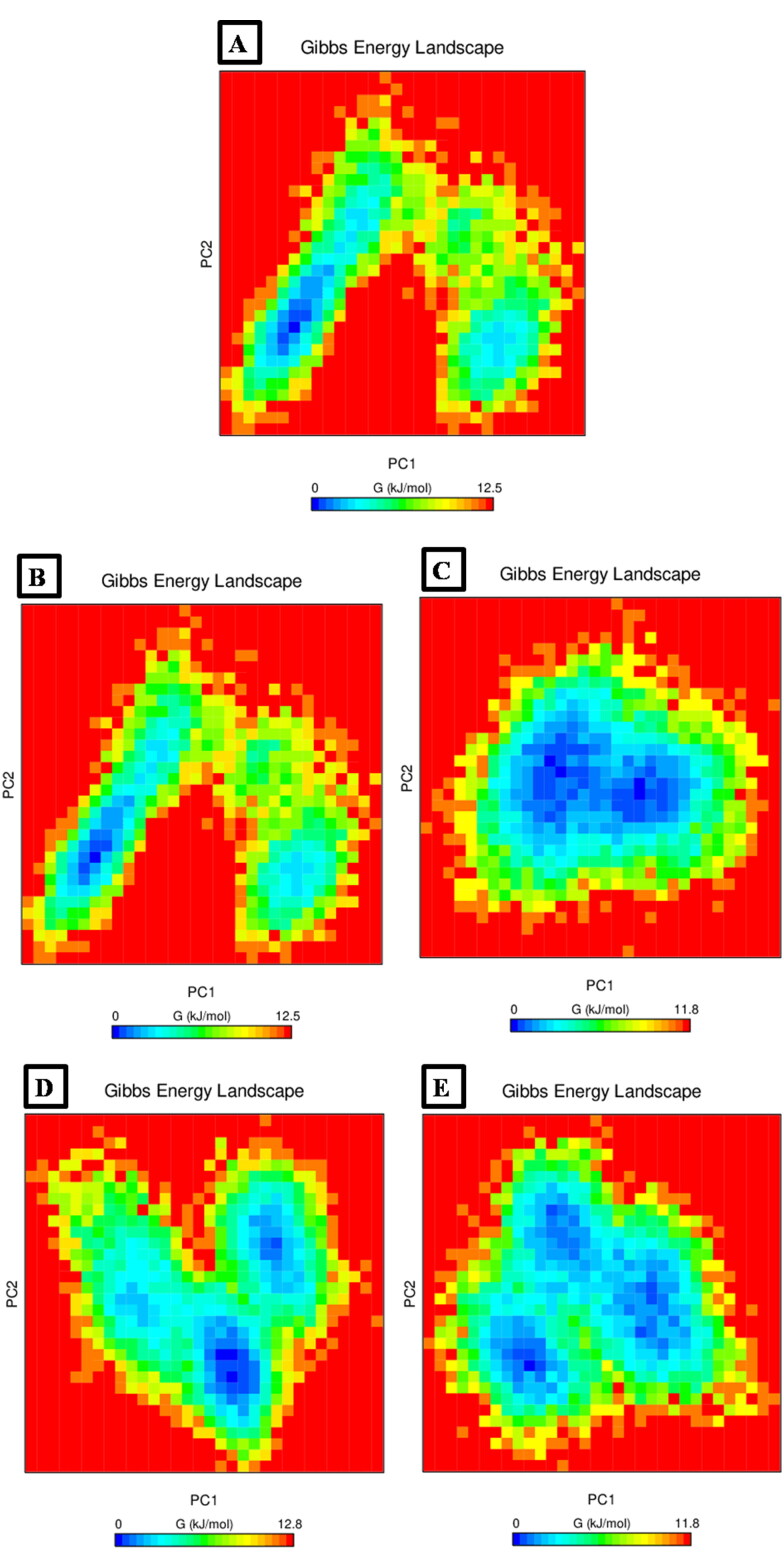
Figure 12 shows the Gibbs energy landscape plot for PC1 and PC2. The plot shows similar Gibbs energy value ranging from 0 to 12.5 for both Mpro-X77 and complex Mpro-L1, for MPro-L2 Gibbs energy is 0 to 11.8 kJ/mol, for Mpro-L3 Gibbs energy is 0 to 12.8 and for Mpro-L4 Gibbs energy is 0 to 11.8 kJ/mol, respectively. Compounds had lower or significant energy as compared to the reference. This showed that these complexes could follow energetically more favorable transition from one conformation to another as compared to the reference and were thermodynamically favorable.
Figure 12.
Gibbs free energy landscape (a) reference (X77-Mpro) complex (b) Mpro- L1complex (c) Mpro-L2 complex (d) Mpro-L3 complex (e) Mpro-L4 complex.
3.3.8. Binding free energy
The binding free energy (MM-PBSA) of the last 40 ns was calculated from MD trajectories using MM–PBSA method implemented in GROMACS. The total binding energies of all the complexes were observed in the acceptable range. The results of MM-PBSA are given in Table 4. In particular, complex Mpro-L3 depicted the lowest binding free energy and higher binding affinity with Mpro enzyme (-89.6 kJ mol−1), suggesting a more stable ligand conformation. On the other hand, complex Mpo-L2 and Mpro-L4 showed the binding free energy −77.7 kJ mol−1 and −28.0 kJ mol−1, which were better than the reference (-17.3). These free energy calculations validated the molecular docking results, showing that these molecules were favorably binding to the Mpro and could be used as lead compounds.
Table 4.
Table representing the Van der Waal, electrostatic, polar salvation, SASA and binding energy for protein-ligand complexes.
| Protein-Ligand Complex | van der Waal Energy (KJ/mol) | Electrostatic Energy (KJ/mol) | Polar salvation energy (KJ/mol) | SASA energy (KJ/mol) | Binding Energy (KJ/mol) |
|---|---|---|---|---|---|
| (X77-Mpro) (Ref) | −46.998 ± 75.546 | −2.828 ± 5.423 | 38.145 ± 48.766 | −5.629 ± 9.024 | −17.309 ± 50.012 |
| Mpro-ZINC03831201 | −19.278 ± 50.288 | −6.515 ± 16.919 | 37.473 ± 80.892 | −2.413 ± 6.656 | 9.268 ± 65.236 |
| Mpro-ZINC08101052 | −167.732 ± 49.651 | −24.121 ± 12.011 | 135.531 ± 45.527 | −21.441 ± 6.241 | −77.763 ± 45.793 |
| Mpro-ZINC01482077 | −144.577 ± 61.207 | −41.495 ± 20.526 | 110.310 ± 60.944 | −13.845 ± 5.932 | −89.606 ± 39.687 |
| MproZINC03830817 | −103.877 ± 77.320 | −14.969 ± 14.955 | 103.737 ± 82.749 | −12.943 ± 9.625 | −28.052 ± 51.248 |
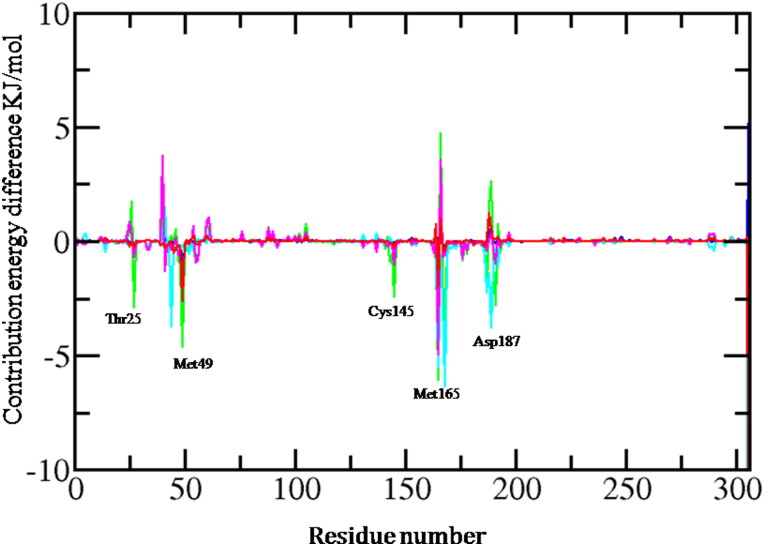
For identifying the key residues involved in ligand binding toward protein, per residue interaction, energy profile was created using the MM-PBSA method for the last 40 ns of MD trajectories and the active site residues are shown in Figure 13. From the graph, it was observed that His41, Ala191, Thr25, Leu27, Met49, Phe140, Leu141, Ser144, Cys145, His163, Met165, and Asp187 were the actively participating amino acid residues in all the predicted hits. The per residue interaction profile showed that most of the residues showed a negative binding affinity, which played an essential role in stabilizing the protein-ligand complex, in contrast, few residues showed a positive binding affinity. The residues that showed a negative binding Active site residue Thr25, Met49, Cys145, Asp187, and Met165 showed higher binding affinity than other residues. The results revealed that Thr25, Met49, Cys145, Asp187, and Met165 play an essential role in protein-ligand stabilization.
Figure 13.
The contributions of individual amino acid residues of Mpro to the total binding energies of Mpro-ligand complexes. Protein-reference (X77-Mpro) (Red), Mpro-L1 (Blue), Mpro- L2 (Green), Mpro- L3 (cyan), Mpro- L4 (Magenta).
4. Discussion
Since December 2019, SARS-CoV-2 has caused a massive health crisis and death worldwide and there is no efficient therapy for the treatment of infected people. For finding a potential inhibitors against SARS-CoV-2, drug repurposing may be a good approach to investigate potential drug candidates. Here, we adopted this technique to find some effective drugs against SARS-CoV-2 and to overcome its infection. Many computational studies have been used in drug discovery against several diseases including SARS CoV proteases (Liu & Zhou, 2005; Sirois et al., 2004), and Hepatitis C virus RNA-dependent RNA polymerase (Elhefnawi et al., 2012). In this work, we used the resolved COVID-19 crystal structure of the Main protease to find suitable compounds. Mpro is an attractive drug target among coronaviruses as it involves in processing the polyproteins and it has been used in several studies.
Previous investigations have elicited that the lopinavir is an effective treatment according to the experience accumulated from the SARS and MERS outbreaks (Yao, Qian, Zhu, Wang, & Wang et al., 2020). Recent evidence of in vitro study also suggests that lopinavir has antiviral activity against the Mpro of SARS-CoV-2 (Caly et al., 2020). In another case report, Remdesivir that exhibits broad-antiviral activities against RNA viruses also may constitute a potential treatment option against the Mpro of SARS-CoV-2.
In this report, we conducted a drug repurposing to find effective drugs against the Mpro. In our study, we used a structure-based virtual screening method for 3180 FDA-approved drugs from the ZINC database. Further, the docking hits were applied for molecular dynamics (MD) simulations and the result was analyzed by different parameters RMSF, SASA, Rg, interaction energy, PCA, and MMPBSA. Therefore, the current study was undertaken to analyze the behavior of the complex using the protein-ligand complex against Mpro of COVID-19.
Molecular docking studies have revealed that most screened compounds show strong interaction with higher binding affinities. We observed that their docking scores ranging from −0.9 to −9.4 kcal/mol. In this study, we focused on the top 10 docking results for further analysis as these drug compounds showing the higher binding affinity and share the same binding pocket with similar interacting amino acid residues of SARS-CoV-2 Mpro protein. The Mpro is a homodimeric, cysteine protease containing Cys145 and His41 residues in its catalytic dyad. It consists of three domains domain I, domain II and domain III that contain residues 8–101, residues 102–184, and residues 201–303 respectively. Domains II and III are connected by a loop formed by residues 185 to 200. The substrate binds to the cleft between domains I and II, whereas domain III is involved in regulating M-pro dimerization (Wu et al., 2020). The binding area is surrounded by hydrophilic and hydrophobic amino acid residues with two negatively charged residues, Glu-166 and Asp-187, and one positively charged residue, Arg-188(Yang et al., 2003). Other important subsites at the M-pro binding site are S3, S2, S1, and S1.
In S1 pocket of Mpro, Glu166 uses its main chain nitrogen and oxygen atoms to effect hydrogen bond interactions with all the co-crystallized ligands (Wang et al., 2020). In fact, in this study, at least half of the compounds interact with this residue. The SARS-CoV-2 bound ligand (X77) shows strong bond interactions with Thr25, His41, Leu141, Asn142, Met165, His164, Asp187, Gln189, Thr26, Ser144, and Phe140 where it forms Hydrogen bonds with active site Glu166, Gly143, His163, and Cys145. The docking study showed that most of the screened compounds interact with Glu166 (also form strong hydrogen bonding), Gln189, Leu167, Met165, Asp187, Met49, His41, Cys145, and Leu141. According to some reports the residue Glu-166 in the main protease is known to be involved in the formation of its functional dimeric form (Anand et al., 2003). In visualization, it can be seen (Figure 4) that the interaction with Glu166 had the highest interaction rate. This residue interacts with seven ligands out of the top 10. The high number of interactions between these residues suggests that it plays a key role in the binding of compounds. Therefore, the top 7 drugs that exhibit the interaction with the same amino acid residues (Glu166) as of the reference are subjected to 100 ns simulation process.
MD simulation results indicate that out of seven compounds, four compounds namely ZINC03831201 (L1), ZINC08101052 (L2), ZINC01482077 (L3), and ZINC03830817 (L4) exhibits better stability with Mpro. The RMSD plot suggests that all four compounds are stable throughout the simulations and RMSD values did not show any sudden surge or sliding throughout the simulations. However, compound ZINC01482077 shows some fluctuation but becomes stable after 30-45 ns. RMSF was calculated for Mpro with 306 amino acids and four potential compounds. It provides information regarding the stability of the complex. High fluctuations indicate more flexibility and more unstable bonds. RMSF analysis confirmed that the binding site residues of L1 and L2 complex showed less fluctuation. Around 0.2 nm fluctuations were observed in the L3 and L4 complex among the Met48 and Leu49 residues, respectively. However, these amino acid residues are not involved in ligand interactions. The fluctuation during all interaction was below 0.2 nm, which are perfectly acceptable.
The radius of gyration (Rg) of the protein and ligand complexes was found to be similar for all the complexes. It suggests that each complex exhibited relatively similar behavior of compactness and consistent values of Rg as compared to the native and reference. It indicates that these are perfectively superimposed with each other and have excellent stability. To further explain the conformational stability, the total number of hydrogen bonds was analyzed. It indicates that the protein and ligand complex show strong bonding interactions throughout the 100 ns of the MD simulations. To investigate the atomic motions during ligand binding in different complexes, the principal component analysis (PCA) is performed from the trajectories. The PCA results indicated that all the ligand complex shows compactness, which implicates higher stability seen over the protein-ligand interactions.
To determine the strength of protein-ligand complex systems interaction energy was calculated for the entire complex. Among the entire complexes, L3 was showed the highest average interaction energy i.e. −168.92 kJmol−1 followed by L2 (-164.46 kJ mol−1), L4 (-158.35 kJ mol−1), and L1 (-120.56 kJ mol−1) respectively. These results revealed that all complexes have better interaction energy than the reference (-137.52 kJ mol−1).
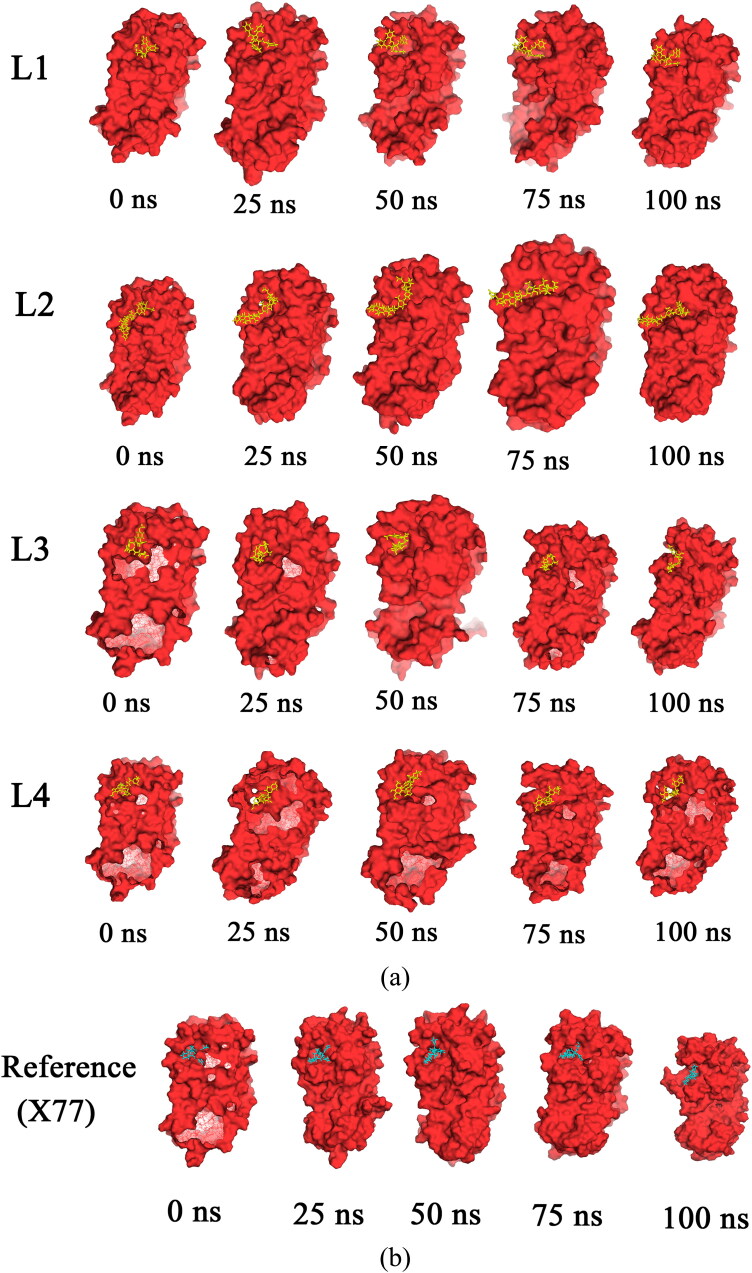
Furthermore, snapshots of all four compounds were extracted at 100 ns time intervals. The result reveals that the selected four compounds and reference most of the time stayed in the binding site of the protein during the 100 ns simulation period (Figure 14).
Figure 14.
Binding pose of (a) selected four ligands (b) reference (X77), over the course of 100 ns MD simulation.
To validate the docking energy of the protein-ligand complex, MM-PBSA calculation was performed using the last 40 ns of MD trajectories. The identified top compounds presented comparatively better MM-PBSA scores as compared to the reference. The calculated binding free energy of these compounds was L2 (−77.763), L3 (−89.606), and L4 (−28.052), respectively, which was better than the reference (-17.309) and therefore they represent excellent candidates for further investigation in vitro analysis. The only exception is L1 complex, which showed slightly lower MMPBSA values despite its remarkable RMSD and visual analysis results. From, per residue interaction energy profile, it can be concluded that residues Thr25, Met49, Cys145, Asp187, Leu167, Ala191, and Met165 play an essential role in protein-ligand stabilization and making significant contributions to the binding of ligands. By analyzing the binding energy and stability through dynamic simulation, we have shown that L2, L3, and L4 may be the potential inhibitors of the Mpro enzyme. However, we believe that all these compounds should furthermore be tested and their in vitro inhibitory potential needs to be investigated.
5. Conclusion
This study aims to identify novel inhibitor molecules against the main protease of SARS-CoV-2. Herein, molecular docking and MD simulation were successfully performed to discover novel inhibitors of Mpro based on the drug repurposing strategy. A set of 3180 compounds from Zinc database was screened by the Molecular docking method. Finally, the relative stability of seven-hit compounds was validated by MD run. Trajectories analysis showed that four out of seven complexes have displayed structural stability during the 100 ns MD simulation period. From this study, hit compounds ZINC08101052, ZINC03831201, ZINC01482077, and ZINC03830817 were obtained, which show promising high affinities against SARS-CoV-2. Thus, this study’s outcome shows that the antiviral activity of these hit compounds could pose a great deal of significance against COVID-19. These detailed analyses indicate that the computational drug repurposing approach is very efficient and it can provide potential repurposing drug candidates in a few days. This in silico study may offer the opportunity to explore these compounds against SARS-CoV-2.
Acknowledgements
The authors acknowledge the Department of Botany, Kumaun University, S.S.J Campus, Almora for providing basic facilities to conduct this research work. The authors also acknowledge Kumaun University, Nainital for providing high-speed internet facilities. We also extend our acknowledge to Rashtriya Uchchattar Shiksha Abhiyan (RUSA), Ministry of Human Resource Development, Government of India to provide Computational infrastructure for the establishment of the Bioinformatics Centre in Kumaun University, S.S.J Campus, Almora.
Disclosure statement
No potential conflict of interest was reported by the author(s).
References
- Agostini, M. L., Andres, E. L., Sims, A. C., Graham, R. L., Sheahan, T. P., Lu, X., Smith, E. C., Case, J. B., Feng, J. Y., Jordan, R., Ray, A. S., Cihlar, T., Siegel, D., Mackman, R. L., Clarke, M. O., Baric, R. S., & Denison, M. R. (2018). Coronavirus susceptibility to the antiviral remdesivir (GS-5734) is mediated by the viral polymerase and the proofreading exoribonuclease. mBio, 9(2). 10.1128/mBio.00221-18 [DOI] [PMC free article] [PubMed] [Google Scholar]
- Anand, K., Ziebuhr, J., Wadhwani, P., Mesters, J. R., & Hilgenfeld, R. (2003). Coronavirus main proteinase (3CLpro) structure: Basis for design of anti-SARS drugs. Science (New York, N.Y.), 300(5626), 1763–1767. 10.1126/science.1085658 [DOI] [PubMed] [Google Scholar]
- Caly, L., Druce, J. D., Catton, M. G., Jans, D. A., & Wagstaff, K. M. (2020). The FDA-approved drug ivermectin inhibits the replication of SARS-CoV-2 in vitro. Antiviral Research, 178, 104787. 10.1016/j.antiviral.2020.104787 [DOI] [PMC free article] [PubMed] [Google Scholar]
- Chen, D., Oezguen, N., Urvil, P., Ferguson, C., Dann, S. M., & Savidge, T. C. (2016). Regulation of protein-ligand binding affinity by hydrogen bond pairing. Science Advances, 2(3), e1501240. 10.1126/sciadv.1501240 [DOI] [PMC free article] [PubMed] [Google Scholar]
- David, C. C., & Jacobs, D. J. (2014). Principal component analysis: A method for determining the essential dynamics of proteins . Methods in Molecular Biology, 1084, 193–226. 10.1007/978-1-62703-658-0_11 [DOI] [PMC free article] [PubMed] [Google Scholar]
- DeLano, W. (2002). The PyMOL molecular graphics system. CCP4 Newsletter on Protein Crystallography, 40, 82–92. [Google Scholar]
- Elhefnawi, M., ElGamacy, M., & Fares, M. (2012). Multiple virtual screening approaches for finding new hepatitis C virus RNA-dependent RNA polymerase inhibitors: Structure-based screens and molecular dynamics for the pursue of new poly pharmacological inhibitors. BMC Bioinformatics, 13 (Suppl. 17), S5. [DOI] [PMC free article] [PubMed] [Google Scholar]
- Furuta, Y., Komeno, T., & Nakamura, T. (2017). Favipiravir (T-705), a broad spectrum inhibitor of viral RNA polymerase. Proceedings of the Japan Academy. Series B: Physical and Biological Sciences, 93(7), 449–463. 10.2183/pjab.93.027 [DOI] [PMC free article] [PubMed] [Google Scholar]
- Fuster, V., & Sweeny, J. M. (2011). Aspirin: A historical and contemporary therapeutic overview. Circulation, 123(7), 768–778. 10.1161/CIRCULATIONAHA.110.963843 [DOI] [PubMed] [Google Scholar]
- Ghasemi, F., Zomorodipour, A., Karkhane, A. A., & Khorramizadeh, M. R. (2016). In silico designing of hyper-glycosylated analogs for the human coagulation factor IX. Journal of Molecular Graphics & Modelling, 68, 39–47. 10.1016/j.jmgm.2016.05.011 [DOI] [PubMed] [Google Scholar]
- Ghofrani, H. A., Osterloh, I. H., & Grimminger, F. (2006). Sildenafil: From angina to erectile dysfunction to pulmonary hypertension and beyond. Nature Reviews. Drug Discovery, 5(8), 689–702. 10.1038/nrd2030 [DOI] [PMC free article] [PubMed] [Google Scholar]
- Gimeno, A., Ojeda-Montes, M. J., Tomas-Hernandez, S., Cereto-Massague, A., Beltran-Debon, R., & Mulero, M. (2019). The light and dark sides of virtual screening: What is there to know? International Journal of Molecular Sciences, 20(6), 1375. 10.3390/ijms20061375 [DOI] [PMC free article] [PubMed] [Google Scholar]
- Gralinski, L. E., & Menachery, V. D. (2020). Return of the Coronavirus: 2019-nCoV. Viruses, 12(2), 135. 10.3390/v12020135 [DOI] [PMC free article] [PubMed] [Google Scholar]
- Guan, W.-J., Ni, Z.-Y., Hu, Y., Liang, W.-H., Ou, C.-Q., He, J.-X., Liu, L., Shan, H., Lei, C.-L., Hui, D. S. C., Du, B., Li, L.-J., Zeng, G., Yuen, K.-Y., Chen, R.-C., Tang, C.-L., Wang, T., Chen, P.-Y., Xiang, J., … Zhong, N.-S, China Medical Treatment Expert Group for Covid-19 (2020). Clinical characteristics of coronavirus disease 2019 in China. The New England Journal of Medicine, 382(18), 1708–1720. 10.1056/NEJMoa2002032 [DOI] [PMC free article] [PubMed] [Google Scholar]
- Irwin, J. J., Sterling, T., Mysinger, M. M., Bolstad, E. S., & Coleman, R. G. (2012). ZINC: A free tool to discover chemistry for biology. Journal of Chemical Information and Modeling, 52(7), 1757–1768. 10.1021/ci3001277 [DOI] [PMC free article] [PubMed] [Google Scholar]
- Jorgensen, W. L., Chandrasekhar, J., Madura, J. D., Impey, R. W., & Klein, M. L. (1983). Comparison of simple potential functions for simulating liquid water. The Journal of Chemical Physics, 79(2), 926–935. 10.1063/1.445869 [DOI] [Google Scholar]
- Karplus, M., & McCammon, J. A. (2002). Molecular dynamics simulations of biomolecules. Nature Structural Biology, 9(9), 646–652. 10.1038/nsb0902-646 [DOI] [PubMed] [Google Scholar]
- Khan, S. A., Zia, K., Ashraf, S., Uddin, R., & Ul-Haq, Z. (2020). Identification of chymotrypsin-like protease inhibitors of SARS-CoV-2 via integrated computational approach. Journal of Biomolecular Structure and Dynamics, 1–10. [DOI] [PubMed] [Google Scholar]
- Kuzmanic, A., & Zagrovic, B. (2010). Determination of ensemble-average pairwise root mean-square deviation from experimental B-factors. Biophysical Journal, 98(5), 861–871. 10.1016/j.bpj.2009.11.011 [DOI] [PMC free article] [PubMed] [Google Scholar]
- Lan, L., Xu, D., Ye, G., Xia, C., Wang, S., Li, Y., & Xu, H. (2020). Positive RT-PCR test results in patients recovered from COVID-19. JAMA, 323(15), 1502. 10.1001/jama.2020.2783 [DOI] [PMC free article] [PubMed] [Google Scholar]
- Liu, B., & Zhou, J. (2005). SARS-CoV protease inhibitors design using virtual screening method from natural products libraries. Journal of Computational Chemistry, 26(5), 484–490. 10.1002/jcc.20186 [DOI] [PMC free article] [PubMed] [Google Scholar]
- O'Boyle, N. M., Banck, M., James, C. A., Morley, C., Vandermeersch, T., & Hutchison, G. R. (2011). Open Babel: An open chemical toolbox. J Cheminform, 3, 33. [DOI] [PMC free article] [PubMed] [Google Scholar]
- Palos, I., Lara-Ramirez, E. E., Lopez-Cedillo, J. C., Garcia-Perez, C., Kashif, M., Bocanegra-Garcia, V., Nogueda-Torres, B., & Rivera, G. (2017). Repositioning FDA drugs as potential cruzain inhibitors from Trypanosoma cruzi: Virtual screening. Molecules, 22(6), 1015. 10.3390/molecules22061015 [DOI] [PMC free article] [PubMed] [Google Scholar]
- Paraskevis, D., Kostaki, E. G., Magiorkinis, G., Panayiotakopoulos, G., Sourvinos, G., & Tsiodras, S. (2020). Full-genome evolutionary analysis of the novel corona virus (2019-nCoV) rejects the hypothesis of emergence as a result of a recent recombination event. Infection, Genetics and Evolution : journal of Molecular Epidemiology and Evolutionary Genetics in Infectious Diseases, 79, 104212. 10.1016/j.meegid.2020.104212 [DOI] [PMC free article] [PubMed] [Google Scholar]
- Pronk, S., Páll, S., Schulz, R., Larsson, P., Bjelkmar, P., Apostolov, R., Shirts, M. R., Smith, J. C., Kasson, P. M., van der Spoel, D., Hess, B., & Lindahl, E. (2013). GROMACS 4.5: A high-throughput and highly parallel open source molecular simulation toolkit. Bioinformatics (Oxford, England)), 29(7), 845–854. 10.1093/bioinformatics/btt055 [DOI] [PMC free article] [PubMed] [Google Scholar]
- Sargsyan, K., Grauffel, C., & Lim, C. (2017). How molecular size impacts RMSD applications in molecular dynamics simulations. Journal of Chemical Theory and Computation, 13(4), 1518–1524. 10.1021/acs.jctc.7b00028 [DOI] [PubMed] [Google Scholar]
- Sheahan, T. P., Sims, A. C., Graham, R. L., Menachery, V. D., Gralinski, L. E., & Case, J. B. (2017). Broad-spectrum antiviral GS-5734 inhibits both epidemic and zoonotic coronaviruses. Science Translational Medicine., 9(396) [DOI] [PMC free article] [PubMed] [Google Scholar]
- Sirois, S., Wei, D. Q., Du, Q., & Chou, K. C. (2004). Virtual screening for SARS-CoV protease based on KZ7088 pharmacophore points. Journal of Chemical Information and Computer Sciences, 44(3), 1111–1122. 10.1021/ci034270n [DOI] [PubMed] [Google Scholar]
- Thiel, V., Ivanov, K. A., Putics, Á., Hertzig, T., Schelle, B., Bayer, S., Weißbrich, B., Snijder, E. J., Rabenau, H., Doerr, H. W., Gorbalenya, A. E., & Ziebuhr, J. (2003). Mechanisms and enzymes involved in SARS coronavirus genome expression. The Journal of General Virology, 84(Pt 9), 2305–2315. 10.1099/vir.0.19424-0 [DOI] [PubMed] [Google Scholar]
- Trott, O., & Olson, A. J. (2010). AutoDock Vina: Improving the speed and accuracy of docking with a new scoring function, efficient optimization, and multithreading. Journal of Computational Chemistry, 31(2), 455–461. 10.1002/jcc.21334 [DOI] [PMC free article] [PubMed] [Google Scholar]
- Vanommeslaeghe, K., Hatcher, E., Acharya, C., Kundu, S., Zhong, S., Shim, J., Darian, E., Guvench, O., Lopes, P., Vorobyov, I., & Mackerell, A. D. (2010). CHARMM general force field: A force field for drug-like molecules compatible with the CHARMM all-atom additive biological force fields. Journal of Computational Chemistry, 31(4), 671–690. 10.1002/jcc.21367 [DOI] [PMC free article] [PubMed] [Google Scholar]
- Vincent, M. J., Bergeron, E., Benjannet, S., Erickson, B. R., Rollin, P. E., Ksiazek, T. G., Seidah, N. G., & Nichol, S. T. (2005). Chloroquine is a potent inhibitor of SARS coronavirus infection and spread. Virology Journal, 2, 69. 10.1186/1743-422X-2-69 [DOI] [PMC free article] [PubMed] [Google Scholar]
- Wallace, A. C., Laskowski, R. A., & Thornton, J. M. (1995). LIGPLOT: A program to generate schematic diagrams of protein-ligand interactions. Protein Engineering, 8(2), 127–134. 10.1093/protein/8.2.127 [DOI] [PubMed] [Google Scholar]
- Wang, M., Cao, R., Zhang, L., Yang, X., Liu, J., Xu, M., Shi, Z., Hu, Z., Zhong, W., & Xiao, G. (2020). Remdesivir and chloroquine effectively inhibit the recently emerged novel coronavirus (2019-nCoV) in vitro. Cell Research, 30(3), 269–271. 10.1038/s41422-020-0282-0 [DOI] [PMC free article] [PubMed] [Google Scholar]
- Wu, C., Liu, Y., Yang, Y., Zhang, P., Zhong, W., & Wang, Y. (2020). Analysis of therapeutic targets for SARS-CoV-2 and discovery of potential drugs by computational methods. Acta Pharm Sin B, [DOI] [PMC free article] [PubMed] [Google Scholar]
- Yang, H., Yang, M., Ding, Y., Liu, Y., Lou, Z., Zhou, Z., Sun, L., Mo, L., Ye, S., Pang, H., Gao, G. F., Anand, K., Bartlam, M., Hilgenfeld, R., & Rao, Z. (2003). The crystal structures of severe acute respiratory syndrome virus main protease and its complex with an inhibitor. Proceedings of the National Academy of Sciences of the United States of America, 100(23), 13190–13195. 10.1073/pnas.1835675100 [DOI] [PMC free article] [PubMed] [Google Scholar]
- Yao, T. T., Qian, J. D., Zhu, W. Y., Wang, Y., & Wang, G. Q. (2020). A systematic review of lopinavir therapy for SARS coronavirus and MERS coronavirus-A possible reference for coronavirus disease-19 treatment option. Journal of Medical Virology, 92(6), 556–563. 10.1002/jmv.25729 [DOI] [PMC free article] [PubMed] [Google Scholar]
- Zumla, A., Chan, J. F., Azhar, E. I., Hui, D. S., & Yuen, K. Y. (2016). Coronaviruses - drug discovery and therapeutic options. Nature Reviews. Drug Discovery, 15(5), 327–347. 10.1038/nrd.2015.37 [DOI] [PMC free article] [PubMed] [Google Scholar]


