Abstract
As of 2 September 2020, the 2019 novel coronavirus or SARS CoV-2 has been responsible for more than 2,56,02,665 infections and 8,52,768 deaths worldwide. There has been an urgent need of newer drug discovery to tackle the situation. Severe acute respiratory syndrome-associated coronavirus 3C-like protease (or 3CLpro) is a potential target as anti-SARS agents as it plays a vital role in the viral life cycle. This study aims at developing a quantitative structure–activity relationship (QSAR) model against a group of 3CLpro inhibitors to study their structural requirements for their inhibitory activity. Further, molecular docking studies were carried out which helped in the justification of the QSAR findings. Moreover, molecular dynamics simulation study was performed for selected compounds to check the stability of interactions as suggested by the docking analysis. The current QSAR model was further used in the prediction and screening of large databases within a short time.
Communicated by Ramaswamy H. Sarma
Keywords: SARS CoV-2, Covid-19, coronavirus, in silico, QSAR
Introduction
Since late fall 2019, there has been an outbreak of the novel acute respiratory disease known as coronavirus disease 2019 (COVID-19), which has spread rapidly around the globe (Del Rio & Malani, 2020). The disease has now been officially designated as severe acute respiratory syndrome-related coronavirus SARS-CoV-2 and has been declared a pandemic by the World Health Organization (WHO) (https://www.who.int/news-room/detail/27-04-2020-who-timeline—covid-19). SARS CoV-2 has caused much more fatalities in terms of infections, deaths and economic challenges than SARS-CoV in 2002–2003 (Lee et al., 2003; Peiris et al., 2003). Although, SARS CoV-2 (mortality rate ≤ 3%) is less pathogenic than SARS-CoV (mortality rate = 9.5% - 11%), the transmission rate of the former is rather high (>2% in case of SARS CoV 2) (Dömling & Gao, 2020). Both SARS CoV and SARS CoV-2 share similar structural trend having a single-stranded enveloped positive RNA which infects host cell for transmission (Fung & Liu, 2019). They have sequence similarity of about 76 to 78% for the whole protein and around 73% to 76% for the receptor binding domain (RBD) (Wan et al., 2020). Also, the SARS-CoV main protease (or 3C-like protease or 3CLpro) has 96.1% of similarity with the 2019-nCoV main protease. The sequence of the main protease (3CLpro) of SARS CoV-2 has only 12 out of 306 residues different from that of SARS-CoV, and thus, this can be used as a homologous target for drug screening and repurposing (Chen et al., 2020; Zhavoronkov et al., 2020). The present work targets C30 Endopeptidase commonly known as 3C-like proteinase or coronavirus 3C-like protease (3CLpro) or coronavirus main protease (Mpro) which cleaves the polyproteins into individual polypeptides essential for viral replication and transcription (Goetz et al., 2007; Thiel et al., 2003). 3CLpro is a homodimeric cysteine protease and is predicted to cleave 11 different polyproteins at 11 sites required for replication and transcription (Fan et al., 2004; Goetz et al., 2007).
Computational approaches are effective tools to find new drug targets and repurposing of existing drugs. Molecular modeling studies such as quantitative structure–activity relationships (QSAR) (Gramatica, 2020; Roy, 2018) is one of the effective methods in predicting compounds when there is a lack of data and proper experimental facilities. The method allows virtual screening of drug libraries to find suitable drug-target for a particular disease. Large number of candidate molecules available in the drug discovery pipeline face high failure rate at the later stages of drug development. This makes computational approaches inevitable for the early predictions of pharmacokinetic and pharmacodynamic end points, thus enabling the screening process and reducing the cost and time of high end experiments (Toropova, 2017).
In the present work, we have developed a 2D-QSAR model to determine the chemical features contributing to inhibition of SARS CoV 3CLpro. As discussed earlier, 3CLpro enzyme in both SARS CoV and in novel SARS CoV-2 has about 96% structural similarity; it can be believed that compounds inhibiting SAR CoV 3CLpro can also inhibit the SARS CoV-2 protein. We have taken a dataset of 104 compounds from different literatures as cited in Material and Methods section and determined the physicochemical features essential for their inhibitory activity (pIC50). Further, we have carried out molecular docking and molecular dynamics (MD) simulation studies to understand the molecular interactions between the small molecules and protein. Also, we have carried out large database screening and predicted about the possibility and characteristics of inhibition showed by the database molecules.
Material and methods
Dataset
The experimental IC50 of 104 SARS coronavirus 3CL protease inhibitors was taken from previously published literatures (Chen et al., 2005; Liu et al., 2014; Lu et al., 2006; Niu et al., 2008; Park et al., 2012; Tsai et al., 2006) and applied for 2D-QSAR studies to recognize the basic structural features in those molecules essential for inhibition of SARS coronavirus main protease 3CLpro enzyme. The experimental IC50 values were converted into negative logarithmic form (pIC50) and the converted form was used for QSAR modelling. The structures were prepared in MarvinSketch software (version 14.10.27) (http://www.chemaxon.com/) with proper aromatization and hydrogen bond addition, and then, used for further descriptor calculation.
Molecular descriptors
Molecular descriptors are mathematical values that describe the structures or shape of molecules, helping to predict the activity and properties of molecules without complex experiments. These are numbers containing structural information derived from the structural representation. In the present study, QSAR models were developed using a selected class of two-dimensional (2D) molecular descriptors. This involves E-state indices, connectivity, constitutional, functional, 2D atom pairs, ring, atom-centered fragments and molecular property descriptors calculated from the OCHEM platform (https://ochem.eu/home/show.do) and extended topochemical atom (ETA) indices (Roy & Ghosh, 2010) calculated from PaDel-Descriptor software (Yap, 2011). Any constant (variance < 0.0001), intercorrelated (|r| > 0.95) descriptors and other incompetent data were removed using an in-house software available at http://dtclab.webs.com/software-tools before model development. The final dataset comprised of 562 descriptors before data division and further model development.
Dataset splitting
Selection and division of dataset into training and test sets is one of the most important steps in QSAR modeling so as to generate a well validated model (Roy et al., 2008). The division should ensure that points representing both training and test set are well distributed within the whole descriptor space occupied by the entire dataset. In the present model, we have utilised the Modified k-Medoids (version 1.3) (http://teqip.jdvu.ac.in/QSAR_Tools/DTCLab) method of dataset division, where 75% of the dataset compounds were put in the training set and rest 25% were put in the test set. The k-medoids algorithm is a local heuristic method that runs just like k-means (where centroids are taken into consideration) clustering when updating the medoids. This method is designed to select k most middle objects as initial medoids. The process classifies a set of objects into clusters, so that the objects within a cluster are similar to each other but are dissimilar to objects present in other clusters (Park & Jun, 2009). After rearranging the whole dataset according to the cluster number with their corresponding activity values, the 75–25 ratio of training and test sets is obtained for further model development and validation purpose.
Variable selection and model development
Variable selection is a crucial step followed during QSAR model development that ensures the extraction of the most important and influential molecular or physical or chemical features as well as for the generation of a model with good statistical significance for both internal and external validation metrics. In the present case, at the initial stage we have employed Genetic Algorithm (GA) (Devillers, 1996) method in Double Cross Validation (DCV) (Roy & Ambure, 2016) platform to generate a reduced pool of 29 descriptors. Further, we have employed Best Subset Selection (BSS) method to generate a series of Multiple Linear Regression (MLR) models. Then, the final model was generated using Partial Least Squares (PLS) (Wold et al., 2001) regression method using descriptors selected from BSS.
Statistical validation parameters
Validation of a QSAR model is essential to understand the predictive ability of the model. Critical evaluation of the developed models involving internationally accepted internal and external validation parameters was done to examine the robustness in terms of fitness, stability and classical fitness measures and predictivity of the models. Statistical parameters like determination coefficient explained variance variance ratio (F) and standard error of estimate (s) were calculated. Other parameters including internal predictivity parameters such as predicted residual sum of squares (PRESS) and leave-one-out cross-validated correlation coefficient (Q2LOO) were also calculated along with external predictivity parameters like R2pred or and concordance correlation coefficient (CCC) (Roy & Mitra, 2011). Further, we have also calculated metrics (i.e. and Δ) for both training and test set compounds (Ojha et al., 2011). Validation using mean absolute error (MAE) based criteria for both external and internal validation was done (Roy et al., 2016). This was done since the based criteria do not always translate the correct prediction quality because of the influence of the response range as well as the distribution of the values of response in both the training and test set compounds (Roy et al., 2016).
Domain of applicability
According to the OECD guideline 3, any QSAR model should possess a defined applicability domain (AD). AD is a chemical space is defined by the structural information or molecular properties of the chemicals used in the model development purpose (Gadaleta et al., 2016). Compounds lying within the region of the chemical space as defined by the internal set of the model can only be properly predicted. In this work, we have used distance to model X (DModX) approach at 99% confidence level using SIMCA software (https://landing.umetrics.com/downloads-simca) to check whether the test set compounds are within the AD or not.
Molecular docking study
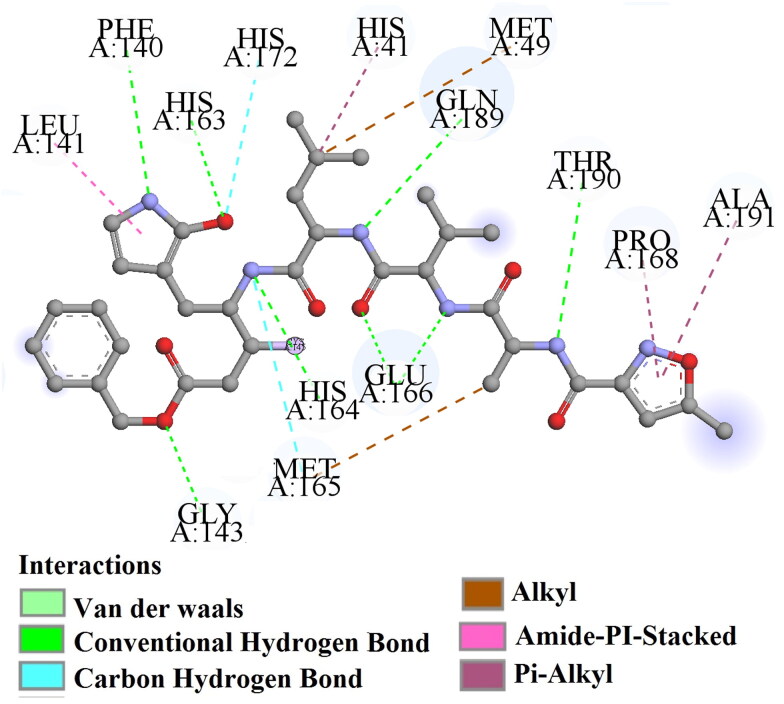
In the current analysis, we have implemented molecular docking studies to explore the interaction pattern of molecules (most and least actives from the dataset) with their relevant enzyme (3C-like protease). The crystal structure of the enzyme was retrieved from the protein databank with the PDB ID: 6LU7 (crystal structure of COVID-19 main protease in complex with an inhibitor N3) (Jin et al., 2020). The molecular docking study was performed by using Autodock tool 1.5.6 (http://autodock.scripps.edu/resources/adt.) platform following the protocol as discussed by the Rizvi et al. in 2013 (Rizvi et al., 2013; Kumar & Roy, 2020). Prior to docking, we have prepared the target enzyme and selected inhibitors using the protein and ligand preparation protocol available in Autodock tool 1.5.6 (http://autodock.scripps.edu/resources/adt.). The active site in the enzyme was defined by the providing explicit coordinates of active amino acids residues obtained from the co-crystal ligand in the enzyme using PDBsum web server (http://www.ebi.ac.uk/thornton-srv/databases/cgi-bin/pdbsum/GetPage.pl?pdbcode=2zu4&template=ligands.html&l=1.1).The size and the exact position of the grid was adjusted by providing the coordinates using the protocol ‘Grid preparation’ available in Autodock tool 1.5.6 (http://autodock.scripps.edu/resources/adt.). After completion of the receptor, ligand preparation and binding site definition, molecular docking runs were launched from the command line using cmd. In the docking analysis, we have sorted the generated poses as per binding interaction energy, and the top scoring poses (most negative) were kept for further analysis. The obtained poses were validated using the bound ligand present in the crystal structure of the enzyme. On the basis of number of interactions and active residues interacting with the bound ligand, we have selected the final pose for the further study. From the ligplot (Figure 1), we can see the number of interactions and active residues responsible for the significant interaction in crystal structure of COVID-19 main protease and with their bound ligand.
Figure 1.
Ligplot of 3CLpro enzyme and with their bound ligand.
MD simulation
MD simulation of protein–ligand complexes was performed in Gromacs software 2018.1 (Van Der Spoel et al., 2005). Protein topology was prepared using the CHARMM36 (March 2019) force field (Huang & MacKerell, 2013). Ligand topology was generated from the CHARMM General Force Field (CGenFF) server (Soteras Gutiérrez et al., 2016). Dodecahedron box was used to add explicit water molecules keeping protein-ligand complex at the center. The TIP3P water model used (Mark & Nilsson, 2001). An appropriate number of sodium ions were added to neutralize the charge of the system. Then, the system was energy minimized by using the steepest descent minimization algorithm to optimize the hydrogen bond network. This was followed by equilibration with NVT and NPT ensembles, respectively, for 100 ps to avoid distortion of a protein–ligand complex. Final production MD simulation of the protein complexes of two most active compounds and least active compounds, 57 & 66 and 16 & 27, respectively, was performed for 100 ns at 300 K temperature. In addition, protein complexes of another three most active and least active compounds 56, 58, 67, 21, 23 and 25 were chosen for MD simulation of 20 ns. Periodic boundary conditions were applied (Makov & Payne, 1995). Particle Mesh Ewald method was used for long-range electrostatic interactions (Petersen, 1995). Energy and co-ordinates of the system were recorded at every 10 ps. Hydrogen bond interaction analyses between protein and ligand during MD was performed in the Visual Molecular Dynamics (VMD) tool by keeping cut off of 3 Å distance and angle of 20° (Humphrey et al., 1996). Binding free energy (ΔGBind) of the ligands during MD simulation was calculated by the MMPBSA method (Kumari et al., 2014).
Results and discussions
The prime objective of the work was to develop a well validated QSAR model using simple descriptors obtained from PaDel-Descriptor and OCHEM platforms and utilizing them for the prediction of external set of compounds when adequate experimental data is not easily available. The present work consists of four phases: (1) development of a 2D-QSAR model against 3CLpro enzyme; (2) molecular docking and correlation of the results with the QSAR model; (3) MD simulation; and (4) screening of three databases for their inhibitory activity towards 3CLproenzyme.
QSAR modeling
The six descriptor PLS model (Model 1) developed for the dataset of 104 compounds was statistically significant and could precisely explain the essential features of the compounds required for good inhibition of 3CL protease. Acceptable values of the determination coefficient (0.756) and cross-validated determination coefficient ( =0.708) were obtained from the developed model. The predictivity of the model was analysed by predictive which shows acceptable predictivity for the test set compounds. The values of the descriptor appearing for both the training and test sets and also the predicted pIC50 are given in the supporting information. The observed pIC50 versus predicted pIC50 plot is given in Figure 2.
| (Model 1) |
Figure 2.
Observed vs. predicted pIC50 scatter plot.
The variable importance plot (VIP) along with a mechanistic interpretation provides a better knowledge about the descriptors and their contribution in controlling the inhibition of the 3CLpro enzyme. The descriptors appearing in the model according to VIP score are as follows: B04[O-Cl], nRCONHR, F01[C-N], ETA_dBeta, B05[C-N] and B06[N-N]. Descriptors having VIP > 1 like B04[O-Cl] and nRCONHR have higher significance than those having VIP < 1 (Akarachantachote et al., 2014). The descriptors from higher to lower contribution is given Figure 3. The model consists of four 2D atom pair descriptors, one ETA and one functional group descriptor as elaborated in Table 1. The regression coefficient plot (Wold et al., 2001) and the score plot (Jackson, 2005) are given in the supporting information (Figures S1 and S2, respectively).
Figure 3.
Variable importance plot of the final PLS model.
Table 1.
Definition and contribution of all descriptors obtained from the PLS models.
| Serial no. | Descriptor | Type of descriptor | Meaning | Contribution |
|---|---|---|---|---|
| 1 | B04[O-Cl] | 2D atom pair | Presence or absence of oxygen and chlorine (O-Cl) at the topological distance 4 | +ve |
| 2 | nRCONHR | Functional group counts | Number of secondary amides (aliphatic) | –ve |
| 3 | F01[C-N] | 2D atom pair | Frequency of C-N at the topological distance 1 | –ve |
| 4 | ETA_dBeta (Δβ) | Extended Topochemical Atom (ETA) | A measure of relative unsaturation content. It can be expressed using the following equation: Where represents VEM non-sigma contribution of a non-hydrogen vertex and represents VEM sigma contribution for a non-hydrogen vertex (Roy, 2015). |
+ve |
| 5 | B05[C-N] | 2D atom pair | Presence/absence of carbon and nitrogen (C-N) at topological distance 5 | +ve |
| 6 | B06[N-N] | 2D atom pair | Presence/absence of nitrogen and nitrogen (N-N) at topological distance 6 | +ve |
The different descriptors and their contributions to the modelled response give certain information about the structural and physicochemical features present in the dataset compounds useful for the inhibition of 3CLpro. The 2D atom pair descriptors F01[C-N], B05[C-N] and B06[N-N] help in understanding the structures of the compounds giving an idea that single nitrogen containing heteroaromatic ring like pyridine or piperidine (e.g., compounds 58, 59 and 76) is more beneficial than multiple heteroatom containing nucleus like pyridazine, pyrimidine, thiazole and pyrazole (e.g., compounds 2 and 5). Further, the descriptor B04[O-Cl] provides an information of hydrogen bonding which is later discussed in Molecular Docking Analysis section. Presence of this fragment is advantageous as seen in compounds 56 and 58. Unsaturation in these inhibitors is beneficial which is expressed by the ETA_dBeta descriptor and this is observed in compounds 58, 59 and 60. Presence of secondary amide as depicted by nRCONHR is detrimental for good inhibition (e.g., compounds 23, 24 and 25). Figures 4 and 5 show the features increasing or decreasing inhibitory activity of the compounds towards 3CLpro enzyme.
Figure 4.
Features increasing 3CLpro inhibition.
Figure 5.
Features decreasing 3CLpro inhibition.
A loading plot gives the relationship between the X-variables (descriptors) and the Y-variable (pIC50) (De et al., 2018) (Figure 6). The plot was developed using the first and second PLS components. During the plot evaluation, the distance from the origin is taken under consideration. The descriptors which are situated far from the plot origin are considered to have greater impact on the Y-response. Descriptors B04[O-Cl] and nRCONHR are furthest from the plot origin and thus can be considered to have higher impact which can further be authenticated from the VIP plot and their VIP scores (VIP > 1).
Figure 6.
Loading plot of the final PLS model.
Applicability domain
AD ‘represents a chemical space from which a model is derived and where a prediction is considered to be reliable’ (Gadaleta et al., 2016). AD evaluation was done using DModX (distance to model)in the X-space using SIMCA 16.0.2 software (https://landing.umetrics.com/downloads-simca). The AD plots are given in Figures 7 and 8 for training and test sets, respectively, and it is found that there is no outlier in case of training set and none of the compounds are outside AD in case of the test set at 99% confidence level (D-crit= 0.009999).
Figure 7.
DModX applicability domain (AD) of the training set.
Figure 8.
DModX AD of the test set.
Model randomization
Model randomization ensures about the model significance. The randomization plot is developed in order to authenticate that the model is not the result of any chance correlation (Topliss & Edwards, 1979). Development of randomized model involves generation of multiple models by shuffling different combinations of X or Y variables (here Y variable only) and based on the fit of the reordered model. In this current method we have used 100 permutations, although, the number of permutations can be changed according to users’ choice. For a model not generated out of chance correlation should have poor statistics for its randomized model ( intercept should not exceed 0.3 and intercept should not exceed 0.05). We have provided the correlation between original Y-vector and permuted Y-vector versus cumulative cumulative plots in Figure 9. This shows that the model developed (Equation (1)) is nonrandom and robust (since intercept = 0.0156 and intercept = −0.497) and is appropriate for prediction of pIC50 of 3CLpro inhibitors within the AD of the model.
Figure 9.
Randomization plot of the PLS model.
Molecular docking analysis
In the current exploration, we have performed the molecular docking studies using the most and least active compounds from the dataset. We have used the five most active compounds, i.e. 56, 57, 58, 66 and 67 and five least active compounds, i.e. 16, 21, 23, 25 and 27 from the dataset to identify the molecular interactions with the active site of 3CLpro enzyme. The details of docking interactions, binding scores, RMSD values and their relations with the features obtained from the developed 2D-QSAR model are depicted in Table 2. Now here, we have discussed the details of docking interactions with the active residues of the enzyme below.
Table 2.
Docking results and correlation with 2D-QSAR model against 3CLpro enzyme.
| S. no. | Compound number | Binding energy (kcal/mol) | RMSD (nm) | Interacting residues | Interactions | Correlation with QSAR model |
|---|---|---|---|---|---|---|
| 1 | 56 (high pIC50) | –7.49 | 0.388 | HIS A: 163, LEU A: 141, GLY A: 143, CYS A: 145, HIS A: 41, MET A: 49, MET A: 165, PRO A: 168 | Hydrogen bonding (conventional and carbon), π-donor hydrogen bond, π-π T shaped, alkyl, π-Alkyl | B04[O-Cl], ETA_dBeta and B05[C-N] |
| 2 |
57 (high pIC50) |
–7.41 | 0.332 | THR A: 190, PRO A: 168, GLU A: 166, MET A: 165, HIS A: 41, CYS A: 145, SER A: 144, GLY A: 143 | Hydrogen bonding (conventional and carbon), π-donor hydrogen bond, π-π T shaped, alkyl | B04[O-Cl], ETA_dBeta and B05[C-N] |
| 3 | 58 (high pIC50) | –6.70 | 0.329 | HIS A: 41, CYS A: 145, SER A: 144, GLY A: 143 | Hydrogen bonding (conventional and carbon), π-donor hydrogen bond, π-sigma, π-sulfur | B04[O-Cl], ETA_dBeta and B05[C-N] |
| 4 | 66 (high pIC50) | –7.44 | 0.322 | HIS A: 41, LEU A: 167, PRO A: 168, MET A: 165, GLU A: 166 | Hydrogen bonding (conventional and carbon), π-π T shaped, alkyl, π-sulfur, alkyl | B04[O-Cl], ETA_dBeta and B05[C-N] |
| 5 | 67 (high pIC50) | –6.75 | 0.510 | PHE A: 140, SER A: 144, CYS A: 145, HIS A: 41, MET A: 49, GLU A: 166 | Hydrogen bonding (conventional and carbon), sulfur-x, π- π stacked, π-cation, π-sulfur and π-Alkyl | B04[O-Cl], ETA_dBeta and B05[C-N] |
| 6 | 16 (low pIC50) | –5.77 | 0.450 | ALA A: 191, CYS A: 145 | Hydrogen bonding (conventional), π-sulfur, alkyl | nRCONHR |
| 7 | 21 (low pIC50) | –4.34 | 0.432 | GLN A: 189, THR A: 190, GLU A: 166, MET A: 165, HIS A: 164, HIS A: 163, CYS A: 145 | Hydrogen bonding (conventional and carbon),π-donor hydrogen, amide π-stacked, π-alkyl, alkyl | nRCONHR |
| 8 | 23 (low pIC50) | –5.55 | 0.386 | GLN A: 189, THR A: 190, GLN A: 192, ARG A: 188, MET A: 165, GLU A: 166, LEU A: 141 | Hydrogen bonding (conventional and carbon), π-alkyl, π-sigma, π-anion | nRCONHR |
| 9 | 25 (low pIC50) | –6.56 | 0.424 | ASN A :142, HIS A: 163, CYS A: 145, MET A: 165, HIS A: 41 | Hydrogen bonding (conventional), π-π T shaped, π-sigma, π-alkyl, π-sulfur | nRCONHR |
| 10 | 27 (low pIC50) | –4.74 | 0.362 | MET A: 165, CYS A: 145, HIS A: 41, GLU A: 166, PRO A: 168 | π-π T shaped, π-alkyl, alkyl, Halogen (Fluorine) | nRCONHR |
Molecular docking interactions analysis of the most active compounds from the dataset
In this investigation, five most active compounds (56, 57, 58, 66 and 67) from the dataset (pIC50 (with IC50 in nM) = 1.200, 1.221, 0.913, 0.906 and 0.966, respectively) interacted with the active site amino acid residues, i.e. HIS A: 163, LEU A: 141, GLY A: 143, CYS A: 145, HIS A: 141, MET A: 49, MET A: 165, PRO A: 168, THR A: 190, PRO A: 168, GLU A: 166, SER A: 144, LEU A: 167, GLN A: 189 and PHE A: 140 through interacting forces like hydrogen bonding (conventional and carbon hydrogen bonds), π-bonding (π-alkyl, π-sigma, π-cation, π-sulfur, π-π-T-shaped, π-π stacked, π-donor hydrogen bond) and alkyl hydrophobic bonds.
One of the most active compounds from the dataset, compound 56 (supporting information Figure S3) interacts with the active site amino acid residues of the enzyme through hydrogen bonding (GLY A: 143 and LEU A: 141), π-donor hydrogen bond (CYS A: 145), π-π-T-shaped (HIS A: 41), alkyl hydrophobic (PRO A: 168 and CYS A: 145) and π-alkyl (HIS A: 163, MET A: 49 and MET A: 165) interactions.
The next most active compound from the dataset, compound 57 (Figure 10), interacts with active site amino acid residues, such as GLY A: 143, SER A: 144, CYS A: 145, GLU A: 166, PRO A: 168 and THR A: 190 through hydrogen bonding, CYS A: 145 via π-donor hydrogen bonding, HIS A: 141 through π-π-T-shaped, MET A: 165 and PRO A: 168 via π-alkyl hydrophobic bonding.
Figure 10.
Docking interactions of the two most active compounds (Compound 57 and 66) from the dataset of 3CLpro enzyme inhibitors.
Another most active compound from the dataset, compound 58 (supporting information Figure S4), interacts with the active amino acid residues of the enzyme like CYS A: 145, SER A: 144 and GLY A: 143 (through hydrogen bonding), CYS A: 145 (via π-donor hydrogen bond and π-sulfur), HIS A: 41 (through π-sigma bonding).
The next most active compound from dataset, compound 66 (Figure 10), interacts with active site amino acid residues, like as GLU A: 166 via hydrogen bonding, HIS A: 41 through π-π-T-stacked, MET A: 165 and PRO A: 168 via π-alkyl hydrophobic bonding, MET A: 165, LEU A: 167 and PRO A: 168 through alkyl hydrophobic bond and MET A: 165 via π-sulfur interactions.
Figure S5 in supporting information shows that compound 67 (last most active compound from the dataset) interacts with the active amino acid residues of enzyme such as CYS A: 145, SER A: 144, GLU A: 166 and PRO A: 140 through hydrogen bonding, HIS A: 41 via π-π-stacked and π-cation bonds, MET A: 49 through π-alkyl hydrophobic bonding and CYS A: 145 through π-sulfur bonding.
Molecular docking analysis of the least active compounds from the dataset
In this investigation, five least active compounds (compound number 16, 21, 23, 25 and 27) from the dataset (pIC50 = −2.301, −2.397, −2.477, −2.544 and −2.698, respectively) interacted with the active site amino acid residues such as ALA A: 191, CYS A: 145, GLN A: 189, THR A: 190, MET A: 165, HIS A: 164, HIS A: 163, CYS A: 145, GLN A: 192, ARG A: 188, GLU A: 166, LEU A: 141, ASN A: 142, HIS A: 41 and PRO A: 168 through interacting forces like hydrogen bonding (conventional and carbon hydrogen bonds), π-bonding (π-alkyl, π-sulfur, π-donor hydrogen bond, amide π-stacked, π-sigma, π-anion, π-π-T-shaped) halogen (fluorine) and alkyl hydrophobic bonding.
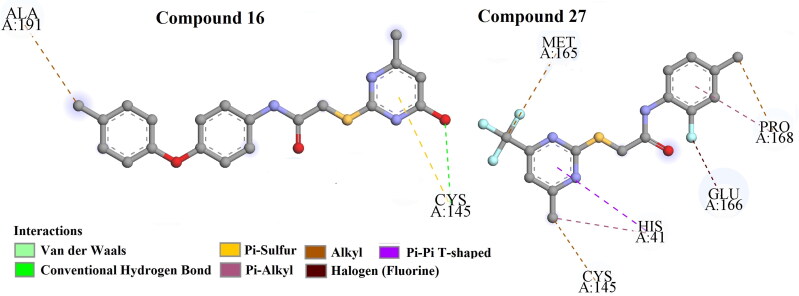
One of the least active compounds from the dataset, compound 16 (Figure 11), interacts with amino acid residues like CYS A: 145 through hydrogen bonding and π-sulfur and ALA A: 191 through hydrophobic alkyl bonds.
Figure 11.
Docking interactions of the two least active compounds (Compound 16 and 27) from the dataset of 3CLpro enzyme inhibitors.
Figure S6 in supporting information shows that compound 21, another least active compound from the dataset, interacts with the active amino acid residues of the enzyme such as THR A: 190, HIS A: 164 via hydrogen bonding, GLU A: 166 via π-donor hydrogen bonding, GLN A: 189 through amide π-stacked, CYS A: 145 through alkyl hydrophobic bond, HIS A: 163, MET A: 165 through hydrophobic π-alkyl bonds.
The next least active compound from dataset compound 23 (supporting information Figure S7), interacts with active site amino acid residues, such as THR A: 190, GLN A: 192, ARG A: 188, GLN A: 189 and LEU A: 141 (through hydrogen bonding), GLN A: 189 (via π-sigma bond), GLU A: 166 (π-anion bond), MET A: 165 and GLN A: 189 (through hydrophobic π-alkyl bond).
Another least active compound from dataset, compound 25 (supporting information Figure S8), interacts with active amino acid residues through hydrogen bonding (ASN A: 142, CYS A: 145), π-π-T-shaped and π-sigma (HIS A: 41), π-sulfur bond (HIS A: 163) and hydrophobic π-alkyl (MET A: 165 and HIS A: 41) interactions.
The last least active compound from the dataset, compound 27 (Figure 11), interacts with active amino acid residues such as HIS A: 41 (via π-π-T-shaped), MET A: 165, CYS A: 145, PRO A: 168 (through hydrophobic alkyl bonding), HIS A: 41, PRO A: 168 (via hydrophobic π-alkyl bond) and GLU A: 166 (through halogen (fluorine) bonding).
Correlation of docking analysis results with the developed 2D-QSAR model
From the above investigations, we have concluded that the formation of hydrogen bonding (conventional, carbon and π-donor hydrogen) and π-interaction (π-π-T shaped, π-π stacked, π-alkyl, π-cation, π-sigma and π-sulphur) between the ligand and target enzyme may play an essential role in the interactions. Hydrogen bonding (conventional, carbon and π-donor hydrogen) may be associated with the descriptors such as B04[O-Cl] and B05[C-N] of the developed 2D-QSAR model. The descriptors ETA_dBeta and B04[O-Cl] are well corroborated with interactions via π- interactions (π-π-T shaped, π-π stacked, π-alkyl, π-cation, π-sigma and π-sulphur) between the receptor and a ligand. All these descriptors contributed positively in the developed model and are essential features for the inhibitory activity against the 3CLpro enzyme. The above mentioned features are observed in most active compounds from the dataset such as 56, 57, 58, 66 and 67. In contrast, the descriptors nRCONHR, contributed negatively in the 2D-QSAR model, and thus, might be detrimental for the inhibitory activity, and this has been observed in the least active compound number 23, 25, 27, 16 and 21. Thus, from above observations, we can conclude that features obtained from molecular docking studies well corroborated with the features obtained from the 2D-QSAR model, and these are crucial for the inhibitory activity against 3CLpro enzyme.
MD simulation analysis
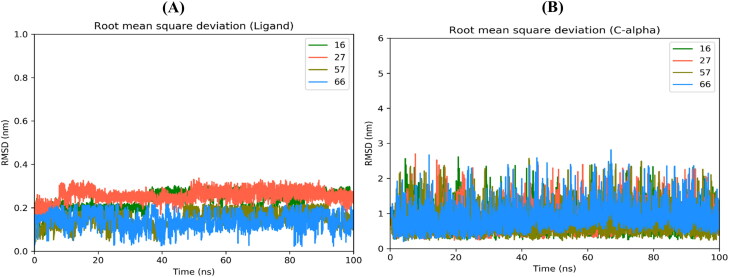
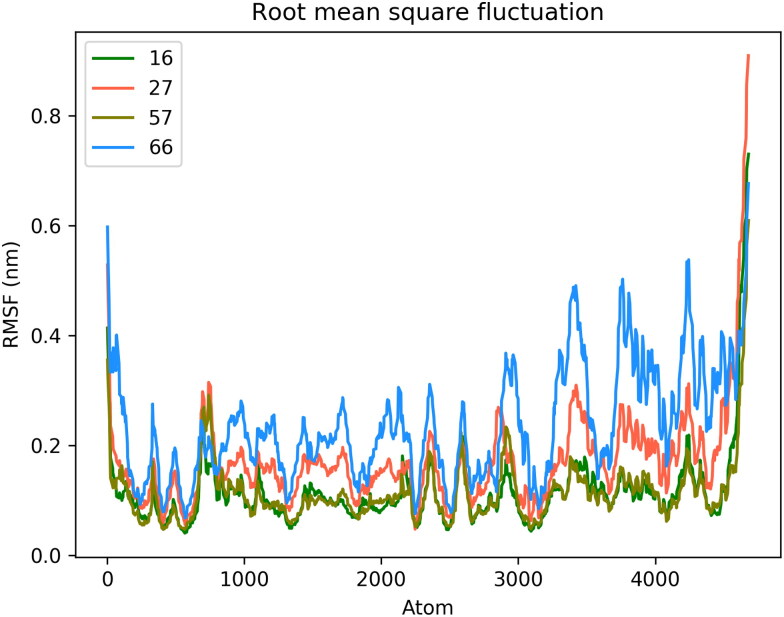
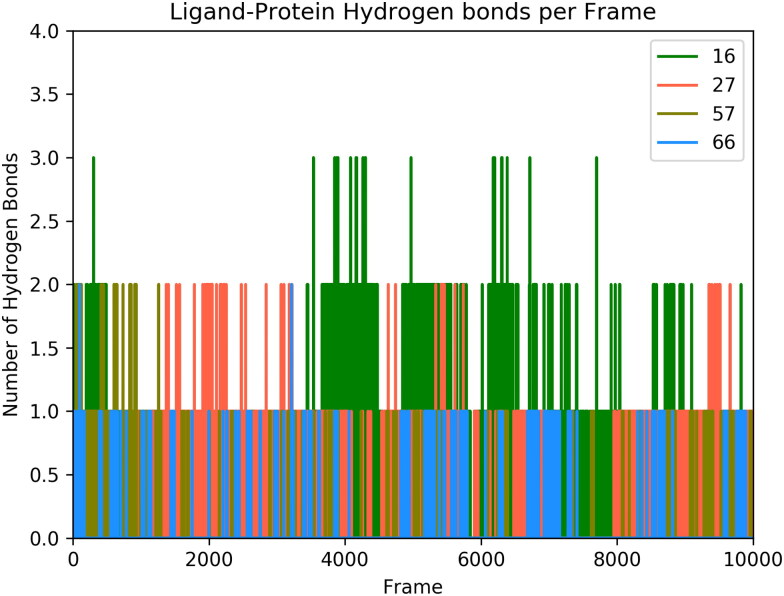
After completion of the MD simulation, root mean square deviations of protein c-alpha atoms and the ligand were calculated to study the stability of the protein-ligand complexes for compounds 16, 27, 57 and 66 as depicted in Figure 12 (and for compounds 21, 23, 25, 56, 58, 67 as shown in Figure S9 of supporting information). In all systems, the c-alpha atoms show stable RMSD at around 1 nm while ligands show RMSD values less than 0.4 nm during their respective MD simulation time. All ligands move from the initial position and try to best fit into the binding site of the protein as shown in Figure 13 and supporting information Figure S10. During the 100 ns MD run, it is observed that Compound 27 detaches itself from the binding site. However, after 80 ns it again binds to protein near the edge of the ligand-binding site. Because of this, Compound 27 shows a high RMSD and low average binding affinity (ΔGBind) −50.87 KJ/mol. Similarly, Compound 57 detaches itself from the binding site at 24 ns and binds to a completely different pocket in protein which is present near the original ligand-binding site. This caused a decrease in average ΔGBind (–54.80 KJ/mol). Compounds 23, 27 and 57 show more fluctuations in RMSD compared to other compounds and are not able to accommodate into a cavity as the simulation progresses. Compounds 16 and 66 remain bound to the binding site throughout the 100 ns simulation and show high average ΔGBind of −72.52 and −77.37 KJ/mol, respectively. Compound 56 flips and orients itself in the binding site cavity to acquire and stabilize into a completely different position from the initial position (supporting information Figure S10). Root mean square fluctuation (RMSF) was calculated to study the change in the position of protein atoms during MD simulation, as depicted in Figure 14 and supporting information Figure S11. Loop residues regions SER 1 – PRO 9, LEU 50 – ASN 53, ASP 153 – ASP 155, PRO 168 – THR 169, ALA 191 – ILE 200, ASP 216 – PHE 223 and GLY 302 – GLN 306 show high RMSF deviation. The RMSF deviation of these loop region residues shows high during when the protein is complexed with Compounds 66, 25 and 27. Hydrogen bond analysis between ligands and protein suggests (Figure 15 and supporting information Figure S12 and Table 3 and supporting information Table S1) that compound 66 shows the least H-bonding with protein, while compounds 16, 25, 67 interact more with protein through H-bond compared to other ligands. THR 26, HIS 41, GLY 143, CYS 145, GLU 166, GLN 189 and GLN 192 are the most common amino acid residues involved in H-bonding interaction with the ligands. The binding free energy (ΔGBind) was calculated by using various contributing energy components such as van der Waals (vdW), electrostatic, polar solvation and solvent accessible surface area (SASA) energies (Table 4 and supporting information Table S2). In the case of Compound 66 complexed with protein, the least negative contribution of polar solvation energy helps an increase in average ΔGBind. Compound 23 shows the highest affinity towards the protein with an average ΔGBind of −88.14 KJ/mol followed by compound 21 with an average ΔGBind of −82.24 KJ/mol. In both the cases, vdW and electrostatic energies contributed highest compared to other ligands resulting in a high binding affinity towards protein. The per residue contribution of energy during MD simulation is depicted in Figure 16 and supporting information Figure S13. The residues GLU 47, LEU 41, MET 49, CYC 145, MET 165, GLU 166, LEU 167 and PRO 168 were found to contribute positively while residues ARG 45, PRO 39, SER 147, GLU 166, ASP 187 and HIS 164 contributed negatively towards binding free energy of the protein–ligand complex. To conclude, the MD simulation study of the protein complex with different compounds suggests compounds 16, 21, 25, 58, 66 and 67 showed stable interaction and affinity against the protein binding site.
Figure 12.
Root mean square deviation of (A) Ligand and (B) Protein C-alpha atoms.
Figure 13.
Movement of ligands in protein binding site during 100 ns of MD simulation.
Figure 14.
Root mean square fluctuation of protein backbone atoms during MD simulation.
Figure 15.
Number of hydrogen bonds formed by ligand with protein during MD simulation.
Table 3.
Percentage hydrogen bond interaction shown by ligand during MD simulation with various amino acid residues.
| Compound | Percentage H-bond interaction |
||||||||||||||||||
|---|---|---|---|---|---|---|---|---|---|---|---|---|---|---|---|---|---|---|---|
| GLY 23 | THR 24 |
THR 25 |
THR 26 |
HIS 41 |
SER 46 |
SER 139 |
TYR 118 |
ASN 119 | ASN 142 | GLY 143 |
SER 144 | CYS 145 |
HIS 163 |
GLU 166 | HIS 172 |
GLN 189 | THR 190 |
GLN 192 |
|
| 16 | – | 0.50 | 0.53 | 12.16 | 15.22 | 0.88 | – | – | 3.00 | 0.75 | – | 0.01 | 0.01 | 1.33 | 1.29 | 0.06 | 1.67 | 0.01 | 0.81 |
| 27 | 7.68 | – | – | 0.69 | – | 0.35 | – | – | – | – | – | – | – | – | 2.78 | – | 1.64 | 0.29 | 4.52 |
| 57 | – | 0.05 | – | 0.10 | – | 0.03 | 0.39 | 2.07 | 0.01 | 0.05 | 0.16 | 0.08 | 0.01 | – | 0.03 | – | 0.16 | 0.03 | 2.07 |
| 66 | – | – | 1.52 | 0.43 | – | 0.51 | – | – | – | 0.54 | – | – | – | – | 0.26 | – | 0.22 | – | – |
Table 4.
Average binding free energy (KJ/mol) of ligands obtained from MD simulation with its energy components.
| Compound | van der Waal energy (ΔGvdW) | Electrostatic energy (ΔGElect) | Polar solvation energy (ΔGPolar) | SASA energy (ΔGSASA) | Binding energy (ΔGBind) |
|---|---|---|---|---|---|
| 16 | –152.51 ± 19.27 | –31.51 ± 16.80 | 129.53 ± 20.30 | –18.02 ± 1.71 | –72.52 ± 18.30 |
| 27 | –97.25 ± 26.23 | –13.10 ± 11.90 | 71.53 ± 29.77 | –12.02 ± 2.74 | –50.87 ± 18.40 |
| 57 | –104.37 ± 28.57 | –10.05 ± 9.12 | 71.96 ± 27.23 | –12.33 ± 2.94 | –54.80 ± 22.87 |
| 66 | –122.53 ± 12.73 | –6.19 ± 6.62 | 65.45 ± 13.28 | –14.09 ± 1.42 | –77.37 ± 9.94 |
Figure 16.
Per residue energy contribution during 100 ns of MD simulation.
Screening of the external datasets
In silico virtual screening and computer-aided drug design methodologies allow an initial screening of large databases based on molecular properties and/or substructures, thereby saving both time and money involved in synthesising and analysing each of the molecules available in the database. This, in turn, reduces the number of molecules to be synthesized and analyzed by identifying the hit compounds only. In the present work, we have utilised three databases of 8722 antivirals, 11,309 peptidomimetics and 6968 proteases obtained from Asinex (http://www.asinex.com/) to determine their pIC50 values using our developed model (Model 1). Furthermore, the domain of applicability and their predictive reliability are analyzed using Prediction Reliability Indicator tool (Roy et al., 2018). According to the prediction score obtained from Prediction Reliability Indicator tool, many compounds showed ‘Good’ to ‘Moderate’ prediction quality. The trend of the composite score and their corresponding prediction quality goes like: Composite Score: 3→Prediciton Quality: Good; Composite Score: 2→Prediciton Quality: Moderate; Composite Score: 1→Prediciton Quality: Bad. Further we have sorted the compounds in descending order of their predicted pIC50 values (highest to lowest) and reported the best 25 compounds for each dataset in Tables 5–7.
Table 5.
Prediction quality for top 25 screened compounds from Asinex antiviral dataset.
| ID number | Molecular structure | Predicted pIC50(µM) | Prediction quality | AD status |
|---|---|---|---|---|
| LAS 51378701 |  |
0.696 | Good | In |
| LAS 51378759 |  |
0.682 | Good | In |
| LAS 51378817 | 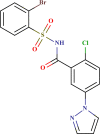 |
0.681 | Good | In |
| LAS 51378875 | 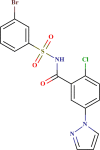 |
0.681 | Good | In |
| LAS 51378277 |  |
0.667 | Good | In |
| LAS 51378353 |  |
0.667 | Good | In |
| LAS 51378411 |  |
0.637 | Good | In |
| LAS 51378290 |  |
0.607 | Good | In |
| LAS 51378366 |  |
0.607 | Good | In |
| LAS 52181788 |  |
0.607 | Good | In |
| LAS 51378469 |  |
0.592 | Good | In |
| LAS 51378424 |  |
0.578 | Good | In |
| LAS 51378585 |  |
0.548 | Good | In |
| LAS 51378643 |  |
0.548 | Good | In |
| LAS 51378703 |  |
0.239 | Good | In |
| LAS 51378761 |  |
0.224 | Good | In |
| LAS 51378819 |  |
0.224 | Good | In |
| LAS 51378877 |  |
0.224 | Good | In |
| LAS 51378279 |  |
0.209 | Good | In |
| LAS 51378355 |  |
0.209 | Good | In |
| LAS 51378413 |  |
0.180 | Good | In |
| LAS 51183609 |  |
0.162 | Good | In |
| LAS 51183637 | 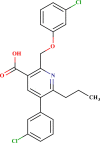 |
0.162 | Good | In |
| LAS 51378471 |  |
0.136 | Good | In |
| LAS 51183656 | 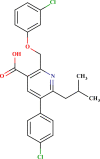 |
0.132 | Good | In |
Table 6.
Prediction quality for top 25 screened compounds from Asinex peptidomimetic dataset.
| ID number | Molecular structure | Predicted pIC50(µM) | Prediction quality | AD status |
|---|---|---|---|---|
| BDE 27113102 |  |
–0.081 | Moderate | In |
| BDE 27113198 |  |
–0.231 | Good | In |
| BDE 27112871 |  |
–0.270 | Good | In |
| LAS 27113276 |  |
–0.296 | Moderate | In |
| BDI 34058392 |  |
–0.359 | Good | In |
| BDE 23424631 |  |
–0.422 | Good | In |
| BDI 34056869 |  |
–0.526 | Moderate | In |
| BDE 27113324 |  |
–0.611 | Good | In |
| BDE 27112842 |  |
–0.670 | Good | In |
| LAS 52336079 |  |
–0.835 | Moderate | In |
| BDG 34135491 |  |
–0.887 | Moderate | In |
| BDH 34035638 |  |
–0.942 | Moderate | In |
| LAS 51438391 |  |
–0.965 | Moderate | In |
| BDE 25377325 |  |
–1.112 | Good | In |
| BDE 25373231 |  |
–1.142 | Moderate | In |
| LAS 51146228 |  |
–1.173 | Good | In |
| BDE 32387832 | 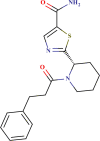 |
–1.176 | Good | In |
| LAS 51145916 |  |
–1.202 | Good | In |
| LAS 51146239 |  |
–1.202 | Good | In |
| LAS 51146119 |  |
–1.217 | Good | In |
| LAS 51146173 |  |
–1.217 | Good | In |
| LAS 51146224 |  |
–1.217 | Good | In |
| LAS 51146225 |  |
–1.217 | Good | In |
| LAS 51146272 |  |
–1.217 | Good | In |
| LAS 51146294 |  |
–1.217 | Good | In |
Table 7.
Prediction quality for top 25 screened compounds from Asinex protease dataset.
| ID number | Molecular structure | Predicted pIC50(µM) | Prediction quality | AD status |
|---|---|---|---|---|
| AOP 17129996 |  |
0.348 | Good | In |
| SYN 10404355 |  |
0.334 | Good | In |
| SYN 17737241 |  |
0.218 | Good | In |
| SYN 17741468 |  |
0.204 | Good | In |
| SYN 17739882 |  |
0.189 | Good | In |
| SYN 15638339 |  |
0.152 | Good | In |
| SYN 15585842 |  |
–0.010 | Good | In |
| SYN 17736264 |  |
–0.025 | Good | In |
| SYN 17736294 |  |
–0.025 | Good | In |
| AEM 10398707 |  |
–0.201 | Good | In |
| AAM 15780027 | 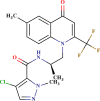 |
–0.237 | Good | In |
| SYN 17737014 |  |
–0.296 | Moderate | In |
| AEM 14734202 |  |
–0.303 | Good | In |
| SYN 15653092 |  |
–0.341 | Good | In |
| ADM 13083811 |  |
–0.344 | Good | In |
| SYN 15586911 |  |
–0.352 | Good | In |
| SYN 15636256 |  |
–0.430 | Good | In |
| ADM 13084099 |  |
–0.437 | Good | In |
| AEM 10404137 |  |
–0.490 | Good | In |
| SYN 15713762 |  |
–0.490 | Good | In |
| AAM 10377358 |  |
–0.513 | Good | In |
| AEM 14733257 |  |
–0.518 | Good | In |
| AEM 14733779 |  |
–0.548 | Good | In |
| SYN 15638387 | 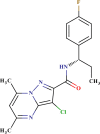 |
–0.568 | Good | In |
| SYN 15731599 |  |
–0.579 | Good | In |
Conclusion
The SARS CoV 3C-like protease (3CLpro or Mpro) is a striking target for the development of anti-SARS drugs because of its critical role in viral replication and transcription. Due to high structural closeness between the enzymes in the old strain SARS CoV and the novel SARS CoV-2, the compounds inhibiting the former enzyme could be expected to show similar interactions with the latter. The present study aims at developing a 2D-QSAR model for a series of compounds acting as 3CLpro inhibitors and studying the structural features of those molecules controlling their 3CLpro inhibition (pIC50). The basic features found to control the better inhibition were: (i) presence of single nitrogen containing heteroatoms; (ii) unsaturation; and (iii) hydrogen bonding. These findings were further corroborated with docking analysis studies. Further, we have predicted three large databases and reported top 25 compounds from each database which can further be subjected to experimental testing. Thus, it can be inferred that in silico methods like QSAR provide a basic understanding of physicochemical features of small molecules required for interactions with a specific target, and also it helps in prediction of a large database in a very short period, thus, reducing high experimentation cost.
Supplementary Material
Funding Statement
PD thanks Indian Council of Medical Research, New Delhi, for awarding with a Senior Research Fellowship, Financial assistance from the Indian Council of Medical Research (ICMR), New Delhi in the form of a senior research fellowship (File No: 5/3/8/27/ITR-F/2018-ITR; dated: 18.05.2018) to VK is thankfully acknowledged, KR thanks SERB, Govt. of India for financial assistance under the MATRICS scheme (MTR/2019/000008). SB likes to acknowledge financial support from the Science and Engineering Research Board (SERB), India, under grant EMR/2016/002141.
Disclosure statement
No potential conflict of interest was reported by the authors.
Weblinks
Asinex. Available at http://www.asinex.com/. Accessed on 19 May 2020.
Autodockvina 1.5.6 tool. Available at http://autodock.scripps.edu/resources/adt. Accessed on 18 May 2020.
MarvinSketch software. Available at https://www.chemaxon.com. Accessed on 19 May 2020.
OCHEM or Online Chemical Database. Available at https://ochem.eu/home/show.do. Accessed on 21Jun 2020.
PDBsum. Available at http://www.ebi.ac.uk/thornton-srv/databases/cgi-bin/pdbsum/GetPage.pl?pdbcode=2zu4&template=ligands.html&l=1.1. Accessed on 18 May 2020.
Simca 16.0.2 Available at https://landing.umetrics.com/downloads-simca
WHO Timeline - COVID-19. Available at https://www.who.int/news-room/detail/27-04-2020-who-timeline---covid-19. Accessed on 02 Jun 2020.
References
- Akarachantachote, N., Chadcham, S., & Saithanu, K. (2014). Cutoff threshold of variable importance in projection for variable selection. International Journal of Pure and Applied Mathematics, 94(3), 307–322. [Google Scholar]
- Chen, L. R., Wang, Y. C., Lin, Y. W., Chou, S. Y., Chen, S. F., Liu, L. T., Wu, Y. T., Kuo, C. J., Chen, T. S. S., & Juang, S. H. (2005). Synthesis and evaluation of isatin derivatives as effective SARS coronavirus 3CL protease inhibitors. Bioorganic & Medicinal Chemistry Letters, 15(12), 3058–3062. 10.1016/j.bmcl.2005.04.027 [DOI] [PMC free article] [PubMed] [Google Scholar]
- Chen, Y. W., Yiu, C. P. B., & Wong, K. Y. (2020). Prediction of the SARS-CoV-2 (2019-nCoV) 3C-like protease (3CL pro) structure: Virtual screening reveals velpatasvir, ledipasvir, and other drug repurposing candidates. F1000Research, 9, 129. 10.12688/f1000research.22457.2 [DOI] [PMC free article] [PubMed] [Google Scholar]
- De, P., Aher, R. B., & Roy, K. (2018). Chemometricmodeling of larvicidal activity of plant derived compounds against zika virus vector Aedes aegypti: Application of ETA indices. RSC Advances, 8(9), 4662–4670. 10.1039/C7RA13159C [DOI] [PMC free article] [PubMed] [Google Scholar]
- Del Rio, C., & Malani, P. N. (2020). COVID-19—new insights on a rapidly changing epidemic. JAMA, 323(14), 1339–1340. 10.1001/jama.2020.3072 [DOI] [PubMed] [Google Scholar]
- Devillers, J. (1996). Genetic algorithms in molecular modeling. Academic Press. [Google Scholar]
- Dömling, A., & Gao, L. (2020). Chemistry and Biology of SARS-CoV-2. Chem, 6(6), 1283–1295. 10.1016/j.chempr.2020.04.023 [DOI] [PMC free article] [PubMed] [Google Scholar]
- Fan, K., Wei, P., Feng, Q., Chen, S., Huang, C., Ma, L., Lai, B., Pei, J., Liu, Y., Chen, J., & Lai, L. (2004). Biosynthesis, purification, and substrate specificity of severe acute respiratory syndrome coronavirus 3C-like proteinase. The Journal of Biological Chemistry, 279(3), 1637–1642. 10.1074/jbc.M310875200 [DOI] [PMC free article] [PubMed] [Google Scholar]
- Fung, T. S., & Liu, D. X. (2019). Human coronavirus: Host-pathogen interaction. Annual Review of Microbiology, 73, 529–557. 10.1146/annurev-micro-020518-115759 [DOI] [PubMed] [Google Scholar]
- Gadaleta, D., Mangiatordi, G. F., Catto, M., Carotti, A., & Nicolotti, O. (2016). Applicability domain for QSAR models: Where theory meets reality. International Journal of Quantitative Structure-Property Relationships, 1(1), 45–63. 10.4018/IJQSPR.2016010102 [DOI] [Google Scholar]
- Goetz, D. H., Choe, Y., Hansell, E., Chen, Y. T., McDowell, M., Jonsson, C. B., Roush, W. R., McKerrow, J., & Craik, C. S. (2007). Substrate specificity profiling and identification of a new class of inhibitor for the major protease of the SARS coronavirus. Biochemistry, 46(30), 8744–8752. 10.1021/bi0621415 [DOI] [PubMed] [Google Scholar]
- Gramatica, P. (2020). Principles of QSAR Modeling: Comments and Suggestions from Personal Experience. International Journal of Quantitative Structure-Property Relationships, 5(3), 61–97. 10.4018/IJQSPR.20200701.oa1 [DOI] [Google Scholar]
- Huang, J., & MacKerell, A. D. Jr. (2013). CHARMM36 all‐atom additive protein force field: Validation based on comparison to NMR data. Journal of Computational Chemistry, 34(25), 2135–2145. 10.1002/jcc.23354 [DOI] [PMC free article] [PubMed] [Google Scholar]
- Humphrey, W., Dalke, A., & Schulten, K. (1996). VMD: Visual molecular dynamics. Journal of Molecular Graphics, 14(1), 33–38. 10.1016/0263-7855(96)00018-5 [DOI] [PubMed] [Google Scholar]
- Jackson, J. E. (2005). A user's guide to principal components (Vol. 587). Wiley. [Google Scholar]
- Jin, Z., Du, X., Xu, Y., Deng, Y., Liu, M., Zhao, Y., Zhang, B., Li, X., Zhang, L., Peng, C. & Duan, Y. (2020). Structure of Mpro from SARS-CoV-2 and discovery of its inhibitors. Nature, 582, 289–293. 10.1038/s41586-020-2223-y [DOI] [PubMed] [Google Scholar]
- Kumar, V., & Roy, K. (2020). Development of a simple, interpretable and easily transferable QSAR model for quick screening antiviral databases in search of novel 3C-like protease (3CLpro) enzyme inhibitors against SARS-CoV diseases. SAR QSAR Environ Res, 31(7), 511–526. 10.1080/1062936X.2020.1776388 [DOI] [PubMed] [Google Scholar]
- Kumari, R., Kumar, R., Lynn, A., & Open Source Drug Discovery Consortium. (2014). g_mmpbsa-a GROMACS tool for high-throughput MM-PBSA calculations. Journal of Chemical Information and Modeling, 54(7), 1951–1962. 10.1021/ci500020m [DOI] [PubMed] [Google Scholar]
- Lee, N., Hui, D., Wu, A., Chan, P., Cameron, P., Joynt, G. M., Ahuja, A., Yung, M. Y., Leung, C. B., To, K. F., Lui, S. F., Szeto, C. C., Chung, S., & Sung, J. J. Y. (2003). A major outbreak of severe acute respiratory syndrome in Hong Kong. The New England Journal of Medicine, 348(20), 1986–1994. 10.1056/NEJMoa030685 [DOI] [PubMed] [Google Scholar]
- Liu, W., Zhu, H. M., Niu, G. J., Shi, E. Z., Chen, J., Sun, B., Chen, W. Q., Zhou, H. G., & Yang, C. (2014). Synthesis, modification and docking studies of 5-sulfonyl isatin derivatives as SARS-CoV 3C-like protease inhibitors. Bioorganic & Medicinal Chemistry, 22(1), 292–302. 10.1016/j.bmc.2013.11.028 [DOI] [PMC free article] [PubMed] [Google Scholar]
- Lu, I. L., Mahindroo, N., Liang, P. H., Peng, Y. H., Kuo, C. J., Tsai, K. C., Hsieh, H. P., Chao, Y. S., & Wu, S. Y. (2006). Structure-based drug design and structural biology study of novel nonpeptide inhibitors of severe acute respiratory syndrome coronavirus main protease. Journal of Medicinal Chemistry, 49(17), 5154–5161. 10.1021/jm060207o [DOI] [PubMed] [Google Scholar]
- Makov, G., & Payne, M. C. (1995). Periodic boundary conditions in ab initio calculations. Physical Review B, 51(7), 4014–4022. 10.1103/PhysRevB.51.4014 [DOI] [PubMed] [Google Scholar]
- Mark, P., & Nilsson, L. (2001). Structure and dynamics of the TIP3P, SPC, and SPC/E water models at 298 K. The Journal of Physical Chemistry A, 105(43), 9954–9960. 10.1021/jp003020w [DOI] [Google Scholar]
- Niu, C., Yin, J., Zhang, J., Vederas, J. C., & James, M. N. (2008). Molecular docking identifies the binding of 3-chloropyridine moieties specifically to the S1 pocket of SARS-CoVMpro. Bioorganic & Medicinal Chemistry, 16(1), 293–302. [DOI] [PMC free article] [PubMed] [Google Scholar]
- Ojha, P. K., Mitra, I., Das, R. N., & Roy, K. (2011). Further exploring rm2 metrics for validation of QSPR models. Chemometrics and Intelligent Laboratory Systems, 107(1), 194–205. 10.1016/j.chemolab.2011.03.011 [DOI] [Google Scholar]
- Park, H. S., & Jun, C. H. (2009). A simple and fast algorithm for K-medoids clustering. Expert Systems with Applications, 36(2), 3336–3341. 10.1016/j.eswa.2008.01.039 [DOI] [Google Scholar]
- Park, J. Y., Kim, J. H., Kim, Y. M., Jeong, H. J., Kim, D. W., Park, K. H., Kwon, H. J., Park, S. J., Lee, W. S., & Ryu, Y. B. (2012). Tanshinones as selective and slow-binding inhibitors for SARS-CoV cysteine proteases. Bioorganic & Medicinal Chemistry, 20(19), 5928–5935. 10.1016/j.bmc.2012.07.038 [DOI] [PMC free article] [PubMed] [Google Scholar]
- Peiris, J. S. M., Lai, S. T., Poon, L. L. M., Guan, Y., Yam, L. Y. C., Lim, W., Nicholls, J., Yee, W. K. S., Yan, W. W., Cheung, M. T., Cheng, V. C. C., Chan, K. H., Tsang, D. N. C., Yung, R. W. H., Ng, T. K., & Yuen, K. Y. (2003). Coronavirus as a possible cause of severe acute respiratory syndrome. The Lancet, 361(9366), 1319–1325. 10.1016/S0140-6736(03)13077-2 [DOI] [PMC free article] [PubMed] [Google Scholar]
- Petersen, H. G. (1995). Accuracy and efficiency of the particle mesh Ewald method. The Journal of Chemical Physics, 103(9), 3668–3679. 10.1063/1.470043 [DOI] [Google Scholar]
- Rizvi, S. M. D., Shakil, S., & Haneef, M. (2013). A simple click by click protocol to perform docking: AutoDock 4.2 made easy for non-bioinformaticians. EXCLI Journal, 12, 831–857. [PMC free article] [PubMed] [Google Scholar]
- Roy, K. (Ed.). (2015). Quantitative structure-activity relationships in drug design, predictive toxicology, and risk assessment. IGI Global. [Google Scholar]
- Roy, K. (2018). Quantitative structure-activity relationships (QSARs): A few validation methods and software tools developed at the DTC laboratory. Journal of the Indian Chemical Society, 95(12), 1497–1502. [Google Scholar]
- Roy, K., & Ambure, P. (2016). The “double cross-validation” software tool for MLR QSAR model development. Chemometrics and Intelligent Laboratory Systems, 159, 108–126. 10.1016/j.chemolab.2016.10.009 [DOI] [Google Scholar]
- Roy, K., Ambure, P., & Kar, S. (2018). How precise are our quantitative Structure-Activity Relationship Derived Predictions for New Query Chemicals? ACS Omega, 3(9), 11392–11406. 10.1021/acsomega.8b01647 [DOI] [PMC free article] [PubMed] [Google Scholar]
- Roy, K., Das, R. N., Ambure, P., & Aher, R. B. (2016). Be aware of error measures. Further studies on validation of predictive QSAR models. Chemometrics and Intelligent Laboratory Systems, 152, 18–33. 10.1016/j.chemolab.2016.01.008 [DOI] [Google Scholar]
- Roy, K., & Ghosh, G. (2010). Exploring QSARs with extended topochemical atom (ETA) indices for modeling chemical and drug toxicity. Current Pharmaceutical Design, 16(24), 2625–2639. 10.2174/138161210792389270 [DOI] [PubMed] [Google Scholar]
- Roy, K., & Mitra, I. (2011). On various metrics used for validation of predictive QSAR models with applications in virtual screening and focused library design. Combinatorial Chemistry & High Throughput Screening, 14(6), 450–474. 10.2174/138620711795767893 [DOI] [PubMed] [Google Scholar]
- Roy, P. P., Leonard, J. T., & Roy, K. (2008). Exploring the impact of size of training sets for the development of predictive QSAR models. Chemometrics and Intelligent Laboratory Systems, 90(1), 31–42. 10.1016/j.chemolab.2007.07.004 [DOI] [Google Scholar]
- Soteras Gutiérrez, I., Lin, F.-Y., Vanommeslaeghe, K., Lemkul, J. A., Armacost, K. A., Brooks, C. L., & MacKerell, A. D. (2016). Parametrization of halogen bonds in the CHARMM general force field: Improved treatment of ligand–protein interactions. Bioorganic & Medicinal Chemistry, 24(20), 4812–4825. 10.1016/j.bmc.2016.06.034 [DOI] [PMC free article] [PubMed] [Google Scholar]
- Thiel, V., Ivanov, K. A., Putics, Á., Hertzig, T., Schelle, B., Bayer, S., Weißbrich, B., Snijder, E. J., Rabenau, H., Doerr, H. W., Gorbalenya, A. E., & Ziebuhr, J. (2003). Mechanisms and enzymes involved in SARS coronavirus genome expression. The Journal of General Virology, 84(Pt 9), 2305–2315. 10.1099/vir.0.19424-0 [DOI] [PubMed] [Google Scholar]
- Topliss, J. G., & Edwards, R. P. (1979). Chance factors in studies of quantitative structure-activity relationships. Journal of Medicinal Chemistry, 22(10), 1238–1244. 10.1021/jm00196a017 [DOI] [PubMed] [Google Scholar]
- Toropova, M. A. (2017). Drug metabolism as an object of computational analysis by the Monte Carlo method. Current Drug Metabolism, 18(12), 1123–1131. 10.2174/1389200218666171010124733 [DOI] [PubMed] [Google Scholar]
- Tsai, K.-C., Chen, S.-Y., Liang, P.-H., Lu, I.-L., Mahindroo, N., Hsieh, H.-P., Chao, Y.-S., Liu, L., Liu, D., Lien, W., Lin, T.-H., & Wu, S.-Y. (2006). Discovery of a novel family of SARS-CoV protease inhibitors by virtual screening and 3D-QSAR studies. Journal of Medicinal Chemistry, 49(12), 3485–3495. 10.1021/jm050852f [DOI] [PubMed] [Google Scholar]
- Van Der Spoel, D., Lindahl, E., Hess, B., Groenhof, G., Mark, A. E., & Berendsen, H. J. (2005). GROMACS: Fast, flexible, and free. Journal of Computational Chemistry, 26(16), 1701–1718. 10.1002/jcc.20291 [DOI] [PubMed] [Google Scholar]
- Wan, Y., Shang, J., Graham, R., Baric, R. S., & Li, F. (2020). Receptor recognition by the novel coronavirus from Wuhan: An analysis based on decade-long structural studies of SARS coronavirus. Journal of Virology, 94(7), e00127-20. 10.1128/JVI.00127-20 [DOI] [PMC free article] [PubMed] [Google Scholar]
- Wold, S., Sjöström, M., & Eriksson, L. (2001). PLS-regression: A basic tool of chemometrics. Chemometrics and Intelligent Laboratory Systems, 58(2), 109–130. 10.1016/S0169-7439(01)00155-1 [DOI] [Google Scholar]
- Yap, C. W. (2011). PaDEL-descriptor: An open source software to calculate molecular descriptors and fingerprints. Journal of Computational Chemistry, 32(7), 1466–1474. 10.1002/jcc.21707 [DOI] [PubMed] [Google Scholar]
- Zhavoronkov, A., Zagribelnyy, B., Zhebrak, A., Aladinskiy, V., Terentiev, V., Vanhaelen, Q., Bezrukov, D. S., Polykovskiy, D., Shayakhmetov, R., Filimonov, A., & Bishop, M. (2020). Potential non-covalent SARS-CoV-2 3C-like protease inhibitors designed using generative deep learning approaches and reviewed by human medicinal chemist in virtual reality. ChemRxriv. 10.26434/chemrxiv.12301457.v1 [DOI]
Associated Data
This section collects any data citations, data availability statements, or supplementary materials included in this article.


